The Toolbox
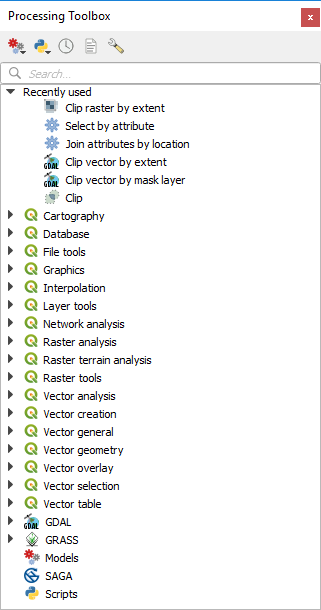
The Processing Toolbox is the main element of the processing GUI, and the one that you are more likely to use in your daily work. It shows the list of all available algorithms grouped in different blocks called Providers, and custom models and scripts you can add to extend the set of tools. Hence the toolbox is the access point to run them, whether as a single process or as a batch process involving several executions of the same algorithm on different sets of inputs.
공간 처리 툴박스
Providers can be (de)activated in the Processing settings dialog. By default, only providers that do not rely on third-party applications (that is, those that only require QGIS elements to be run) are active. Algorithms requiring external applications might need additional configuration. Configuring providers is explained in a later chapter in this manual.
In the upper part of the toolbox dialog, you will find a set of tools to:
work with
 Models: Create New Model…,
Open Existing Model… and Add Model to Toolbox…;
Models: Create New Model…,
Open Existing Model… and Add Model to Toolbox…;work with
 Scripts: Create New Script…,
Create New Script from Template…, Open Existing
Script… and Add Script to Toolbox…;
Scripts: Create New Script…,
Create New Script from Template…, Open Existing
Script… and Add Script to Toolbox…;open the
 History panel;
open the
 Results Viewer panel;
toggle the toolbox to the in-place modification mode using the
 Edit Features In-Place button: only
the algorithms that are suitable to be executed on the active layer without
outputting a new layer are displayed;
Edit Features In-Place button: only
the algorithms that are suitable to be executed on the active layer without
outputting a new layer are displayed;open the
 Options dialog.
Below this toolbar is a  Search… box to help you easily find
the tools you need.
You can enter any word or phrase on the text box. Notice that, as you type, the
number of algorithms, models or scripts in the toolbox is reduced to just those
that contain the text you have entered in their names or keywords.
Search… box to help you easily find
the tools you need.
You can enter any word or phrase on the text box. Notice that, as you type, the
number of algorithms, models or scripts in the toolbox is reduced to just those
that contain the text you have entered in their names or keywords.
참고
At the top of the list of algorithms are displayed the most recent used tools; handy if you want to reexecute any.
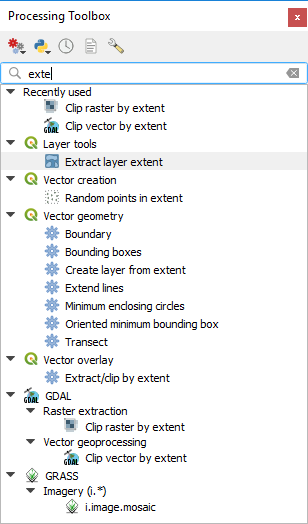
검색 결과를 표시하는 공간 처리 툴박스
To execute a tool, just double-click on its name in the toolbox.
알고리즘 대화창
Once you double-click on the name of the algorithm that you want to execute, a
dialog similar to that in the figure below is shown (in this case, the dialog
corresponds to the Centroids algorithm).
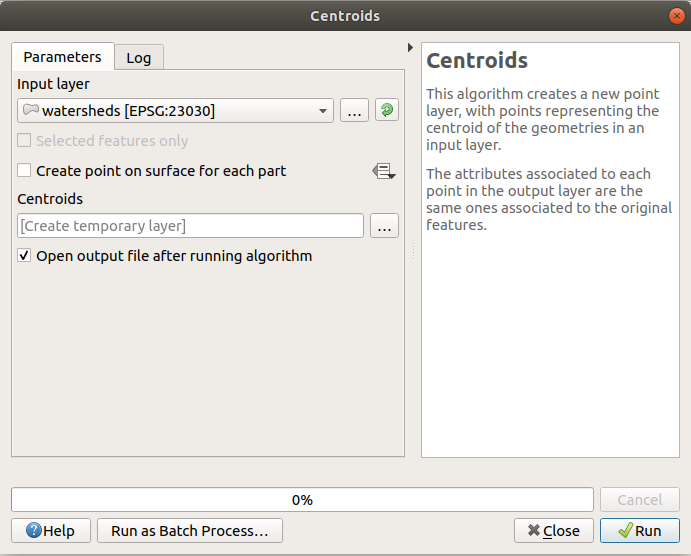
Algorithm Dialog - Parameters
이 탭에서 알고리즘을 실행하는 데 필요한 입력값들을 설정할 수 있습니다. 이 탭은 설정해야 할 입력값 및 환경 설정 파라미터 목록을 표시합니다. 물론 실행할 알고리즘의 요구 사항에 따라 목록 내용이 달라지며, 해당 요구 사항을 기반으로 자동적으로 생성됩니다.
알고리즘의 특성에 따라 파라미터의 개수 및 유형이 달라지긴 해도, 대화창의 구조는 모두 비슷합니다. 대화창에 있는 파라미터는 다음 유형들 가운데 하나일 것입니다:
래스터 레이어: QGIS에서 (현재 열려 있는) 사용할 수 있는 모든 래스터 레이어의 목록 가운데 선택할 수 있습니다. 이 선택기의 오른쪽에 있는 |browseButton| 버튼을 누르면 현재 QGIS가 불러오지 않은 레이어를 나타내는 파일명을 선택할 수도 있습니다.
벡터 레이어: QGIS 사용할 수 있는 모든 벡터 레이어의 목록 가운데 선택할 수 있습니다. 래스터 레이어의 경우와 마찬가지로 QGIS가 불러오지 않은 레이어도 선택할 수 있는데, 알고리즘이 레이어의 속성 테이블에서 선택된 테이블 필드를 요구하지 않는 경우에만 선택할 수 있습니다. 알고리즘이 이런 필드를 요구하는 경우, 이미 열려 있는 레이어만 선택할 수 있습니다. 사용할 수 있는 필드명 목록을 가져오려면 먼저 레이어를 불러와야 하기 때문입니다.
각 벡터 레이어 선택기 옆에는 다음 그림에 있는 반복기(iterator) 버튼도 있습니다.
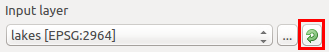
벡터 반복기 버튼
벡터 레이어를 여러 개 선택해야 하는 알고리즘의 경우, 반복기 버튼들 가운데 하나만 켜고 끌 수 있습니다. 입력 벡터 레이어에 대응하는 버튼을 켜면, 알고리즘을 해당 레이어 전체에 대해 한 번 실행하는 대신 레이어의 모든 객체에 대해 반복 실행해서 알고리즘 실행 횟수만큼 산출물을 생성합니다. 레이어에 있는 모든 피처를 개별적으로 처리해야 하는 경우 해당 프로세스를 이 버튼으로 자동화할 수 있습니다.
참고
By default, the parameters dialog will show a description of the CRS of each layer along with its name. If you do not want to see this additional information, you can disable this functionality in the Processing Settings dialog, unchecking the option.
테이블: QGIS에서 사용할 수 있는 모든 테이블의 목록 가운데 선택할 수 있습니다. QGIS는 비공간 테이블도 벡터 레이어처럼 불러오며, 사실 벡터 레이어처럼 취급합니다. 현재, 테이블이 필요한 알고리즘 실행 시 표시되는 사용할 수 있는 테이블의 목록은 dBase(
.dbf) 또는 쉼표 구분 값(.csv) 포맷의 파일에 있는 테이블로 제한되어 있습니다.옵션: 사용 가능한 옵션들의 목록 가운데 선택할 수 있습니다.
A numerical value, to be introduced in a spin box. In some contexts (when the parameter applies at the feature level and not at the layer’s), you will find a
 Data-defined override button by its side, allowing
you to open the expression builder and enter a
mathematical expression to generate variable values for the parameter. Some useful
variables related to data loaded into QGIS can be added to your expression, so
you can select a value derived from any of these variables, such as the cell size
of a layer or the northernmost coordinate of another one.
Data-defined override button by its side, allowing
you to open the expression builder and enter a
mathematical expression to generate variable values for the parameter. Some useful
variables related to data loaded into QGIS can be added to your expression, so
you can select a value derived from any of these variables, such as the cell size
of a layer or the northernmost coordinate of another one.
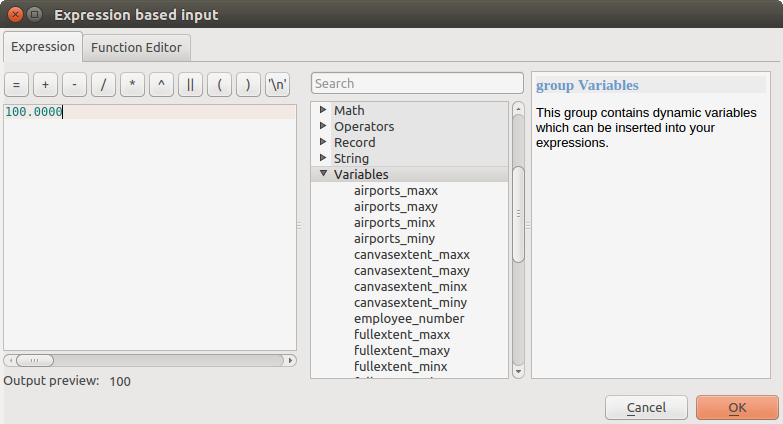
표현식 기반 입력
범위(range): 텍스트 란 2개를 통해 최소 및 최대 값을 설정할 수 있습니다.
텍스트 문자열: 텍스트 상자에 문자열을 입력할 수 있습니다.
필드: 벡터 레이어의 속성 테이블에서 또는 다른 파라미터를 통해 선택한 단일 테이블에서 필드를 선택할 수 있습니다.
A coordinate reference system. You can select it among the recently used ones from the drop-down list or from the CRS selection dialog that appears when you click on the button on the right-hand side.
An extent, to be entered by four numbers representing its
xmin,xmax,ymin,ymaxlimits. Clicking on the button on the right-hand side of the value selector, a pop-up menu will appear, giving you options:to select the value from a layer or the current canvas extent;
or to define it by dragging directly onto the map canvas.
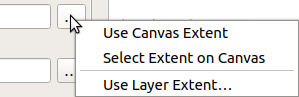
범위 선택기
첫 번째 옵션을 선택하면, 다음 그림과 같은 창이 열립니다.
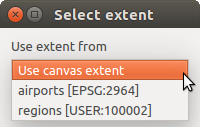
범위 목록
두 번째 옵션을 선택하면, 파라미터 대화창이 사라져서 캔버스 상에서 직사각형을 클릭&드래그할 수 있게 됩니다. 직사각형을 정의하고 나면, 대화창이 범위 텍스트 란에 값을 담은 채 다시 나타납니다.
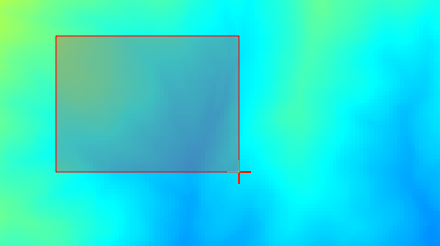
범위 클릭&드래그
A list of elements (whether raster or vector layers, tables, fields) to select from. Click on the … button at the left of the option to see a dialog like the following one. Multiple selection is allowed and when the dialog is closed, number of selected items is displayed in the parameter text box widget.
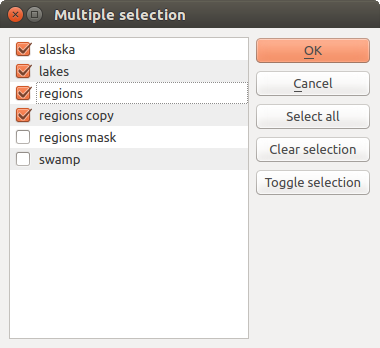
다중 선택
간소 테이블: 사용자가 테이블을 편집할 수 있습니다. 다른 목적도 있지만, 주로 색인(lookup) 테이블 또는 합성곱 커널(convolution kernel) 같은 파라미터를 정의하는 데 사용됩니다.
테이블을 살펴보고 우측에 있는 버튼을 클릭해서 그 값을 편집하십시오.
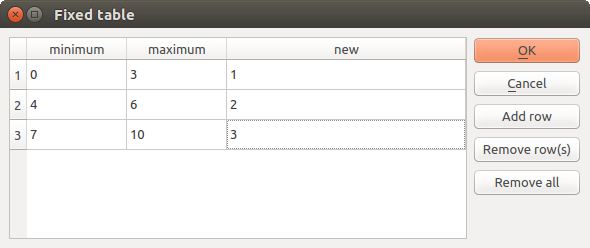
고정 테이블
알고리즘에 따라, 대화창 우측에 있는 버튼들을 사용해서 여러 행들을 수정할 수도 있고 못 할 수도 있습니다.
참고
Some algorithms require many parameter to run, e.g. in the
Raster calculator you have to specify manually the cell size, the
extent and the CRS. You can avoid to choose all the parameters manually when
the algorithm has the Reference layers parameter. With this parameter you
can choose the reference layer and all its properties (cell size, extent, CRS)
will be used.
Along with the Parameters tab, there is another tab named Log (see figure below). Information provided by the algorithm during its execution is written in this tab, and allow you to track the execution and be aware and have more details about the algorithm as it runs. Notice that not all algorithms write information to this tab, and many of them might run silently without producing any output other than the final files.
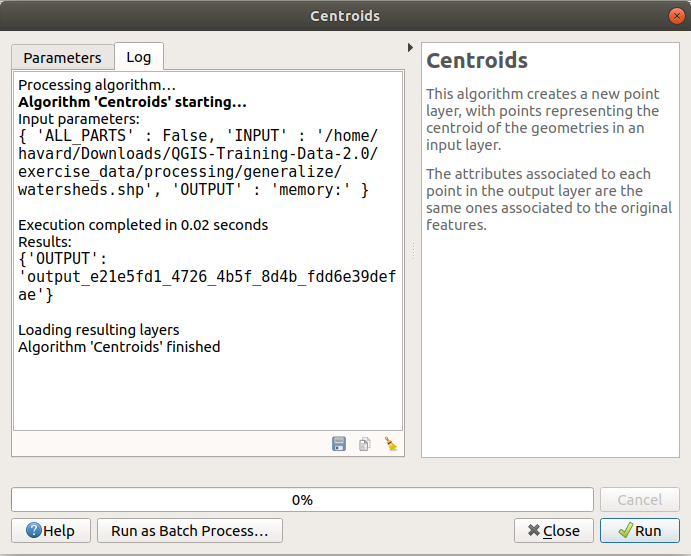
Algorithm Dialog - Log
At the bottom of the Log tab you will find buttons to
Save Log to File, Copy Log to Clipboard and Clear Log.
These are particularly handy when you have checked the
Keep dialog open after running algorithm in the General part
of the Processing options.
On the right hand side of the dialog you will find a short description of the algorithm, which will help you understand its purpose and its basic ideas. If such a description is not available, the description panel will not be shown.
For a more detailed help file, which might include description of every parameter it uses, or examples, you will find a Help button at the bottom of the dialog bringing you to the Processing algorithms documentation or to the provider documentation (for some third-party providers).
투영체에 대한 소고(小考)
Processing algorithm execution are always performed in the input layer coordinate reference system (CRS). Due to QGIS’s on-the-fly reprojecting capabilities, although two layers might seem to overlap and match, that might not be true if their original coordinates are used without reprojecting them onto a common coordinate system. Whenever you use more than one layer as input to a QGIS native algorithm, whether vector or raster, the layers will all be reprojected to match the coordinate reference system of the first input layer.
This is however less true for most of the external applications whose algorithms are exposed through the processing framework as they assume that all of the layers are already in a common coordinate system and ready to be analyzed.
By default, the parameters dialog will show a description of the CRS of each layer along with its name, making it easy to select layers that share the same CRS to be used as input layers. If you do not want to see this additional information, you can disable this functionality in the Processing settings dialog, unchecking the Show layer CRS definition in selection boxes option.
If you try to execute an algorithm using as input two or more layers with unmatching CRSs, a warning dialog will be shown. This occurs thanks to the Warn before executing if layer CRS’s do not match option.
그래도 알고리즘을 실행시킬 수는 있지만, 대부분의 경우 입력 레이어들이 서로 중첩하지 않기 때문에 텅 빈 레이어 같은 잘못된 산출물을 생성할 것이라는 점을 유념하십시오.
팁
Use Processing algorithms to do intermediate reprojection
When an algorithm can not successfully perform on multiple input layers due to unmatching CRSs, use QGIS internal algorithm such as Reproject layer to perform layers〉 reprojection to the same CRS before executing the algorithm using these outputs.
알고리즘이 생성한 데이터 객체
알고리즘이 생성한 데이터 객체는 다음 유형들 가운데 하나가 될 것입니다:
래스터 레이어
벡터 레이어
테이블
HTML 파일 (텍스트 및 그래픽 산출물 용)
These are all saved to disk, and the parameters table will contain a text box corresponding to each one of these outputs, where you can type the output channel to use for saving it. An output channel contains the information needed to save the resulting object somewhere. In the most usual case, you will save it to a file, but in the case of vector layers, and when they are generated by native algorithms (algorithms not using external applications) you can also save to a PostGIS, GeoPackage or SpatiaLite database, or a memory layer.
산출물 채널을 선택하려면, 텍스트 란 오른쪽에 있는 |browseButton| 버튼을 누르기만 하면 됩니다. 사용 가능한 옵션을 표시한 작은 컨텍스트 메뉴가 나타날 것입니다.
거의 대부분의 경우, 〈파일로 저장하기’를 선택하게 됩니다. 해당 옵션을 선택했다면, 원하는 파일 경로를 선택할 수 있는 파일 저장 대화창이 열릴 것입니다. 대화창의 파일 포맷 선택기에 산출물 유형 및 실행 알고리즘에 따라 지원되는 파일 확장자가 표시됩니다.
The format of the output is defined by the filename extension. The supported
formats depend on what is supported by the algorithm itself. To select a format,
just select the corresponding file extension (or add it, if you are directly typing
the file path instead). If the extension of the file path you entered does not
match any of the supported formats, a default extension will be
appended to the file path, and the file format corresponding to that extension will
be used to save the layer or table. Default extensions are .dbf for
tables, .tif for raster layers and .gpkg for vector layers. These
can be modified in the setting dialog, selecting any other of the formats supported
by QGIS.
If you do not enter any filename in the output text box (or select the corresponding option in the context menu), the result will be saved as a temporary file in the corresponding default file format, and it will be deleted once you exit QGIS (take care with that, in case you save your project and it contains temporary layers).
You can set a default folder for output data objects. Go to the settings
dialog (you can open it from the
menu), and in the
General group, you will find a parameter named Output folder.
This output folder is used as the default path in case you type just a filename
with no path (i.e., myfile.shp) when executing an algorithm.
벡터 레이어를 반복 모드로 사용하는 알고리즘 실행 시, 입력한 파일 경로를 모든 생성 파일을 저장하는 기본 경로로 사용합니다. 즉 파일 경로의 파일명을 기본 명칭으로 삼아 반복 작업 차례대로 번호를 붙일 것이라는 뜻입니다. 이런 모든 생성 파일의 포맷도 파일 경로의 파일 확장자(포맷)를 따릅니다.
Apart from raster layers and tables, algorithms also generate graphics and text as HTML files. These results are shown at the end of the algorithm execution in a new dialog. This dialog will keep the results produced by any algorithm during the current session, and can be shown at any time by selecting from the QGIS main menu.
일부 외부 응용 프로그램이 (특정 확장자 제약 없이) 파일을 산출할 수도 있지만, 이런 파일들은 앞에서 설명한 어느 범주에도 속하지 않습니다. QGIS는 이런 산출물 파일을 처리하지 않는데 (현재 QGIS 프로젝트에 불러오거나 포함시키지 않는데) 왜냐하면 대부분의 경우 이런 산출물 파일의 포맷이 QGIS가 지원하는 포맷 또는 항목이 아니기 때문입니다. 예를 들면, LiDAR 데이터 용 LAS 파일이 그렇습니다. 해당 파일을 생성할 수는 있어도, 현재 실행 중인 QGIS 세션에 아무것도 새로 추가되지 않습니다.
다른 모든 산출물 유형의 경우, 알고리즘에게 파일을 생성한 다음 해당 산출물을 불러올지 여부를 알려줄 수 있는 체크박스가 존재합니다. 기본적으로, 모든 파일을 불러오도록 설정돼 있습니다.
산출물 선택은 지원하지 않습니다. 즉 모든 산출물을 생성한다는 뜻입니다. 하지만, 어떤 산출물을 저장하는 데 관심이 없을 경우 해당하는 체크박스를 체크 해제할 수 있는데, 본질적으로 산출물을 선택한 것처럼 작동합니다. (즉, 어쨌든 레이어를 생성하긴 하지만 텍스트 란을 비워놓을 경우 임시 파일로 저장해서 QGIS 종료 시 삭제할 것이라는 뜻입니다.)