IGU QGIS
When QGIS starts, you are presented with the GUI as shown in the figure (the numbers 1 through 5 in yellow circles are discussed below).
Figure QGIS GUI 1:
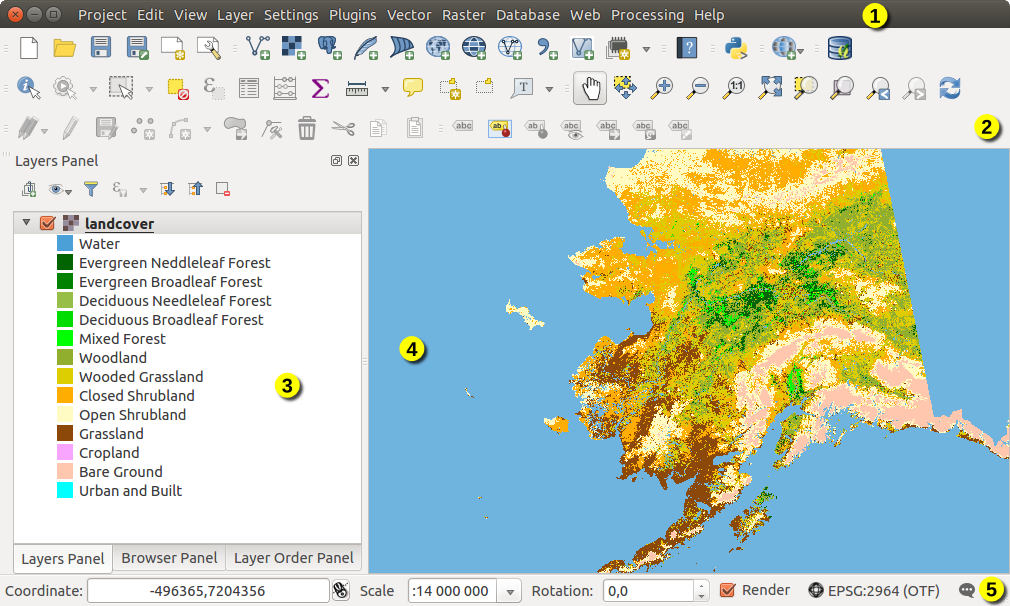
QGIS GUI with Alaska sample data
Nota
Las decoraciones de las ventanas (barra de título, etc.) pueden ser distintas dependiendo de su sistema operativo y su gestor de ventanas.
The QGIS GUI is divided into five areas:
Barra de Menú
Barras de herramientas
Paneles
Vista del mapa
Barra de Estado
These five components of the QGIS interface are described in more detail in the following sections. Two more sections present keyboard shortcuts and context help.
Barra de Menú
La barra de menú permite el acceso a varias características de QGIS mediante un menú jerárquico estándar. Los menús de nivel superior y un resumen de algunas opciones de menú se enumeran a continuación, junto con los iconos asociados a medida que aparecen en la barra de herramientas, y los atajos de teclado. Los atajos de teclado presentados en esta sección son los predeterminados; sin embargo, los atajos de teclado también se pueden configurar manualmente utilizando el diálogo Configurar atajos del teclado, abrir desde Configuración ‣ Configurar atajos de teclado....
Aunque la mayoría de las opciones tiene una herramienta correspondiente y viceversa, los menús no están organizados exactamente como las barras de herramientas. La barra de herramientas que contiene la herramienta esta listada después de cada opción de menú como una entrada de casilla de verificación. Algunas opciones de menú sólo aparecen si se carga el complemento correspondiente. Para obtener más información acerca de herramientas y barra de herramientas, ver la sección Barras de herramientas.
Nota
QGIS is a cross-platform application meaning that though it provides you with the same tools, they may be placed in different menus according to the operating system specification. The lists below show the most common location and precise when there is a variation.
Proyecto
Menú Opción |
Atajos |
Referencia |
Barra de herramietas |
|---|---|---|---|
 New New |
Ctrl+N |
ver Proyectos |
Proyecto |
 Open Open |
Ctrl+O |
ver Proyectos |
Proyecto |
Nuevo a partir de plantilla ‣ |
ver Proyectos |
||
Abrir recientes ‣ |
ver Proyectos |
||
 Save Save |
Ctrl+S |
ver Proyectos |
Proyecto |
 Save As... Save As... |
Ctrl+Shift+S |
ver Proyectos |
Proyecto |
 Save as Image... Save as Image... |
ver Salida |
||
| DXF Export... | ver Salida |
||
 Project Properties... Project Properties... |
Ctrl+Shift+P |
ver Proyectos |
|
 New Print Composer New Print Composer |
Ctrl+P |
Proyecto |
|
 Composer manager... Composer manager... |
Proyecto |
||
Diseñadores de impresión ‣ |
|||
 Exit QGIS Exit QGIS |
Ctrl+Q |
Under  Mac OSX, the Exit QGIS command corresponds to
QGIS ‣ Quit QGIS (
Mac OSX, the Exit QGIS command corresponds to
QGIS ‣ Quit QGIS (Cmd+Q).
Editar
Menú Opción |
Atajos |
Referencia |
Barra de herramietas |
|---|---|---|---|
 Undo Undo |
Ctrl+Z |
Digitalización Avanzada |
|
 Redo Redo |
Ctrl+Shift+Z |
Digitalización Avanzada |
|
 Cut Features Cut Features |
Ctrl+X |
Digitalización |
|
 Copy Features Copy Features |
Ctrl+C |
Digitalización |
|
|
Ctrl+V |
Digitalización |
|
Pegar objetos espaciales como ‣ |
|||
 Add Feature Add Feature |
Ctrl+. |
Digitalización |
|
 Move Feature(s) Move Feature(s) |
Digitalización |
||
 Delete Selected Delete Selected |
Digitalización |
||
 Rotate Feature(s) Rotate Feature(s) |
Digitalización Avanzada |
||
 Simplify Feature Simplify Feature |
Digitalización Avanzada |
||
 Add Ring Add Ring |
Digitalización Avanzada |
||
 Add Part Add Part |
Digitalización Avanzada |
||
 Fill Ring Fill Ring |
Digitalización Avanzada |
||
 Delete Ring Delete Ring |
Digitalización Avanzada |
||
 Delete Part Delete Part |
Digitalización Avanzada |
||
 Reshape Features Reshape Features |
Digitalización Avanzada |
||
 Offset Curve Offset Curve |
Digitalización Avanzada |
||
 Split Features Split Features |
Digitalización Avanzada |
||
 Split Parts Split Parts |
Digitalización Avanzada |
||
 Merge Selected Features Merge Selected Features |
Digitalización Avanzada |
||
 Merge Attr. of Selected Features Merge Attr. of Selected Features |
Digitalización Avanzada |
||
 Node Tool Node Tool |
Digitalización |
||
 Rotate Point Symbols Rotate Point Symbols |
Digitalización Avanzada |
After activating  Toggle editing mode for a layer,
you will enable the
Toggle editing mode for a layer,
you will enable the Add Feature icon in the Edit menu
depending on the layer type (point, line or polygon).
Edición (extra)
Menú Opción |
Atajos |
Referencia |
Barra de herramietas |
|---|---|---|---|
| Add Feature |
Digitalización |
||
 Add Feature Add Feature |
Digitalización |
||
|
Digitalización |

Ver
Menú Opción |
Atajos |
Referencia |
Barra de herramietas |
|---|---|---|---|
 Pan Map Pan Map |
see Zooming and Panning | Navegación de mapas |
|
 Pan Map to Selection Pan Map to Selection |
Navegación de mapas |
||
|
Ctrl++ |
see Zooming and Panning | Navegación de mapas |
 Zoom Out Zoom Out |
Ctrl+- |
see Zooming and Panning | Navegación de mapas |
Seleccionar ‣ |
Atributos |
||
 Identify Features Identify Features |
Ctrl+Shift+I |
see Identificar objetos espaciales | Atributos |
Medir ‣ |
ver Mediciones |
Atributos |
|
 Statistical Summary Statistical Summary |
see Panel resumen estadístico | Atributos |
|
|
Ctrl+Shift+F |
Navegación de mapas |
|
 Zoom To Layer Zoom To Layer |
Navegación de mapas |
||
|
Ctrl+J |
Navegación de mapas |
|
 Zoom Last Zoom Last |
Navegación de mapas |
||
|
Navegación de mapas |
||
 Zoom To Native Resolution Zoom To Native Resolution |
Navegación de mapas |
||
Ilustraciones ‣ |
|||
Modo Vista previa ‣ |
|||
 Map Tips Map Tips |
see Menú de Despliegue | Atributos |
|
 New Bookmark... New Bookmark... |
Ctrl+B |
Atributos |
|
 Show Bookmarks Show Bookmarks |
Ctrl+Shift+B |
Atributos |
|
 Refresh Refresh |
F5 |
Navegación de mapas |
|
Paneles ‣ |
|||
Barras de herramientas‣ |
|||
| Toggle Full Screen Mode | F11 |


Under  Linux KDE, Panels ‣, Toolbars ‣
and Toggle Full Screen Mode are rather placed in Settings
menu.
Preview mode ‣ is not available under Mac OS X.
Linux KDE, Panels ‣, Toolbars ‣
and Toggle Full Screen Mode are rather placed in Settings
menu.
Preview mode ‣ is not available under Mac OS X.
Capa
Menú Opción |
Atajos |
Referencia |
Barra de herramietas |
|---|---|---|---|
Crear capa ‣ |
Administrar Capas |
||
Añadir capa ‣ |
see Formatos de datos compatibles | Administrar Capas |
|
| Embed Layers and Groups... | ver Anidar proyectos |
||
| Add from Layer Definition File... | |||
| Copy style |
see Save and Share Layer Properties | ||
 Paste style Paste style |
see Save and Share Layer Properties | ||
 Open Attribute Table Open Attribute Table |
Atributos |
||
| Toggle Editing |
Digitalización |
||
| Save Layer Edits |
Digitalización |
||
 Current Edits ‣ Current Edits ‣ |
Digitalización |
||
| Save As... | see Guardar capa en archivo | ||
| Save As Layer Definition File... | |||
 Remove Layer/Group Remove Layer/Group |
Ctrl+D |
||
 Duplicate Layers (s) Duplicate Layers (s) |
|||
Establecer escala de visibilidad de las capas |
|||
| Set CRS of Layer(s) | Ctrl+Shift+C |
||
Establecer SRC del proyecto a partir de capa |
|||
| Properties... | see El Dialogo de las Propiedades del Vector | ||
| Filter... | |||
|
ver Labels Menu |
||
 Add to Overview Add to Overview |
Ctrl+Shift+O |
Administrar Capas |
|
|
|||
 Remove All From Overview Remove All From Overview |
|||
|
Ctrl+Shift+U |
Administrar Capas |
|
|
Ctrl+Shift+H |
Administrar Capas |
|
 Show selected Layers Show selected Layers |
|||
 Hide selected Layers Hide selected Layers |


Configuración
Menú Opción |
Atajos |
Referencia |
Barra de herramietas |
|---|---|---|---|
|
|||
Administrador de estilos... |
|||
|
|||
 Customization... Customization... |
ver Personalización |
||
| Options... |
ver Opciones |
||
| Snapping Options... | ver Configurar la tolerancia del autoensamblado y radio de búsqueda |

Under Linux KDE, you’ll find more tools in Settings
menu such as Project Properties, Panels ‣,
Toolbars ‣ and Toggle Full Screen Mode.
Complementos
Menú Opción |
Atajos |
Referencia |
Barra de herramietas |
|---|---|---|---|
|
|||
| Python Console | Ctrl+Alt+P |

When starting QGIS for the first time not all core plugins are loaded.
Vectorial
Menú Opción |
Atajos |
Referencia |
Barra de herramietas |
|---|---|---|---|
menuselection:Open Street Map –> |
|||
|
|||
|
|||
|
|||
|
|||
|


When starting QGIS for the first time not all core plugins are loaded.
Ráster
Menú Opción |
Atajos |
Referencia |
Barra de herramietas |
|---|---|---|---|
Calculadora ráster... |
see Calculadora Ráster | ||
| Align Raster... | ver Raster Alignment |
When starting QGIS for the first time not all core plugins are loaded.
Base de datos
Menú Opción |
Atajos |
Referencia |
Barra de herramietas |
|---|---|---|---|
Base de datos‣ |
Base de datos |
When starting QGIS for the first time not all core plugins are loaded.
Web
Menú Opción |
Atajos |
Referencia |
Barra de herramietas |
|---|---|---|---|
| Metasearch | ver metabuscador |
Web |
When starting QGIS for the first time not all core plugins are loaded.
Procesado
Menú Opción |
Atajos |
Referencia |
Barra de herramietas |
|---|---|---|---|
|
|||
 Graphical Modeler... Graphical Modeler... |
|||
 History and log... History and log... |
|||
 Options... Options... |
|||
 Results viewer... Results viewer... |
|||
|
Ctrl+Alt+M |


When starting QGIS for the first time not all core plugins are loaded.
Ayuda
Menú Opción |
Atajos |
Referencia |
Barra de herramietas |
|---|---|---|---|
 Help Contents Help Contents |
F1 |
Ayuda |
|
|
Shift+F1 |
Ayuda |
|
| API Documentation | |||
Reportar un problema |
|||
| Need commercial support? | |||
 QGIS Home Page QGIS Home Page |
Ctrl+H |
||
 Check QGIS Version Check QGIS Version |
|||
|
|||
|


QGIS
This menu is only available under Mac OS X and contains some OS related
commands.
Menú Opción |
Atajos |
Referencia |
|---|---|---|
Preferencias |
||
Acerca de QGIS |
||
| Hide QGIS | ||
| Show All | ||
| Hide Others | ||
| Quit QGIS | Cmd+Q |
Preferences and About QGIS are the same commands as Settings ‣ Options and Help ‣ About. Quit QGIS corresponds to Project ‣ Exit QGIS under the other platforms.
Paneles y Barras de Herramientas
From the View menu (Settings under KDE), you can switch on and off QGIS widgets (Panels ‣) or toolbars (Toolbars ‣). You can (de)activate any of them by right-clicking the menu bar or a toolbar and choose the item you want. Each panel or toolbar can be moved and placed wherever you feel comfortable with in QGIS interface. The list can also be extended with the activation of Core or external plugins.
Barras de herramientas
La barra de herramientas proporciona acceso a la mayoría de las mismas funciones como las de los menús, y herramientas adicionales para interactuar con el mapa. Cada elemento de la barra de herramientas tiene ayuda emergente disponible. Mantenga el puntero del ratón sobre el elemento y una breve descripción del propósito de la herramienta se mostrará.
Every toolbar can be moved around according to your needs. Additionally, they can be switched off using the right mouse button context menu, or by holding the mouse over the toolbars.
Figure Toolbars:
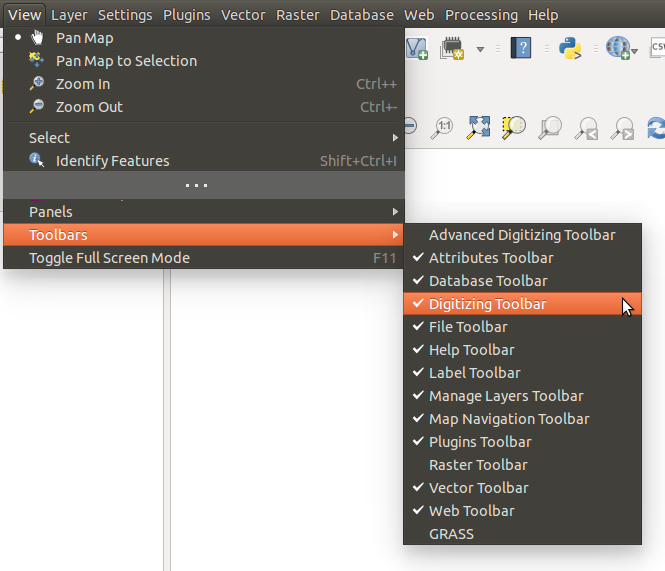
The Toolbars menu
Truco
Restauración de barras de herramientas
If you have accidentally hidden a toolbar, you can get it back by choosing menu option View ‣ Toolbars ‣ (or Settings ‣ Toolbars ‣ under Linux KDE). If for some reason a toolbar (or any other widget) totally disappears from the interface, you’ll find tips to get it back at restoring initial GUI.
Paneles
QGIS provides by default many panels to work with.
Figure Panels:
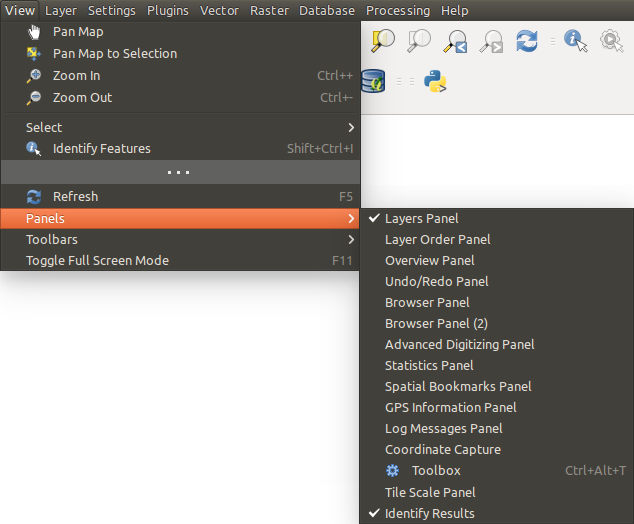
El menú de paneles
Some of these panels are described below while others may be found in different parts of the document, namely:
- the Browser Panel
- the Advanced Digitizing Panel
- the Spatial Bookmarks Panel
- the GPS Information Panel
- the Tile Scale Panel
- the Identify Panel
- the User Input Panel
Panel de Capas
The layers panel lists all the layers in the project. The checkbox in each legend entry can be used to show or hide the layer. The toolbar in the layers panel allows you to:
 Add new group
 Manage Visibility: control visibility of layers and
preset layers combination
Manage Visibility: control visibility of layers and
preset layers combination Filter Legend by Map Content: only the layers that are set
visible and whose features intersect the current map canvas have their style
rendered in the layers panel. Otherwise, a generic NULL symbol is applied to the
layer. Based on the layer symbology, this is a convenient way to identify which
kind of features from which layers cover your area of interest.
Filter Legend by Map Content: only the layers that are set
visible and whose features intersect the current map canvas have their style
rendered in the layers panel. Otherwise, a generic NULL symbol is applied to the
layer. Based on the layer symbology, this is a convenient way to identify which
kind of features from which layers cover your area of interest. Filter Legend by Expression: helps you apply an
expression to remove from the selected layer tree styles that have no feature
satisfying the condition. This can be used for example to highlight features that are
within a given area/feature of another layer.
From the drop-down list, you can edit and clear the expression set.
Filter Legend by Expression: helps you apply an
expression to remove from the selected layer tree styles that have no feature
satisfying the condition. This can be used for example to highlight features that are
within a given area/feature of another layer.
From the drop-down list, you can edit and clear the expression set. Expand All or
  Collapse All
layers and groups in the layers panel.
Collapse All
layers and groups in the layers panel.- and Remove Layer/Group currently selected.
Figure Layer tools Bar:
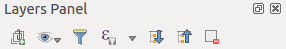
Layer Toolbar in Layers Panel
The button allows you to add Presets views in the legend.
Presets are a way to save and easily restore a combination of layers with their
current style. To add a preset view, just set visible the layers you want, with
their desired symbology, and click on button.
Choose Add Preset... from the drop-down menu and give a name to the preset.
The added preset is listed at the bottom of the drop-down menu and is recalled by
clicking on it.
The Replace Preset ‣ option helps you overwrite a preset content with the current map view while the Remove Current Preset button deletes the active preset.
Todos los preestablecidos añadidos están presentes en el diseño de impresión con el fin de permitirle crear un diseño de mapa en base a sus puntos de vista específicos (ver Main properties).
Nota
Tools to manage the layers panel are also available to layout the map and legend items of the print composer
Una capa se puede seleccionar y arrastrar hacia arriba o hacia abajo en la leyenda para cambiar el orden. El orden-z significa que las capas enlistadas más cerca de la parte superior de la leyenda son dibujadas sobre las capas que figuran más abajo en la leyenda.
Nota
This behavior can be overridden by the Layer Order panel.
Layers in the legend window can be organized into groups. There are two ways to do this:
- Press the
 icon to add a new group. Type in a name for
the group and press
icon to add a new group. Type in a name for
the group and press Enter. Now click on an existing layer and drag it onto the group. Seleccionar algunas capas, al hacer clic derecho en la ventana de la leyenda y elegir Grupo Seleccionado. Las capas seleccionadas serán colocadas automáticamente en un nuevo grupo.
Para llevar una capa fuera de un grupo, puede arrastrar hacia afuera , o haga clic derecho sobre él y elija Subir elemento al nivel superior.
La casilla de verificación para un grupo mostrará u ocultará todas las capas en el grupo al hacer clic.
El contenido del menú contextual del botón derecho depende si el elemento de leyenda seleccionada es un ráster o una capa vectorial. Para las capas vectoriales de GRASS , Botón de edición no está disponible. Vea la sección Digitalizar y editar una capa vectorial GRASS para obtener información sobre la edición de capas vectoriales de GRASS.
Below are listed available options in context menu depending on the selected item.
Opción |
Capa Vectorial |
Capa Ráster |
Grupo |
|---|---|---|---|
| Zoom to Layer/Group |
 |
|
|
|
|
|
|
| Zoom to Native Resolution (100%) |
|
||
| Stretch Using Current Extent | |
||
|
|
|
|
| Duplicate |
|
|
|
Establecer escala de visibilidad de la capa |
|
|
|
Establecer SRC de la capa/grupo |
|
|
|
Establecer SRC del proyecto a partir de capa |
|
|
|
Estilos‣ |
|
|
|
Copiar estilo |
|
|
|
Pegar estilo |
|
|
|
| Open Attribute Table |
|
||
| Toggle Editing |
|
||
| Current Edits ‣ |
(in Edit mode) |
||
| Save As... | |
|
|
| Save As Layer Definition File... | |
|
|
Filtrar |
|
||
 Show Feature Count Show Feature Count |
|
||
Propiedades |
|
|
|
Mover al nivel superior |
|
|
|
Cambiar nombre |
|
|
|
Grupo seleccionado |
|
|
|
Propiedades |
|
|
|
| Set Group WMS Data | |
||
| Mutually Exclusive Group |
|
||
| Add Group |
|
Enabling the Mutually Exclusive Group option you can make a group have only one layer visible at the same time. Whenever a layer within the group is set visible the others will be toggled not visible.
Es posible seleccionar mas de una capa o grupo al mismo tiempo manteniendo presionada la tecla Ctrl mientras selecciona las capas con el botón izquierdo del ratón. Después puede mover todas las capas a un nuevo grupo al mismo tiempo.
You may also delete more than one layer or group at once by selecting
several items with the Ctrl key and pressing Ctrl+D afterwards.
This way, all selected layers or groups will be removed from the layers list.
Editing vector layer style
From the Layers panel, you have shortcuts to easily and quickly edit the layer rendering. Right-click on a vector layer and select Styles –> in the list in order to:
- see the currently applied styles to the layer. In case you defined many styles for the layer, you can switch from one to another and have your layer rendering automatically updated in the map canvas.
- copy the current style, and when applicable, paste a copied style from another layer
- rename the current style, add a new one (which is actually a copy of the current one) or delete the current style (when multiple styles available).
Nota
The previous options are also available for raster layer.
Whether the features in the vector layer have all the same unique symbol or they are classified (in that case, the layer is displayed in a tree structure with each class as sub-item), the following options are available at layer level or class level:
- a Edit Symbol... button to open the El Selector de Símbolo dialog and update any property (symbol, size, color...) of the layer or feature symbol. Double-clicking on a feature does also open the Symbol Selector dialog.
- a Selector de color widget with a Color Wheel from which you can click a color and have it automatically update the symbol fill color. For convenience, Recent colors are available at the bottom of the color wheel.
- a Show All Items and Hide All
Items to toggle on or off the visibility of all the classes of features. This avoids
(un)checking items one by one.
Truco
Quickly share a layer style
From the context menu, copy the style of a layer and paste it to a group or a selection of layers: the style is applied to all the layers that are of the same type (vector vs raster) as the original layer and, in case of vector, have the same geometry type (point, line or polygon).
Trabajar con el orden de la leyenda de la capa independiente
There is a panel that allows you to define an independent drawing order for
the layers panel. You can activate it in the menu
Settings ‣ Panels ‣ Layer Order Panel. This feature allows you
to, for instance, order your layers in order of importance, but still display
them in the correct order (see figure_layer_order). Checking the
Control rendering order box underneath the list of layers will
cause a revert to default behavior.
Figure Layer Order:
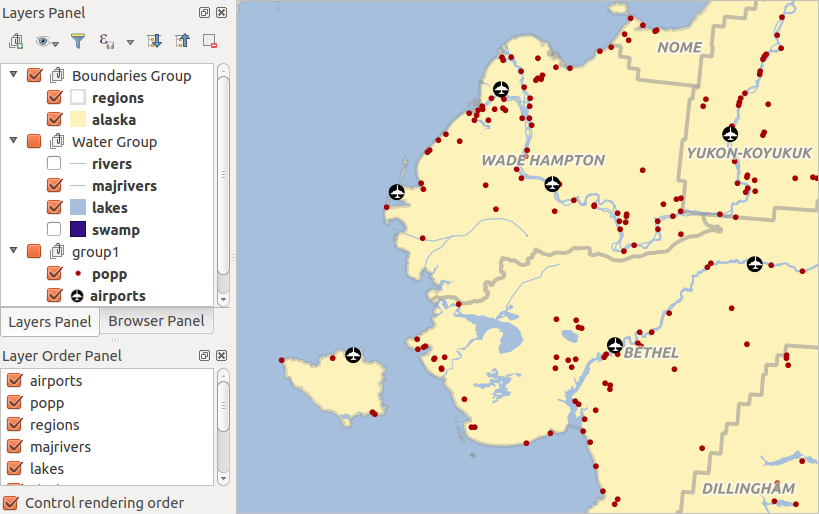
Definir el orden de la leyenda de una capa independiente
Panel resumen estadístico
This panel can show some statistics on a specific vector layers. The panel allows users to choose:
- the vector layer;
- the column or the expression;
- filter statistics to selected features;
Actualizar las informaciones;
- the statistics information to display with the bottom right button;
Panel de vista general de QGIS
In QGIS, you can use an overview panel that provides a full extent view of layers added to it. Within the view is a rectangle showing the current map extent. This allows you to quickly determine which area of the map you are currently viewing. Note that labels are not rendered to the map overview even if the layers in the map overview have been set up for labelling. If you click and drag the red rectangle in the overview that shows your current extent, the main map view will update accordingly.
Panel de mensajes del registro
When loading or processing some operations, you can track and follow messages
that appear in different tabs using the  Log Messages Panel.
It can be activated using the most right icon in the bottom status bar.
Log Messages Panel.
It can be activated using the most right icon in the bottom status bar.
Panel deshacer/rehacer
For each layer being edited, this panel shows the list of actions done, allowing to quickly undo a set of actions by simply selecting the action listed above.
Vista del mapa
También llamado Vista del mapa,este es el “final del negocio” de QGIS — ¡los mapas son desplegados en esta zona! El mapa que se muestra en esta ventana dependerá de las capas vectoriales y ráster que ha elegido cargar (ver secciones siguientes para obtener más información sobre cómo cargar capas). La vista del mapa se puede desplazar, cambiar el enfoque de la pantalla del mapa a otra región, y que se puede hacer zum dentro y fuera. Varias otras operaciones se pueden realizar en el mapa como esta descrito en la descripción de la barra de herramientas anteriormente. La vista del mapa y la leyenda están estrechamente vinculados entre sí — los mapas en vista reflejan los cambios que realice en el área de leyenda .
Truco
Zum al mapa con la rueda del ratón
Puede utilizar la rueda del ratón para acercar y alejar zum en el mapa. Coloque el cursor del ratón dentro del mapa y gire la rueda hacia adelante (hacia la derecha) para acercar y hacia atrás (hacia usted) para alejarlo. El zum se centra en la posición del cursor del ratón. Puede personalizar el comportamiento del zum de la rueda del ratón usando la pestaña Herramientas del mapa bajo el menú Configuración‣ Opciones
Truco
Desplazar el mapa con las teclas de dirección y barra de espaciadora
Puede utilizar las teclas de flechas para desplazar el mapa. Coloque el cursor dentro del mapa y haga clic en la tecla de flecha a la derecha para desplazarse al este, tecla de flecha izquierda para el oeste, flecha arriba para el norte y flecha abajo al sur. Puede también desplazar el mapa utilizando la barra espaciadora o al hacer clic en la rueda del ratón: basta con mover el ratón mientras mantiene pulsada la barra espaciadora o haga clic en la rueda del ratón.
Barra de Estado
The status bar provides you with general information about the map view, and actions processed or available and offers you tools to manage the map view.
On the left side of the status bar, you can get a summary of actions you’ve done (such as selecting features in a layer, removing layer) or a long description of the tool you are hovering over (not available for all tools). On startup, the bar status also informs you about availability of new or upgradeable plugins (if checked in Plugin Manager settings).
In case of lengthy operations, such as gathering of statistics in raster layers or rendering several layers in map view, a progress bar is displayed in the status bar to show the current progress of the action.
The ![]() Coordinate option shows the current position of the mouse,
following it while moving across the map view. You can set the unit (and precision)
to use in the project properties, General tab.
Click on the small button at the left of the textbox to toggle between
the Coordinate option and the
Coordinate option shows the current position of the mouse,
following it while moving across the map view. You can set the unit (and precision)
to use in the project properties, General tab.
Click on the small button at the left of the textbox to toggle between
the Coordinate option and the  Extents option that displays
in map units, the coordinates of the current lower leftmost and upper rightmost
points of the map view, as you pan and zoom in and out.
Extents option that displays
in map units, the coordinates of the current lower leftmost and upper rightmost
points of the map view, as you pan and zoom in and out.
Next to the coordinate display you will find the Scale display. It shows the scale of the map view. If you zoom in or out, QGIS shows you the current scale. There is a scale selector, which allows you to choose among predefined and custom scales to assign to the map view.
A la derecha de la escala desplegada se puede definir una rotación horaria actual de su vista de mapa en grados.
On the right side of the status bar, there is a small checkbox which can be used to temporarily prevent layers being rendered to the map view (see section Renderizado).
To the right of the render functions, you find the  Current CRS: icon with the EPSG code of the current
project CRS. Clicking on this lets you Enable ‘on the fly’ CRS
transformation properties for the current project and apply another CRS to the
map view.
Current CRS: icon with the EPSG code of the current
project CRS. Clicking on this lets you Enable ‘on the fly’ CRS
transformation properties for the current project and apply another CRS to the
map view.
Finally, the Messages button opens the Log
Messages Panel which informs you on underlying process (QGIS startup, plugins
loading, processing tools...)
Truco
Calcular la escala correcta de su lienzo de mapa
When you start QGIS, the default CRS is WGS 84 (epsg 4326) and
units are degrees. This means that QGIS will interpret any
coordinate in your layer as specified in degrees. To get correct scale values,
you can either manually change this setting, e.g. to meters, in the General
tab under Project ‣ Project Properties, or you can use
the Current CRS: icon seen above. In the latter case,
the units are set to what the project projection specifies (e.g., +units=us-ft).
Note that CRS choice on startup can be set in Settings ‣ Options ‣ CRS.