.
Strumenti
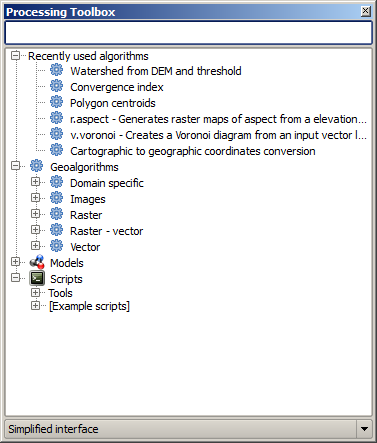
La finestra Strumenti è l’elemento principale della interfaccia grafica di Processing, ed è l’elemento che probabilmente userai quotidianamente. La finestra ti mostra l’elenco degli algoritmi disponibili raggruppati in differenti sezioni ed è il punto di partenza per lanciare gli algoritmi sia come singoli processi che come processi in serie, ovvero processi che implicano l’esecuzione dello stesso algoritmo su diversi insiemi di dati.
Figure Processing 5:
The toolbox contains all the available algorithms, divided into predefined groups. All these groups are found under a single tree entry named Geoalgorithms.
Additionally, two more entries are found, namely Models and Scripts. These include user-created algorithms, and they allow you to define your own workflows and processing tasks. We will devote a full section to them a bit later.
Nella parte superiore degli Strumenti, potrai trovare spazio in cui inserire del testo. Per facilitare la ricerca di un algoritmo, puoi inserire qui una parola o una frase specifica: vedrai subito che il numero degli algoritmi si ridurrà al numero di quelli che contengono il testo che hai inserito.
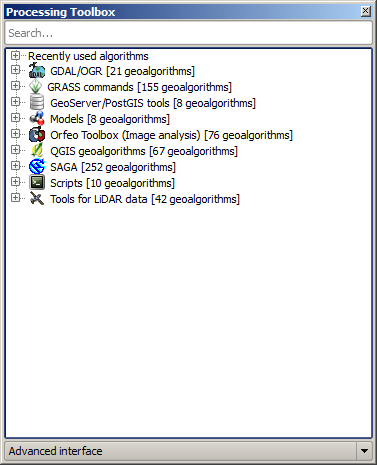
In the lower part, you will find a box that allows you to switch between the simplified algorithm list (the one explained above) and the advanced list. If you change to the advanced mode, the toolbox will look like this:
Figure Processing 6:
In the advanced view, each group represents a so-called ‘algorithm provider’, which is a set of algorithms coming from the same source, for instance, from a third-party application with geoprocessing capabilities. Some of these groups represent algorithms from third-party applications like SAGA, GRASS or R, while others contain algorithms directly coded as part of the processing plugin, not relying on any additional software.
This view is recommended to those users who have a certain knowledge of the applications that are backing the algorithms, since they will be shown with their original names and groups.
Also, some additional algorithms are available only in the advanced view, such as LiDAR tools and scripts based on the R statistical computing software, among others. Independent QGIS plugins that add new algorithms to the toolbox will only be shown in the advanced view.
In particular, the simplified view contains algorithms from the following providers:
- GRASS
- SAGA
- OTB
- Native QGIS algorithms
In the case of running QGIS under Windows, these algorithms are fully-functional in a fresh installation of QGIS, and they can be run without requiring any additional installation. Also, running them requires no prior knowledge of the external applications they use, making them more accesible for first-time users.
If you want to use an algorithm not provided by any of the above providers, switch to the advanced mode by selecting the corresponding option at the bottom of the toolbox.
Per eseguire un algoritmo è sufficiente un doppio click con il mouse sul suo nome.
La finestra di configurazione di un algoritmo
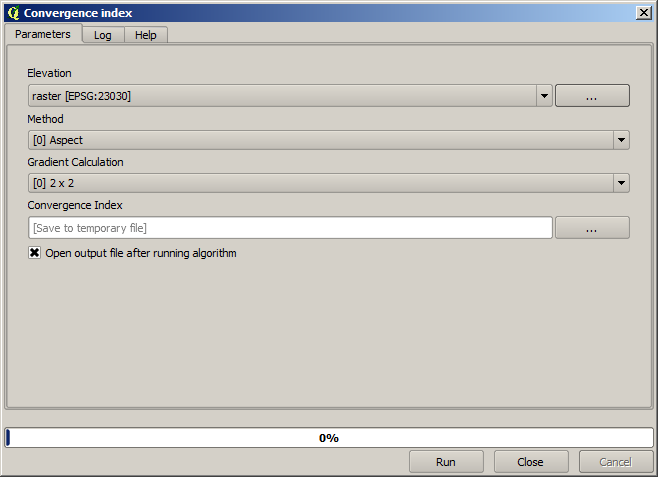
Once you double-click on the name of the algorithm that you want to execute, a dialog similar to that in the figure below is shown (in this case, the dialog corresponds to the SAGA ‘Convergence index’ algorithm).
Figure Processing 7:
This dialog is used to set the input values that the algorithm needs to be executed. It shows a table where input values and configuration parameters are to be set. It of course has a different content, depending on the requirements of the algorithm to be executed, and is created automatically based on those requirements. On the left side, the name of the parameter is shown. On the right side, the value of the parameter can be set.
Anche se il numero e tipo dei parametri dipende dal tipo di algoritmo, la struttura di base è simile per tutti. I parametri della tabella possono essere uno dei seguenti tipi.
A raster layer, to select from a list of all such layers available (currently opened) in QGIS. The selector contains as well a button on its right-hand side, to let you select filenames that represent layers currently not loaded in QGIS.
A vector layer, to select from a list of all vector layers available in QGIS. Layers not loaded in QGIS can be selected as well, as in the case of raster layers, but only if the algorithm does not require a table field selected from the attributes table of the layer. In that case, only opened layers can be selected, since they need to be open so as to retrieve the list of field names available.
Vedrete un pulsante per ciascun selezionatore di vettori come mostrato nella figura.
Figure Processing 8:
Se l’algoritmo ne contiene molti, potrai selezionarne anche solamente uno. Se il pulsante corrispondente a un vettore in input è attivo, allora l’algoritmo verrà eseguito iterativamente su tutte le sue geometrie, invece di una sola volta per tutto il vettore. Il numero di output dipende da quante volte eseguirai l’algoritmo. Questo ti permette di automatizzare il processo quando tutte le geometrie in un vettore devono essere elaborate separatamente.
- A table, to select from a list of all available in QGIS. Non-spatial tables are loaded into QGIS like vector layers, and in fact they are treated as such by the program. Currently, the list of available tables that you will see when executing an algorithm that needs one of them is restricted to tables coming from files in dBase (.dbf) or Comma-Separated Values (.csv) formats.
Opzione, da scegliere in una lista di possibili opzioni.
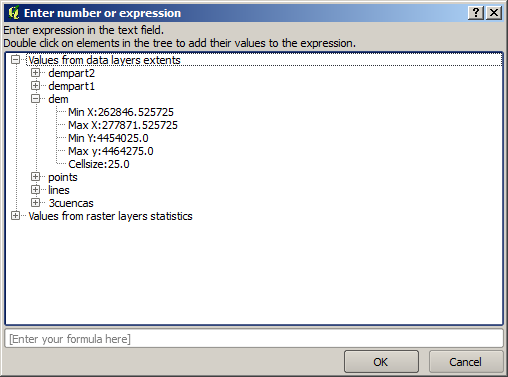
- A numerical value, to be introduced in a text box. You will find a button by its side. Clicking on it, you will see a dialog that allows you to enter a mathematical expression, so you can use it as a handy calculator. Some useful variables related to data loaded into QGIS can be added to your expression, so you can select a value derived from any of these variables, such as the cell size of a layer or the northernmost coordinate of another one.
Figure Processing 9:
Un intervallo, con i valori minimo e massimo da inserire in due corrispondenti caselle di testo.
Una stringa di testo, da inserire in un’apposita casella.
Un campo, da scegliere dalla tabella degli attributi di un vettore, o da una singola tabella selezionata con un altro parametro.
Un sistema di riferimento di coordinate. Puoi inserire direttamente il codice EPSG o selezionarlo dalla finestra di dialogo dei SR che puoi aprire cliccando sul pulsante nella parte destra.
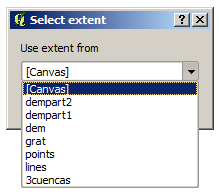
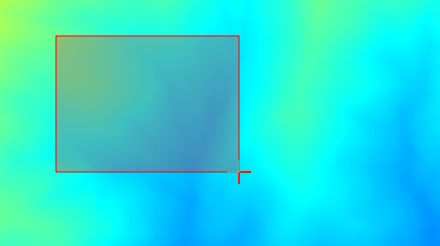
Regione, da inserire mediante i suoi estremi xmin, xmax, ymin, ymax. Premendo il pulsante sulla destra apparirà una finestra che ti permette di scegliere fra: usare la regione attualmente presente nella mappa oppure modificare gli estremi selezionando un rettangolo direttamente con il mouse.
Figure Processing 10
Se scegliete la prima opzione verrà mostrata la seguente finestra di scelta rapida.
Figure Processing 11
Se scegliete la seconda opzione, la finestra dei parametri sparirà, così potrai scegliere l’area tramite il mouse. Una volta selezionato il rettangolo, la finestra di dialogo riapparirà completa dei limiti della regione appena definita.
Figure Processing 12:
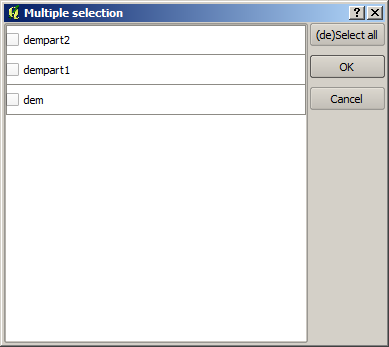
A list of elements (whether raster layers, vector layers or tables), to select from the list of such layers available in QGIS. To make the selection, click on the small button on the left side of the corresponding row to see a dialog like the following one.
Figure Processing 13:
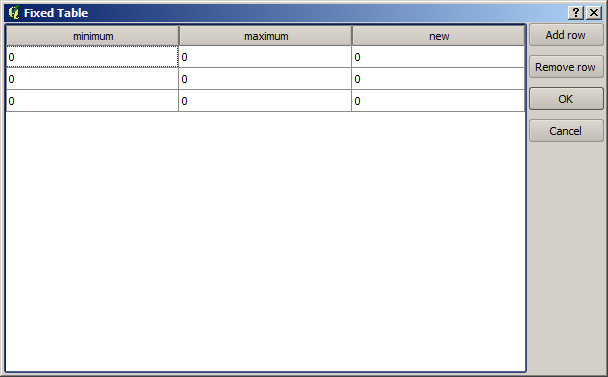
Una piccola tabella da completare a cura dell’utente. Queste tabelle sono usate per definire, ad esempio, parametri tipo tabelle di riferimento o kernel di convoluzione.
Cliccate sul bottone sul lato destro per vedere la tabella e aggiornare i suoi valori.
Figure Processing 14:
A seconda dell’algoritmo, potrai modificare il numero delle righe, usando i pulsanti sul lato destro della finestra.
You will find a [Help] tab in the the parameters dialog. If a help file is available, it will be shown, giving you more information about the algorithm and detailed descriptions of what each parameter does. Unfortunately, most algorithms lack good documentation, but if you feel like contributing to the project, this would be a good place to start.
Nota sulle proiezioni
Algorithms run from the processing framework — this is also true of most of the external applications whose algorithms are exposed through it. Do not perform any reprojection on input layers and assume that all of them are already in a common coordinate system and ready to be analized. Whenever you use more than one layer as input to an algorithm, whether vector or raster, it is up to you to make sure that they are all in the same coordinate system.
Note that, due to QGIS‘s on-the-fly reprojecting capabilities, although two layers might seem to overlap and match, that might not be true if their original coordinates are used without reprojecting them onto a common coordinate system. That reprojection should be done manually, and then the resulting files should be used as input to the algorithm. Also, note that the reprojection process can be performed with the algorithms that are available in the processing framework itself.
By default, the parameters dialog will show a description of the CRS of each layer along with its name, making it easy to select layers that share the same CRS to be used as input layers. If you do not want to see this additional information, you can disable this functionality in the processing configuration dialog, unchecking the Show CRS option.
Se provi a lanciare un algoritmo usando due o più layer con diversi SR , comparirà una finestra di avviso.
Potrai comunque eseguire l’algoritmo, ma sappi che nella maggior parte dei casi ciò produrrà cattivi risultati, come ad esempio layer di uscita inconsistenti, proprio perché questi non sono sovrapposti.
Dati generati dagli algoritmi
I dati generati da un algoritmo possono appartere a una delle seguenti tipologie:
Raster
Un vettore
Tabella
File HTML (usato per risultati testuali e grafici)
These are all saved to disk, and the parameters table will contain a text box corresponding to each one of these outputs, where you can type the output channel to use for saving it. An output channel contains the information needed to save the resulting object somewhere. In the most usual case, you will save it to a file, but the architecture allows for any other way of storing it. For instance, a vector layer can be stored in a database or even uploaded to a remote server using a WFS-T service. Although solutions like these are not yet implemented, the processing framework is prepared to handle them, and we expect to add new kinds of output channels in a near feature.
To select an output channel, just click on the button on the right side of the text box. That will open a save file dialog, where you can select the desired file path. Supported file extensions are shown in the file format selector of the dialog, depending on the kind of output and the algorithm.
The format of the output is defined by the filename extension. The supported formats depend on what is supported by the algorithm itself. To select a format, just select the corresponding file extension (or add it, if you are directly typing the file path instead). If the extension of the file path you entered does not match any of the supported formats, a default extension (usually .dbf` for tables, .tif for raster layers and .shp for vector layers) will be appended to the file path, and the file format corresponding to that extension will be used to save the layer or table.
If you do not enter any filename, the result will be saved as a temporary file in the corresponding default file format, and it will be deleted once you exit QGIS (take care with that, in case you save your project and it contains temporary layers).
You can set a default folder for output data objects. Go to the configuration dialog (you can open it from the Processing menu), and in the General group, you will find a parameter named Output folder. This output folder is used as the default path in case you type just a filename with no path (i.e., myfile.shp) when executing an algorithm.
Durante l’esecuzione di un algoritmo che usa un vettore in modo iterativo, il percorso del file inserito è usato come percorso di base per tutti i file generati, i quali sono nominati usando il nome del vettore e aggiungendo poi un numero che rappresenta l’indice di iterazione. L’estensione del file (e il formato) viene usata per tutti i file generati.
Apart from raster layers and tables, algorithms also generate graphics and text as HTML files. These results are shown at the end of the algorithm execution in a new dialog. This dialog will keep the results produced by any algorithm during the current session, and can be shown at any time by selecting Processing ‣ Results viewer from the QGIS main menu.
Some external applications might have files (with no particular extension restrictions) as output, but they do not belong to any of the categories above. Those output files will not be processed by QGIS (opened or included into the current QGIS project), since most of the time they correspond to file formats or elements not supported by QGIS. This is, for instance, the case with LAS files used for LiDAR data. The files get created, but you won’t see anything new in your QGIS working session.
Per tutti gli altri tipi di output, troverai una casella di controllo che potrai usare per indicare se caricare o meno il file una volta che è stato generato dall’algoritmo. Come impostazione predefinita, tutti i file vengono aperti.
Optional outputs are not supported. That is, all outputs are created. However, you can uncheck the corresponding checkbox if you are not interested in a given output, which essentially makes it behave like an optional output (in other words, the layer is created anyway, but if you leave the text box empty, it will be saved to a temporary file and deleted once you exit QGIS).
Configurazione dell’ambiente di elaborazione
Come è stato detto, il menu di configurazione dà accesso ad una nuova finestra di dialogo in cui puoi configurare la modalità con la quale funzionano gli algoritmi. I parametri di configurazione sono strutturati in blocchi separati che puoi selezionare sul lato sinistro della finestra di dialogo.
Along with the aforementioned Output folder entry, the General block contains parameters for setting the default rendering style for output layers (that is, layers generated by using algorithms from any of the framework GUI components). Just create the style you want using QGIS, save it to a file, and then enter the path to that file in the settings so the algorithms can use it. Whenever a layer is loaded by SEXTANTE and added to the QGIS canvas, it will be rendered with that style.
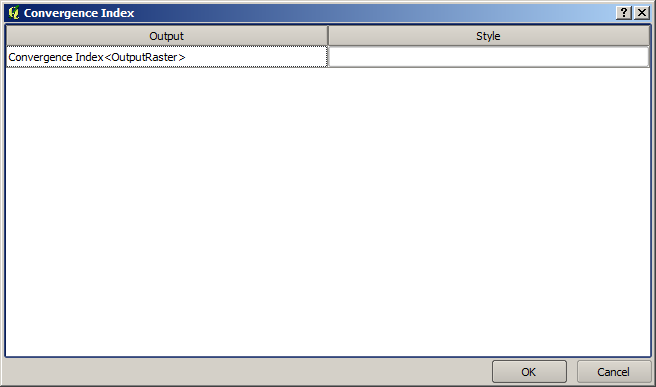
Gli stili di visualizzazione possono essere configurati individualmente per ogni algoritmo e per ciascuno dei suoi output. Basta fare click con il pulsante destro del mouse sul nome dell’algoritmo nella casella degli strumenti e selezionare la voce Modifica gli stili di visualizzazione per l’output. Vedrete una finestra come quella mostrata di seguito.
Figure Processing 15:
Selezionate il file di stile (.qml) che vuoi assegnare ad ogni risultato e premi [OK].
Altri parametri di configurazione nel gruppo Generale sono elencati di seguito:
Use filename as layer name. Il nome di ogni layer risultante creato da un algoritmo è definito dall’algoritmo stesso. In alcuni casi puoi usare un nome unico, il che significa che verrà utilizzato lo stesso nome i output, a prescindere dal layer in input. In altri casi, il nome potrebbe dipendere dal nome del layer in input o da alcuni parametri utilizzati dell’algoritmo. Se hai selezionato la casella di controllo, il nome verrà preso invece dal nome del file di output. Nota che, se l’output viene salvato in un file temporaneo, il nome di questo file temporaneo è di solito lungo e privo di significato in moda da evitare conflitti con altri nomi di file già esistenti.
Use only selected features. Se hai selezionato questa opzione, l’esecuzione dell’algoritmo avverrà solamente sulle geometrie selezionate. Se non hai selezionato nessuna geometria, allora l’algoritmo agirà sull’intero vettore.
Pre-execution script file e Post-execution script file. Questi parametri fanno riferimento alla possibilità di scrivere script e sono spiegati nella sezione che tratta lo scripting e la console.
Oltre alla sezione Generale nella finestra di dialogo, ne troverai uno per ogni fornitore di algoritmi. Ogni programma contiene una casella di controllo Activate che puoi usare per far apparire o meno gli algoritmi di quel programma negli Strumenti. Inoltre alcuni fornitori di algoritmi hanno elementi specifici di configurazione che ti spiegheremo successivamente.
