.
Strumenti generali
Scorciatoie da tastiera
QGIS provides default keyboard shortcuts for many features. You can find them in section Barra dei Menu. Additionally, the menu option Settings ‣ Configure Shortcuts.. allows you to change the default keyboard shortcuts and to add new keyboard shortcuts to QGIS features.
Figure Shortcuts 1:
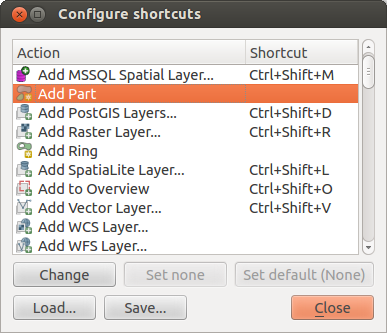
Define shortcut options  (Gnome)
Configuration is very simple. Just select a feature from the list and click on [Change], [Set none] or [Set default]. Once you have finished your configuration, you can save it as an XML file and load it to another QGIS installation.
Guide contestuali
Se vuoi ottenere maggiori informazioni su una funzionalità specifica puoi usare il pulsante [Aiuto] disponibile in molte finestre di dialogo. Nota che nel caso di plugin di terze parti la guida contestuale potrebbe rimandare ad una pagina web dedicata.
Visualizzazione
By default, QGIS renders all visible layers whenever the map canvas is refreshed. The events that trigger a refresh of the map canvas include:
Aggiungi un layer
Sposti, ingrandisci o riduci la mappa
- Resizing the QGIS window
Cambi la visibilità di uno o più layer
QGIS allows you to control the rendering process in a number of ways.
Visualizzazione in funzione della scala
La visualizzazione in funzione della scala permette di specificare la scala minima e massima alla quale il vettore verrà visualizzato. Per impostare questa funzionalità, apri la finestra Proprietà facendo doppio click sul vettore. Nella scheda Generale, clicca sulla casella di controllo  Visualizzazione dipendente dalla scala: potrai cosi inserire i valori minimi e massimi di visualizzazione della scala.
You can determine the scale values by first zooming to the level you want to use and noting the scale value in the QGIS status bar.
Controllare la visualizzazione della mappa
Map rendering can be controlled in the various ways, as described below.
Sospensione della visualizzazione
To suspend rendering, click the Render checkbox in the
lower right corner of the status bar. When the Render
checkbox is not checked, QGIS does not redraw the canvas in response to any of
the events described in section Visualizzazione. Examples of when you
might want to suspend rendering include:
Aggiunta di molti layer con simbologia predefinita prima della visualizzazione
Aggiunta di uno o più layer di grosse dimensioni e impostazione di una scala prima della visualizzazione
Aggiunta di uno o più layer di grossa dimensione e zoom ad un’area specifica prima della visualizzazione
Combinazioni delle precedenti
Se la casella di controllo Aggiorna è spuntata, la visualizzazione e l’aggiornamento della mappa saranno immediati.
Controllare la visibilità dei layer quando sono caricati
Puoi scegliere l’opzione di caricare i nuovi layer senza che questi vengano immediatamente visualizzati sulla mappa. Ciò significa che quando aggiungerai un layer al progetto, la casella di controllo per la visibilità nella legenda risulterà disabilitata. Per impostare questa opzione, apri il menu Impostazioni ‣ Opzioni ‣ e clicca sulla scheda Visualizzazione. Deseleziona la casella di controllo Per impostazione predefinita i nuovi layer aggiunti alla mappa vengono visualizzati subito. Ogni layer aggiunto alla mappa risulterà essere quindi spento (invisibile).
Fermare la visualizzazione
Per fermare la visualizzazione della mappa primi il tasto ESC. In questo modo l`aggiornamento della mappa verrà bloccato e la mappa rimarrà parzialmente disegnata. Dopo aver premuto il tasto ESC potrebbe passare un po` di tempo finché l`interruzione della visualizzazione della mappa sia effettiva.
Nota
Attualmente non si può interrompere la visualizzazione in corso: questa opzione è stata disabilitata nella porta Qt4 a causa di diversi problemi dell’interfaccia utente (UI).
Updating the Map Display During Rendering
You can set an option to update the map display as features are drawn. By default, QGIS does not display any features for a layer until the entire layer has been rendered. To update the display as features are read from the datastore, choose menu option Settings ‣ Options and click on the Rendering tab. Set the feature count to an appropriate value to update the display during rendering. Setting a value of 0 disables update during drawing (this is the default). Setting a value too low will result in poor performance, as the map canvas is continually updated during the reading of the features. A suggested value to start with is 500.
Modificare la qualità della visualizzazione
To influence the rendering quality of the map, you have two options. Choose menu option Settings ‣ Options, click on the Rendering tab and select or deselect following checkboxes:
- Make lines appear less jagged at the expense of some
drawing performance
- Fix problems with incorrectly filled polygons
Velocizzare la visualizzazione
There are two settings that allow you to improve rendering speed. Open the QGIS options dialog using Settings ‣ Options, go to the Rendering tab and select or deselect the following checkboxes:
- Enable back buffer. This provides better graphics
performance at the cost of losing the possibility to cancel rendering and
incrementally draw features. If it is unchecked, you can set the
Number of features to draw before updating the display, otherwise
this option is inactive.
- Usa il caching del disegno quando possibile per velocizzare la visualizzazione
Misurazioni
Measuring works within projected coordinate systems (e.g., UTM) and unprojected data. If the loaded map is defined with a geographic coordinate system (latitude/longitude), the results from line or area measurements will be incorrect. To fix this, you need to set an appropriate map coordinate system (see section Lavorare con le proiezioni). All measuring modules also use the snapping settings from the digitizing module. This is useful, if you want to measure along lines or areas in vector layers.
To select a measuring tool, click on  and select the tool you want
to use.
and select the tool you want
to use.
Measure length, areas and angles
Measure Line: QGIS is able to measure real distances
between given points according to a defined ellipsoid. To configure this,
choose menu option Settings ‣ Options, click on the
Map tools tab and select the appropriate ellipsoid. There, you can
also define a rubberband color and your preferred measurement units (meters or
feet) and angle units (degrees, radians and gon). The tool then allows you to
click points on the map. Each segment length, as well as the total, shows up in
the measure window. To stop measuring, click your right mouse button.
Note that you can interactively change the measurement units in the measurement
dialog. It overrides the Preferred measurement units in the options.
There is an info section in the dialog that shows which CRS settings are being used
during measurement calculations.
Figure Measure 1:
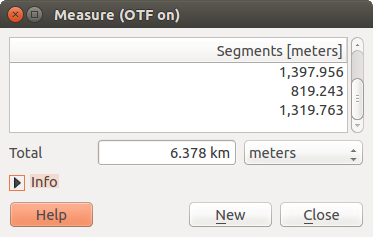
Measure Distance (Gnome)
 Measure Area: Areas can also be measured. In the
measure window, the accumulated area size appears. In addition, the measuring
tool will snap to the currently selected layer, provided that layer has its
snapping tolerance set (see section Settare la tolleranza dello snapping e il raggio di ricerca degli elementi). So, if you want
to measure exactly along a line feature, or around a polygon feature, first set
its snapping tolerance, then select the layer. Now, when using the measuring
tools, each mouse click (within the tolerance setting) will snap to that layer.
Measure Area: Areas can also be measured. In the
measure window, the accumulated area size appears. In addition, the measuring
tool will snap to the currently selected layer, provided that layer has its
snapping tolerance set (see section Settare la tolleranza dello snapping e il raggio di ricerca degli elementi). So, if you want
to measure exactly along a line feature, or around a polygon feature, first set
its snapping tolerance, then select the layer. Now, when using the measuring
tools, each mouse click (within the tolerance setting) will snap to that layer.
Figure Measure 2:
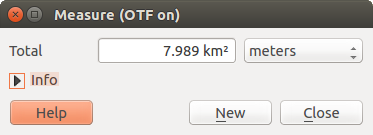
Measure Area (Gnome)
 Measure Angle: You can also measure angles. The
cursor becomes cross-shaped. Click to draw the first segment of the angle you
wish to measure, then move the cursor to draw the desired angle. The measure
is displayed in a pop-up dialog.
Measure Angle: You can also measure angles. The
cursor becomes cross-shaped. Click to draw the first segment of the angle you
wish to measure, then move the cursor to draw the desired angle. The measure
is displayed in a pop-up dialog.
Figure Measure 3:
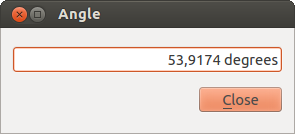
Measure Angle (Gnome)
Selezionare e deselezionare elementi
The QGIS toolbar provides several tools to select features in the map canvas.
To select one or several features, just click on  and select your
tool:
and select your
tool:
- Select Single Feature
 Select Features by Rectangle
 Select Features by Polygon
 Select Features by Freehand
 Select Features by Radius
To deselect all selected features click on  Deselect
features from all layers.
Deselect
features from all layers.
 Select feature using an expression allow user
to select feature using expression dialog. See Expressions
chapter for some example.
Select feature using an expression allow user
to select feature using expression dialog. See Expressions
chapter for some example.
Users can save features selection into a New Memory Vector Layer or a New Vector Layer using Edit ‣ Paste Feature as ... and choose the mode you want.
Informazione elementi
The Identify tool allows you to interact with the map canvas and get information on features
in a pop-up window. To identify features, use View ‣ Identify
features or press Ctrl + Shift + I, or click on the  Identify features icon in the toolbar.
If you click on several features, the Identify results dialog will list information about all the selected features. The first item is the number of the layer in the list of results, followed by the layer name. Then, its first child will be the name of a field with its value. The first field is the one selected in Properties ‣ Display. Finally, all information about the feature is displayed.
Puoi personalizzare questa finestra in modo da visualizzare determinati campi, ma in modo predefinito vengono mostrati tre tipi di informazione:
- Actions: Actions can be added to the identify feature windows. When clicking on the action label, action will be run. By default, only one action is added, to view feature form for editing.
- Derived: This information is calculated or derived from other information. You can find clicked coordinate, X and Y coordinates, area in map units and perimeter in map units for polygons, length in map units for lines and feature ids.
- Data attributes: This is the list of attribute fields from the data.
Figure Identify 1:
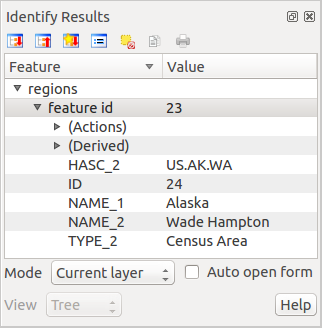
Identify feaures dialog (Gnome)
At the top of the window, you have five icons:
 Expand tree
 Collapse tree
 Default behaviour
 Copy attributes
 Print selected HTML response
At the bottom of the window, you have the Mode and View comboboxes. With the Mode combobox you can define the identify mode: ‘Current layer’, ‘Top down, stop at first’, ‘Top down’ and ‘Layer selection’. The View can be set as ‘Tree’, ‘Table’ and ‘Graph’.
The identify tool allows you to auto open a form. In this mode you can change the feautures attributes.
Puoi trovare altre opzioni nel menu contestuale dell’elemento identificato. Per esempio, dal menu contestuale puoi:
Visualizzare modulo geometria
Zoomare alla geometria
Copiare elementi: copiare tutti gli elementi e gli attributi della geometria
- Toggle feature selection: adds identified feature to selection
Copiare un valore di un attributo: copiare solo il valore dell’attributo identificato
- Copy feature attributes: Copy only attributes
Cancellare risultati: verranno cancellati i risultati nella finestra
Cancellare evidenziati: verranno cancellate le geometrie evidenziate sulla mappa
Evidenziare tutto
Evidenziare vettore
Attivare un vettore: scegliere un vettore che deve essere attivato
Proprietà del vettore: aprire la finestra delle proprietà del vettore
Espandi tutto
Racchiudi tutto
Decorazioni
The Decorations of QGIS include the Grid, the Copyright Label, the North Arrow and the Scale Bar. They are used to ‘decorate’ the map by adding cartographic elements.
Reticolo
 Reticolo ti permette di aggiungere un reticolo e le coordinata alla mappa.
Figure Decorations 1:
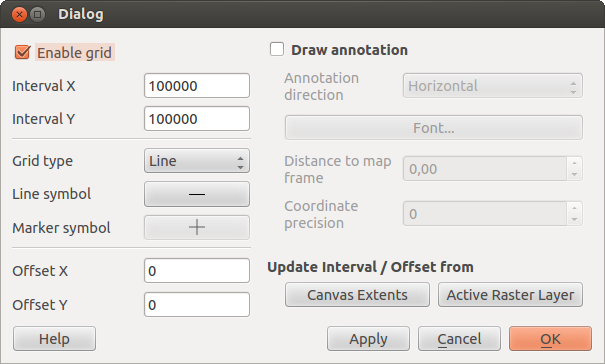
The Grid Dialog
Seleziona dal menu Visualizza ‣ Decorazioni‣ Reticolo. Si aprirà un`altra finestra (vedi figure_decorations_1).
Attiva la casella di controllo
Abilita reticolo e imposta i valori che preferisci in funzione dei layer caricati sulla mappa.Attiva la casella di controllo
Scrivi coordinate e imposta le proprietà migliori in base agli elementi che hai caricato sulla mappa.- Click [Apply] to verify that it looks as expected.
- Click [OK] to close the dialog.
Etichetta Copyright
 Copyright label adds a copyright label using the text
you prefer to the map.
Copyright label adds a copyright label using the text
you prefer to the map.
Figure Decorations 2:
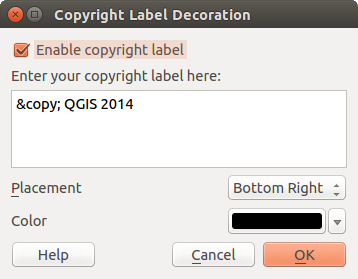
The Copyright Dialog
Seleziona dal menu Visualizza ‣ Decorazioni‣ Etichetta copyright. Si aprirà un`altra finestra (vedi figure_decorations_2).
Digita il testo che vuoi aggiungere alla mappa. Puoi anche usare il linguaggio HTML come mostrato nell’esempio.
- Choose the placement of the label from the Placement
 combo box.
 Assicurati che la casella di controllo
Abilita etichetta di copyright sia spuntata.- Click [OK].
In the example above, which is the default, QGIS places a copyright symbol followed by the date in the lower right-hand corner of the map canvas.
Freccia Nord
![]() North Arrow places a simple north arrow on the map canvas.
At present, there is only one style available. You can adjust the angle of the
arrow or let QGIS set the direction automatically. If you choose to let QGIS
determine the direction, it makes its best guess as to how the arrow should be
oriented. For placement of the arrow, you have four options, corresponding to
the four corners of the map canvas.
North Arrow places a simple north arrow on the map canvas.
At present, there is only one style available. You can adjust the angle of the
arrow or let QGIS set the direction automatically. If you choose to let QGIS
determine the direction, it makes its best guess as to how the arrow should be
oriented. For placement of the arrow, you have four options, corresponding to
the four corners of the map canvas.
Figure Decorations 3:
The North Arrow Dialog
Barra di Scala
 Scale Bar adds a simple scale bar to the map canvas. You
can control the style and placement, as well as the labeling of the bar.
Scale Bar adds a simple scale bar to the map canvas. You
can control the style and placement, as well as the labeling of the bar.
Figure Decorations 4:
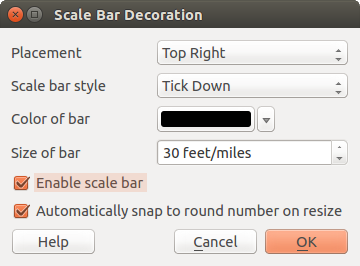
The Scale Bar Dialog
QGIS only supports displaying the scale in the same units as your map frame. So if the units of your layers are in meters, you can’t create a scale bar in feet. Likewise, if you are using decimal degrees, you can’t create a scale bar to display distance in meters.
Per aggiungere una barra di scala:
Seleziona dal menu Visualizzazione ‣ Decorazioni‣ Barra di scala. Si aprirà cosi una finestra di dialogo (see figure_decorations_4)
- Choose the placement from the Placement combo box.
- Choose the style from the Scale bar style
combo box.
- Select the color for the bar Color of bar
 or use
the default black color.
or use
the default black color. - Set the size of the bar and its label Size of bar
 .
. Assicurati che la casella di controllo
Abilitare barra di scala sia spuntata.- Optionally, check Automatically snap to round number
on resize.
- Click [OK].
Suggerimento
Impostazioni delle decorazioni
Quando salvi un progetto .qgs, ogni impostazione relativa alle decorazioni viene salvata nel file e ripristinata alla successiva apertura del progetto.
Note testuali
The  Text Annotation tool in the attribute
toolbar provides the possibility to place formatted text in a balloon on the
QGIS map canvas. Use the Text Annotation tool and click into the
map canvas.
Text Annotation tool in the attribute
toolbar provides the possibility to place formatted text in a balloon on the
QGIS map canvas. Use the Text Annotation tool and click into the
map canvas.
Figure annotation 1:
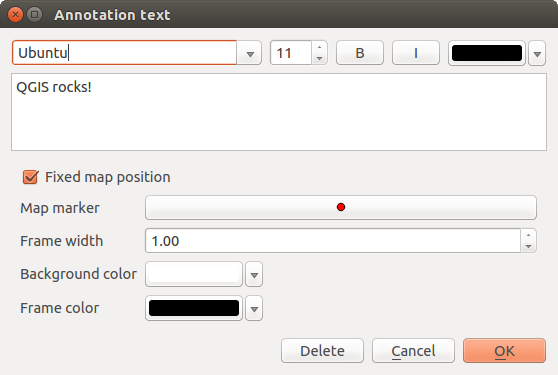
Annotation text dialog
Se fai doppio click sull’elemento aggiunto alla mappa si aprirà una finestra di dialogo con diverse opzioni. Avrai accesso a un editor per aggiungere il testo della nota. Inoltre hai anche la possibilità di scegliere se la nota dovrà essere posizionata su un punto preciso della mappa (visualizzata come indicatore) oppure se la posizione della nota dovrà essere relativa a una posizione dello schermo (quindi indipendente dalla mappa). Puoi muovere sia tutta la nota (trascinando l’indicatore) sia solamente il testo (trascinando il riquadro del testo).
The  Move Annotation tool allows you to move the
annotation on the map canvas.
Move Annotation tool allows you to move the
annotation on the map canvas.
Note Html
The  Html Annotation tools in the attribute
toolbar provides the possibility to place the content of an html file in a
balloon on the QGIS map canvas. Using the Html Annotation tool, click
into the map canvas and add the path to the html file into the dialog.
Html Annotation tools in the attribute
toolbar provides the possibility to place the content of an html file in a
balloon on the QGIS map canvas. Using the Html Annotation tool, click
into the map canvas and add the path to the html file into the dialog.
Note SVG
The  SVG Annotation tool in the attribute toolbar
provides the possibility to place an SVG symbol in a balloon on the QGIS map
canvas. Using the SVG Annotation tool, click into the map canvas and
add the path to the SVG file into the dialog.
SVG Annotation tool in the attribute toolbar
provides the possibility to place an SVG symbol in a balloon on the QGIS map
canvas. Using the SVG Annotation tool, click into the map canvas and
add the path to the SVG file into the dialog.
Modulo annotazioni
Additionally, you can also create your own annotation forms. The
Form Annotation tool is useful to display
attributes of a vector layer in a customized Qt Designer form (see
figure_custom_annotation). This is similar to the designer forms for the
Identify features tool, but displayed in an annotation item.
Also see this video https://www.youtube.com/watch?v=0pDBuSbQ02o from
Tim Sutton for more information.
Figure annotation 2:
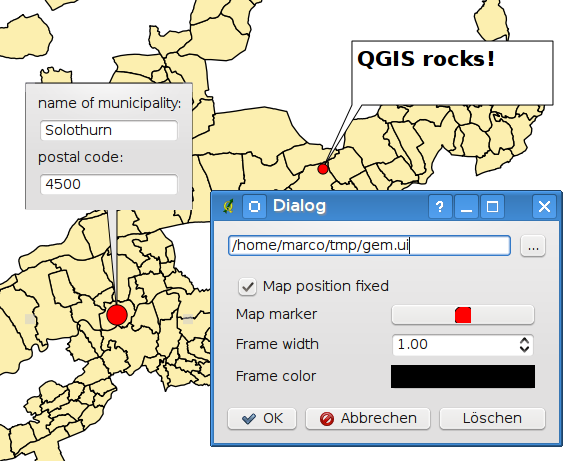
Customized qt designer annotation form
Nota
Nota: Premendo Ctrl+T con uno strumento nota attivo (Nota testuale, Nota con modulo, Muovi nota) lo stato di visualizzazione delle note si inverte: se sono visibili diventano invisibili e viceversa.
Segnalibri geospaziali
Spatial Bookmarks allow you to “bookmark” a geographic location and return to it later.
Creazione di un segnalibro
Per creare un segnalibro:
Usa lo zoom o muovi la mappa all’estensione d’interesse.
- Select the menu option View ‣ New Bookmark or press Ctrl-B.
Inserisci un nome descrittivo per il segnalibro (fino a 255 caratteri).
- Press Enter to add the bookmark or [Delete] to remove the bookmark.
Nota che puoi avere più di un segnalibro con lo stesso nome.
Uso e gestione dei segnalibri
To use or manage bookmarks, select the menu option View ‣ Show Bookmarks. The Geospatial Bookmarks dialog allows you to zoom to or delete a bookmark. You cannot edit the bookmark name or coordinates.
Zooming to a Bookmark
From the Geospatial Bookmarks dialog, select the desired bookmark by clicking on it, then click [Zoom To]. You can also zoom to a bookmark by double-clicking on it.
Deleting a Bookmark
To delete a bookmark from the Geospatial Bookmarks dialog, click on it, then click [Delete]. Confirm your choice by clicking [Yes], or cancel the delete by clicking [No].
Import or export a bookmark
To share or transfer your bookmarks between computers you can use the Share pull down menu in the Geospatial Bookmarks dialog.
Progetti nidificati
Se vuoi nidificare dei layer di altri progetti nel tuo progetto attuale, seleziona Layer ‣ Includi layer e gruppi....
Layers inclusi
La finestra di dialogo ti permette di scegliere quali layer di altri progetti puoi includere. Di seguito un piccolo esempio:
- Press
 to look for another project from the Alaska dataset.
 - Select the project file grassland. You can see the content of the project (see figure_embed_dialog).
- Press Ctrl and click on the layers grassland and regions. Press [OK]. The selected layers are embedded in the map legend and the map view now.
Figure Nesting 1:
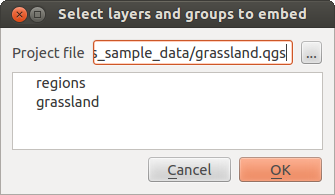
Select layers and groups to embed
Anche se i layer nidificati sono modificabili, non puoi modificarne le proprietà, come stile ed etichette.
Rimuovi i layer nidificati
Right-click on the embedded layer and choose  Remove.