.
La caja de herramientas
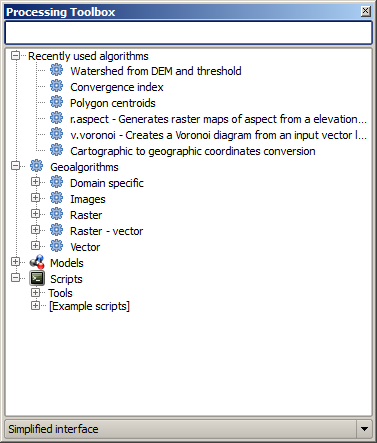
La Caja de herramientas es el principal elemento de procesamiento de la interfaz gráfica de usuario, y el que más se suele usar en el trabajo diario. Muestra un listado de todos los algoritmos disponibles agrupados en diferentes bloques, y es el punto de acceso para ejecutarlos, bien haciéndolo como un proceso único o bien como un proceso por lotes que realice varias ejecuciones del mismo algoritmo con diferentes conjuntos de entradas.
Figure Processing 5:
The toolbox contains all the available algorithms, divided into predefined groups. All these groups are found under a single tree entry named Geoalgorithms.
Additionally, two more entries are found, namely Models and Scripts. These include user-created algorithms, and they allow you to define your own workflows and processing tasks. We will devote a full section to them a bit later.
En la parte superior de la caja de herramientas, hay una caja de texto. Para reducir el número de algoritmos que se muestran en la caja de herramientas y que resulte más fácil encontrar el que se necesita, se puede introducir cualquier palabra o frase en esa caja de texto. Según se va escribiendo, el número de algorimos que se muestra se va reduciendo a sólo aquellos que contienen el texto introducido en su nombre.
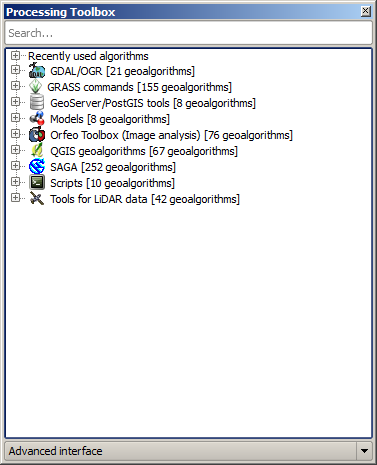
In the lower part, you will find a box that allows you to switch between the simplified algorithm list (the one explained above) and the advanced list. If you change to the advanced mode, the toolbox will look like this:
Figure Processing 6:
In the advanced view, each group represents a so-called ‘algorithm provider’, which is a set of algorithms coming from the same source, for instance, from a third-party application with geoprocessing capabilities. Some of these groups represent algorithms from third-party applications like SAGA, GRASS or R, while others contain algorithms directly coded as part of the processing plugin, not relying on any additional software.
This view is recommended to those users who have a certain knowledge of the applications that are backing the algorithms, since they will be shown with their original names and groups.
Also, some additional algorithms are available only in the advanced view, such as LiDAR tools and scripts based on the R statistical computing software, among others. Independent QGIS plugins that add new algorithms to the toolbox will only be shown in the advanced view.
In particular, the simplified view contains algorithms from the following providers:
- GRASS
- SAGA
- OTB
- Native QGIS algorithms
In the case of running QGIS under Windows, these algorithms are fully-functional in a fresh installation of QGIS, and they can be run without requiring any additional installation. Also, running them requires no prior knowledge of the external applications they use, making them more accesible for first-time users.
If you want to use an algorithm not provided by any of the above providers, switch to the advanced mode by selecting the corresponding option at the bottom of the toolbox.
Para ejecutar un algoritmo, basta con hacer doble click sobre su nombre en la caja de herramientas.
El cuadro de diálogo de algoritmo
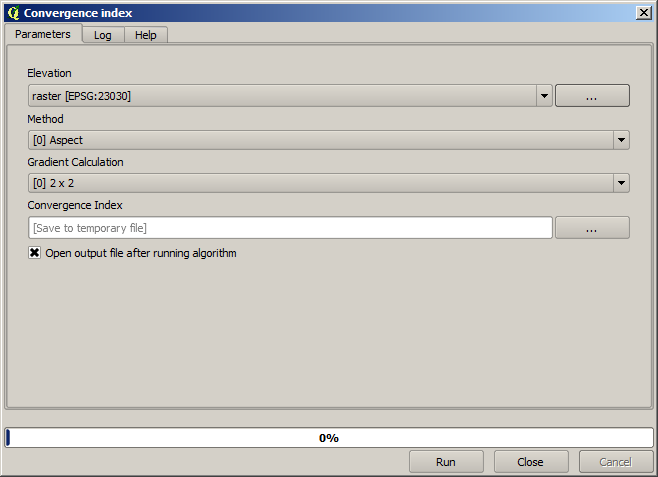
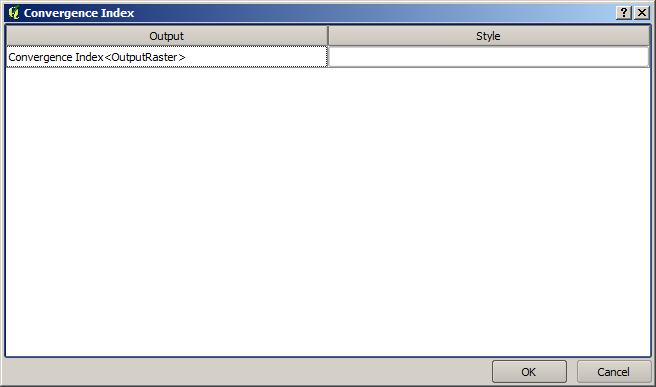
Once you double-click on the name of the algorithm that you want to execute, a dialog similar to that in the figure below is shown (in this case, the dialog corresponds to the SAGA ‘Convergence index’ algorithm).
Figure Processing 7:
This dialog is used to set the input values that the algorithm needs to be executed. It shows a table where input values and configuration parameters are to be set. It of course has a different content, depending on the requirements of the algorithm to be executed, and is created automatically based on those requirements. On the left side, the name of the parameter is shown. On the right side, the value of the parameter can be set.
Aunque el número y el tipo de parámetro dependen de las características del algoritmo, la estructura es similar para todos ellos. Los parámetros encontrados en la tabla pueden ser de uno de los siguientes tipos.
A raster layer, to select from a list of all such layers available (currently opened) in QGIS. The selector contains as well a button on its right-hand side, to let you select filenames that represent layers currently not loaded in QGIS.
A vector layer, to select from a list of all vector layers available in QGIS. Layers not loaded in QGIS can be selected as well, as in the case of raster layers, but only if the algorithm does not require a table field selected from the attributes table of the layer. In that case, only opened layers can be selected, since they need to be open so as to retrieve the list of field names available.
Se ve un botón por cada selector de capa vectorial, como se muestra en la figura inferior.
Figure Processing 8:
Si el algoritmo contiene varios de ellos, será capaz de cambiar cada uno de ellos. Si el botón correspondiente a una entrada vectorial se cambia, el algoritmo será ejecutado iterativamente en cada uno de sus elementos, en lugar de sólo una vez para toda la capa, produciendo mayor cantidad de salidas como veces que se ejecuta el algoritmo. Esto permite la automatización del proceso cuando todas las características de una capa tienen que ser procesados por separado.
- A table, to select from a list of all available in QGIS. Non-spatial
tables are loaded into QGIS like vector layers, and in fact they are treated as
such by the program. Currently, the list of available tables that you will see
when executing an algorithm that needs one of them is restricted to
tables coming from files in dBase (
.dbf) or Comma-Separated Values (.csv) formats. Una opción, a elegir de una lista de selección de posibles opciones.
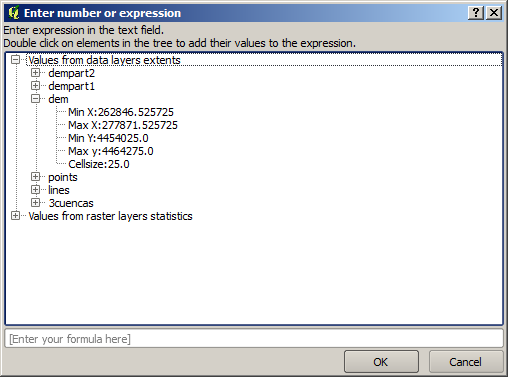
- A numerical value, to be introduced in a text box. You will find a button by its side. Clicking on it, you will see a dialog that allows you to enter a mathematical expression, so you can use it as a handy calculator. Some useful variables related to data loaded into QGIS can be added to your expression, so you can select a value derived from any of these variables, such as the cell size of a layer or the northernmost coordinate of another one.
Figure Processing 9:
Un rango, con valores mínimo y máximo que se introducen en dos cuadros de texto.
Una cadena de texto, que se introduce en un cuadro de texto.
Un campo, a elegir desde la tabla de atributos de una capa vectorial o una tabla sencilla seleccionada en otro parámetro.
Un sistema de referencia de coordenadas. Que puede escribir el código EPSG directamente en la caja de texto, o seleccionarlo desde el diálogo SRC que aparece cuando al hacer clic sobre el botón del lado derecho
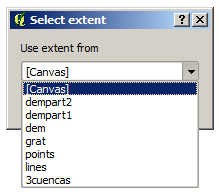
Una extensión que deberá inscribirse por cuatro números que representan sus límites
xmin,xmax,ymin,ymax. Al hacer clic en el botón en la parte derecha del selector de valor, aparecerá un menú emergente, que le dará dos opciones: para seleccionar el valor de una capa o la extensión de la lienzo actual, o para definirlo arrastrando directamente sobre el lienzo del mapa.Figure Processing 10
Si se selecciona la primera opción, se verá una ventana como la siguiente.
Figure Processing 11
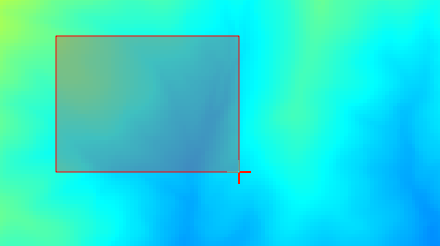
Si se selecciona la segunda opción, la ventana de parámetros se ocultará, para que se pueda definir el rectángulo haciendo click y arrastrando dentro del lienzo. Una vez hecho esto, el cuadro de diálogo reaparecerá, con los valores correspondientes ya rellenos en en cuadro de texto.
Figure Processing 12:
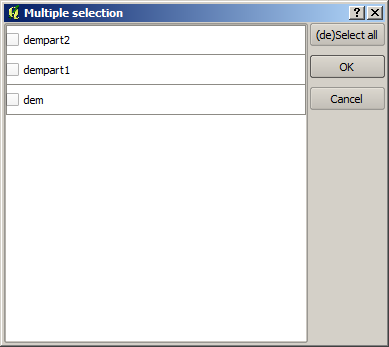
A list of elements (whether raster layers, vector layers or tables), to select from the list of such layers available in QGIS. To make the selection, click on the small button on the left side of the corresponding row to see a dialog like the following one.
Figure Processing 13:
Una pequeña tabla para que la edite el usuario. Éstas se usan para definir parámetros como tablas de búsqueda o matrices de convolución entre otros.
Click en el botón del lado derecho para ver la tabla y editar sus valores.
Figure Processing 14:
Dependiendo del algoritmo, el número de filas que pueden ser modificadas o no al utilizar los botones del lado derecho de la ventana.
You will find a [Help] tab in the the parameters dialog. If a help file is available, it will be shown, giving you more information about the algorithm and detailed descriptions of what each parameter does. Unfortunately, most algorithms lack good documentation, but if you feel like contributing to the project, this would be a good place to start.
Un comentario sobre proyecciones
Algorithms run from the processing framework — this is also true of most of the external applications whose algorithms are exposed through it. Do not perform any reprojection on input layers and assume that all of them are already in a common coordinate system and ready to be analized. Whenever you use more than one layer as input to an algorithm, whether vector or raster, it is up to you to make sure that they are all in the same coordinate system.
Note that, due to QGIS‘s on-the-fly reprojecting capabilities, although two layers might seem to overlap and match, that might not be true if their original coordinates are used without reprojecting them onto a common coordinate system. That reprojection should be done manually, and then the resulting files should be used as input to the algorithm. Also, note that the reprojection process can be performed with the algorithms that are available in the processing framework itself.
By default, the parameters dialog will show a description of the CRS of each layer along with its name, making it easy to select layers that share the same CRS to be used as input layers. If you do not want to see this additional information, you can disable this functionality in the processing configuration dialog, unchecking the Show CRS option.
Si intenta ejecutar un algoritmo utilizando como entrada dos o más capas con SRC diferentes, se mostrará un diálogo de advertencia.
Aún se puede ejecutar el algoritmo, pero en la mayoría de los casos se producirán resultados incorrectos, como capas vacias debido a que las capas de entrada no se solapan.
Resultados generados por algoritmos
Los tipos de resultados que se pueden generar cor un algoritmo son los siguientes:
Una capa ráster.
Una capa vectorial.
Una tabla
Un archivo HTML (usado para salidas de texto y salidas gráficas).
These are all saved to disk, and the parameters table will contain a text box corresponding to each one of these outputs, where you can type the output channel to use for saving it. An output channel contains the information needed to save the resulting object somewhere. In the most usual case, you will save it to a file, but the architecture allows for any other way of storing it. For instance, a vector layer can be stored in a database or even uploaded to a remote server using a WFS-T service. Although solutions like these are not yet implemented, the processing framework is prepared to handle them, and we expect to add new kinds of output channels in a near feature.
To select an output channel, just click on the button on the right side of the text box. That will open a save file dialog, where you can select the desired file path. Supported file extensions are shown in the file format selector of the dialog, depending on the kind of output and the algorithm.
The format of the output is defined by the filename extension. The supported
formats depend on what is supported by the algorithm itself. To select a format,
just select the corresponding file extension (or add it, if you are directly typing
the file path instead). If the extension of the file path you entered does not
match any of the supported formats, a default extension (usually .dbf` for
tables, .tif for raster layers and .shp for vector layers) will be
appended to the file path, and the file format corresponding to that extension will
be used to save the layer or table.
If you do not enter any filename, the result will be saved as a temporary file in the corresponding default file format, and it will be deleted once you exit QGIS (take care with that, in case you save your project and it contains temporary layers).
You can set a default folder for output data objects. Go to the configuration
dialog (you can open it from the Processing menu), and in the
General group, you will find a parameter named Output folder.
This output folder is used as the default path in case you type just a filename
with no path (i.e., myfile.shp) when executing an algorithm.
Al ejecutar un algoritmo que utiliza una capa vectorial en modo iterativo, la ruta del archivo introducido se utiliza como la ruta de la base para todos los archivos generados, los cuales se denominan utilizando el nombre base y añadiendo un número que representa el índice de la iteración. La extensión del archivo (y el formato) se utiliza para todos los archivos generados.
Apart from raster layers and tables, algorithms also generate graphics and text as HTML files. These results are shown at the end of the algorithm execution in a new dialog. This dialog will keep the results produced by any algorithm during the current session, and can be shown at any time by selecting Processing ‣ Results viewer from the QGIS main menu.
Some external applications might have files (with no particular extension restrictions) as output, but they do not belong to any of the categories above. Those output files will not be processed by QGIS (opened or included into the current QGIS project), since most of the time they correspond to file formats or elements not supported by QGIS. This is, for instance, the case with LAS files used for LiDAR data. The files get created, but you won’t see anything new in your QGIS working session.
Para todos los otros tipos de salida, encontrará una casilla de verificación que se puede utilizar para decirle al algoritmo si se debe cargar el archivo una vez que se genera por el algoritmo o no. Por defecto, se abren todos los archivos.
Optional outputs are not supported. That is, all outputs are created. However, you can uncheck the corresponding checkbox if you are not interested in a given output, which essentially makes it behave like an optional output (in other words, the layer is created anyway, but if you leave the text box empty, it will be saved to a temporary file and deleted once you exit QGIS).
Configurar el entorno de trabajo de procesamiento
Como se ha mencionado, el menú de configuración permite el acceso a un nuevo diálogo donde se puede configurar cómo funcionan los algoritmos. Los parámetros de configuración están estructurados en bloques separados que se pueden seleccionar en la parte izquierda del cuadro de diálogo.
Along with the aforementioned Output folder entry, the General block contains parameters for setting the default rendering style for output layers (that is, layers generated by using algorithms from any of the framework GUI components). Just create the style you want using QGIS, save it to a file, and then enter the path to that file in the settings so the algorithms can use it. Whenever a layer is loaded by SEXTANTE and added to the QGIS canvas, it will be rendered with that style.
Los estilos de renderizado se pueden configurar individualmente para cada algoritmo y cada una de sus salidad. Basta con hacer clic derecho en el nombre del algoritmo en la caja de herramientas y seleccionar Editar estilos de renderizados para salidas. Aparecerá un cuadro de diálogo como el mostrado a continuación.
Figure Processing 15:
Seleccionar el archivo de estilo (.qml) que se desee para cada salida y presionar [Aceptar].
Otras parámetros de configuración se en listan en el grupo General a continuación:
Utilizar nombre de archivo como nombre de capa. El nombre de cada capa resultante creado por un algoritmo se define por el propio algoritmo. En algunos casos, un nombre fijo podría ser utilizado, lo que significa que el mismo nombre de salida será utilizada, no importa que capa de entrada se utiliza. En otros casos, el nombre podría depender del nombre de la capa de entrada o algunos de los parámetros utilizados para ejecutar el algoritmo. Si esta casilla de verificación está marcada, el nombre se toma del nombre de archivo de salida en su lugar. Tenga en cuenta que, si la salida se guarda en un archivo temporal, el nombre de archivo de este suele ser largo y sin sentido, destinada a evitar la colisión con otros nombres de archivos ya existentes.
Utilice sólo objetos espaciales seleccionados. Si se selecciona esta opción, cada vez que se utiliza una capa vectorial como entrada para un algoritmo, sólo se utilizan sus objetos espaciales seleccionados. Si la capa no tiene elementos seleccionadas, se utilizarán todos los objetos.
:Archivo script pre-ejecución y Archivo script post-ejecución. Estos parámetros se refieren a scripts escritos utilizando la funcionalidad de secuencias de comandos de procesamiento, y se explican en la sección de secuencias de comandos de cobertura y la consola.
Aparte del bloque General en el diálogo de configuración, también encontrará un bloque para los proveedores de algoritmo. Cada entrada en este bloque contiene un elemento :guilabel: Activar que se puede utilizar para hacer que algoritmos aparezcan o no en la caja de herramientas. Además, algunos proveedores de algoritmos tienen sus propios elementos de configuración, que explicaremos más adelante en la cobertura de los proveedores de algoritmos particulares.
