.
Integracion GRASS SIG
The GRASS plugin provides access to GRASS GIS databases and functionalities (see GRASS-PROJECT in Referencias bibliográficas y web). This includes visualizing GRASS raster and vector layers, digitizing vector layers, editing vector attributes, creating new vector layers and analysing GRASS 2-D and 3-D data with more than 400 GRASS modules.
In this section, we’ll introduce the plugin functionalities and give some examples of managing and working with GRASS data. The following main features are provided with the toolbar menu when you start the GRASS plugin, as described in section sec_starting_grass:
 Open mapset
 New mapset
 Close mapset
 Add GRASS vector layer
 Add GRASS raster layer
 Create new GRASS vector
 Edit GRASS vector layer
 Open GRASS tools
 Display current GRASS region
 Edit current GRASS region
Iniciar el complemento GRASS
To use GRASS functionalities and/or visualize GRASS vector and raster layers in
QGIS, you must select and load the GRASS plugin with the Plugin Manager.
Therefore, go to the menu Plugins ‣  Manage Plugins, select
  GRASS and click
[OK].
You can now start loading raster and vector layers from an existing GRASS
LOCATION (see section sec_load_grassdata). Or, you can create a new
GRASS LOCATION with QGIS (see section Crear una nueva LOCALIZACIÓN GRASS) and import
some raster and vector data (see section Importar datos dentro de una LOCALIZACIÓN DE GRASS) for further
analysis with the GRASS Toolbox (see section La caja de herramientas GRASS).
Cargar capas ráster y vectorial de GRASS
With the GRASS plugin, you can load vector or raster layers using the appropriate
button on the toolbar menu. As an example, we will use the QGIS Alaska dataset (see
section Datos de ejemplo). It includes a small sample GRASS LOCATION
with three vector layers and one raster elevation map.
- Create a new folder called
grassdata, download the QGIS ‘Alaska’ datasetqgis_sample_data.zipfrom http://download.osgeo.org/qgis/data/ and unzip the file intograssdata. - Start QGIS.
- If not already done in a previous QGIS session, load the GRASS plugin
clicking on Plugins ‣
 Manage Plugins and activate
  GRASS.
The GRASS toolbar appears in the QGIS main window.
 - In the GRASS toolbar, click the
 Open mapset icon
to bring up the MAPSET wizard.
 - For
Gisdbase, browse and select or enter the path to the newly created foldergrassdata. - You should now be able to select the LOCATION

alaskaand the MAPSET
demo. - Click [OK]. Notice that some previously disabled tools in the GRASS toolbar are now enabled.
- Click on
 Add GRASS raster layer, choose the map name
gtopo30and click [OK]. The elevation layer will be visualized. - Click on
 Add GRASS vector layer, choose the map name
alaskaand click [OK]. The Alaska boundary vector layer will be overlayed on top of thegtopo30map. You can now adapt the layer properties as described in chapter El Dialogo de las Propiedades del Vector (e.g., change opacity, fill and outline color). - Also load the other two vector layers,
riversandairports, and adapt their properties.
As you see, it is very simple to load GRASS raster and vector layers in QGIS.
See the following sections for editing GRASS data and creating a new LOCATION.
More sample GRASS LOCATIONs are available at the GRASS website at
http://grass.osgeo.org/download/sample-data/.
Truco
Cargando datos GRASS
If you have problems loading data or QGIS terminates abnormally, check to make sure you have loaded the GRASS plugin properly as described in section Iniciar el complemento GRASS.
LOCALIZACIÓN y DIRECTORIO DE MAPA GRASS
GRASS data are stored in a directory referred to as GISDBASE. This directory, often
called grassdata, must be created before you start working with the GRASS
plugin in QGIS. Within this directory, the GRASS GIS data are organized by projects
stored in subdirectories called LOCATIONs. Each LOCATION is defined
by its coordinate system, map projection and geographical boundaries. Each
LOCATION can have several MAPSETs (subdirectories of the
LOCATION) that are used to subdivide the project into different topics or
subregions, or as workspaces for individual team members (see Neteler & Mitasova
2008 in Referencias bibliográficas y web). In order to analyze vector and raster layers
with GRASS modules, you must import them into a GRASS LOCATION. (This is
not strictly true – with the GRASS modules r.external and v.external
you can create read-only links to external GDAL/OGR-supported datasets without
importing them. But because this is not the usual way for beginners to work with
GRASS, this functionality will not be described here.)
Figure GRASS location 1:
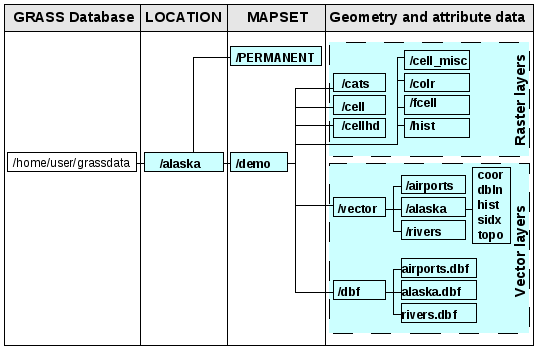
Datos GRASS en la LOCALIZACIÓN alaska
Crear una nueva LOCALIZACIÓN GRASS
As an example, here is how the sample GRASS LOCATION alaska, which is
projected in Albers Equal Area projection with unit feet was created for the
QGIS sample dataset. This sample GRASS LOCATION alaska will be used for
all examples and exercises in the following GRASS-related sections. It is
useful to download and install the dataset on your computer (see Datos de ejemplo).
- Start QGIS and make sure the GRASS plugin is loaded.
- Visualize the
alaska.shpshapefile (see section Loading a Shapefile) from the QGIS Alaska dataset (see Datos de ejemplo). - In the GRASS toolbar, click on the
 New mapset icon
to bring up the MAPSET wizard.
 Seleccione un conjunto de datos GRASS existente (GISDBASE) la carpeta
grassdata, o cree una para la nuevaLOCALIZACIÓNutilizando un administrador de archivos en su computadores. A continuación haga clic en [Siguiente].- We can use this wizard to create a new
MAPSETwithin an existingLOCATION(see section Añadir un nuevo DIRECTORIO DE MAPA) or to create a newLOCATIONaltogether. Select Create new
location (see figure_grass_location_2).
 Escriba un nombre para la
LOZALIZACIÓN– usemos ‘alaska’ y haga clic en [Siguiente].- Define the projection by clicking on the radio button
 Projection to enable the projection list.
 - We are using Albers Equal Area Alaska (feet) projection. Since we happen to
know that it is represented by the EPSG ID 2964, we enter it in the search box.
(Note: If you want to repeat this process for another
LOCATIONand projection and haven’t memorized the EPSG ID, click on the CRS Status icon in the lower right-hand corner of the status bar (see
section Trabajar con Proyecciones)).
 En Filtrar, inserte 2964 para seleccionar la proyección.
Clic [Siguiente].
- To define the default region, we have to enter the
LOCATIONbounds in the north, south, east, and west directions. Here, we simply click on the button [Set current |qg| extent], to apply the extent of the loaded layeralaska.shpas the GRASS default region extent. Clic [Siguiente].
También necesitamos definir un
DIRECTORIO DE MAPAdentro de nuestra nuevaLOCALIZACIÓN(esto es necesario al crear una nuevaLOCALIZACIÓN). Puede nombrarlo como quiera - nosotros usamos ‘demo’. GRASS automáticamente crea unDIRECTORIO DE MAPAespecial llamadoPERMANENT, designado para almacenar los datos base para la proyección, su extensión espacial por defecto y sistema de coordenadas definida (vea Neteler & Mitasova 2008 en Referencias bibliográficas y web)Revise el resumen para asegurarse que es correcto y haga clic en [Finalizar]
La nueva
LOCALIZACIÓN, ‘alaska’, y los dosDIRECTORIO DE MAPAS, ‘demo’ y ‘PERMANENT’, son creados. El conjunto de trabajo abierto actualmente es ‘demo’, como se ha definido.Tenga en cuenta que algunas de las herramientas en la barra de herramientas de GRASS que estaban inhabilitadas ahora están habilitadas.
Figure GRASS location 2:
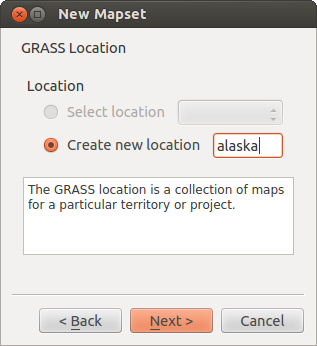
Creating a new GRASS LOCATION or a new MAPSET in QGIS
If that seemed like a lot of steps, it’s really not all that bad and a very quick
way to create a LOCATION. The LOCATION ‘alaska’ is now ready for
data import (see section Importar datos dentro de una LOCALIZACIÓN DE GRASS). You can also use the already-existing
vector and raster data in the sample GRASS LOCATION ‘alaska’,
included in the QGIS ‘Alaska’ dataset Datos de ejemplo, and move on to
section El modelo de datos vectoriales de GRASS.
Añadir un nuevo DIRECTORIO DE MAPA
A user has write access only to a GRASS MAPSET he or she created. This means that
besides access to your own MAPSET, you can read maps in other users’
MAPSETs (and they can read yours), but you can modify or remove only the maps in your own MAPSET.
Todos los DIRECTORIO DE MAPAS incluyen un archivo WIND que almacena los valores de las coordenadas de los límites actuales y la resolución ráster actualmente seleccionado (vea Neteler & Mitasova 2008 en Referencias bibliográficas y web, y la sección La herramienta de región GRASS).
- Start QGIS and make sure the GRASS plugin is loaded.
- In the GRASS toolbar, click on the
 New mapset icon
to bring up the MAPSET wizard.
 Seleccione la base de datos GRASS (GISDBASE) la carpeta
grassdatacon laLOCALIZACIÓN‘alaska’, donde queremos añadir otroDIRECTORIO DE MAPAllamado ‘test’.Clic [Siguiente].
- We can use this wizard to create a new
MAPSETwithin an existingLOCATIONor to create a newLOCATIONaltogether. Click on the radio button Select location
(see figure_grass_location_2) and click [Next].
 Introduzca el nombre
textpara el nuevoDIRECTORIO DE MAPA. A continuación en el asistente, se ve una lista de un existenteDIRECTORIO DE MAPASy titulares correspondientes.Haga clic en [Siguiente], valide el resumen para asegurarse que todo es correcto y haga clic en [Finalizar]
Importar datos dentro de una LOCALIZACIÓN DE GRASS
This section gives an example of how to import raster and vector data into the
‘alaska’ GRASS LOCATION provided by the QGIS ‘Alaska’ dataset.
Therefore, we use the landcover raster map landcover.img and the vector GML
file lakes.gml from the QGIS ‘Alaska’ dataset (see Datos de ejemplo).
- Start QGIS and make sure the GRASS plugin is loaded.
- In the GRASS toolbar, click the
 Open MAPSET icon
to bring up the MAPSET wizard.
 - Select as GRASS database the folder
grassdatain the QGIS Alaska dataset, asLOCATION‘alaska’, asMAPSET‘demo’ and click [OK]. - Now click the
 Open GRASS tools icon. The
GRASS Toolbox (see section La caja de herramientas GRASS) dialog appears.
 Para importar el mapa ráster
landcover.img, haga clic en el modulor.in.gdalen la pestaña Árbol de módulos. Este modulo GRASS le permite importar archivos ráster GDAL-admitidos en unLOCALIZACIÓNde GRASS. El diálogo del módulo para quer.in.gdalaparezca.- Browse to the folder
rasterin the QGIS ‘Alaska’ dataset and select the filelandcover.img. Como nombre de salida del ráster, defina
landcover_grassy haga clic en [Ejecutar]. en la pestaña Salida, y vea el comando GRASS actualmente ejecutador.in.gdal -o input=/path/to/landcover.img output=landcover_grass.- When it says Succesfully finished, click [View output].
The
landcover_grassraster layer is now imported into GRASS and will be visualized in the QGIS canvas. Para importar el archivo vector GML
lakes.gml, haga clic en el modulov.in.ogren la pestaña Árbol de módulos. Este modulo GRASS le permite importar archivos vectoriales OGR-admitidos en unaLOCAZACIÓNde GRASS. El diálogo del modulo para quev.in.ograparezca.- Browse to the folder
gmlin the QGIS ‘Alaska’ dataset and select the filelakes.gmlas OGR file. Como nombre de salida del vector, define
lakes_grassy haga clic en [Ejecutar]. No tiene que preocuparse por las otras opciones en este ejemplo. En la pestaña Salida se ve el comando GRASS ejecutado actualmentev.in.ogr -o dsn=/path/to/lakes.gml output=lakes\_grass.- When it says Succesfully finished, click [View output]. The
lakes_grassvector layer is now imported into GRASS and will be visualized in the QGIS canvas.
El modelo de datos vectoriales de GRASS
It is important to understand the GRASS vector data model prior to digitizing.
In general, GRASS uses a topological vector model.
This means that areas are not represented as closed polygons, but by one or more boundaries. A boundary between two adjacent areas is digitized only once, and it is shared by both areas. Boundaries must be connected and closed without gaps. An area is identified (and labeled) by the centroid of the area.
Además de los límites y centroides, un mapa vectorial también puede contener puntos y líneas. Todos estos elementos geométricos se pueden mezclar en una vector y serán representados en diferentes denominadas ‘capas’ dentro de un mapa vectorial GRASS. Por lo que en GRASS, una capa no es un mapa vectorial o ráster pero un nivel dentro de una capa vectorial. Esto es importante para distinguir cuidadosamente. (aunque es imposible mezclar elementos, es inusual e incluso en GRASS, sólo se utiliza en casos especiales como análisis de redes vectoriales. Usualmente, se debe preferir almacenar diferentes elementos geométricos en diferentes capas.)
Es posible almacenar varias ‘capas’ en un conjunto de datos vectoriales. Por ejemplo, campos, bosques y lagos se pueden almacenar en un vector. Un bosque y lago adyacente pueden compartir el mismo límite, pero tienen tablas de atributos separados. También es posible adjuntar atributos a límites. Un ejemplo podría ser el caso donde los límites entre un lago y un bosque es una carretera, por lo que puede tener una tabla de atributos diferente.
La ‘capa’ del objeto espacial es definido por la ‘capa’ dentro de GRASS. ‘Capa’ es el número que define si hay más de una capa dentro del conjunto de datos (por ejemplo, si la geometría es bosque o lago). Por ahora, sólo puede ser un número. En el futuro, GRASS también implementara nombres como campos en la interfaz de usuario.
Attributes can be stored inside the GRASS LOCATION as dBase or SQLite3 or
in external database tables, for example, PostgreSQL, MySQL, Oracle, etc.
Los atributos en la tabla de base de datos están enlazadas a los elementos geométricos utilizando un valor ‘categoría’.
‘Categoría’ (llave, ID) es un entero adjunto a la geometría primitiva, y se utiliza como el enlace a una columna llave en la tabla de base de datos.
Truco
Aprendizaje del modelo vectorial GRASS
La mejor forma de aprender el modelo vectorial GRASS y sus capacidades es descargar uno de los muchos tutoriales de GRASS donde el modelo vectorial se describe más profundo. Vea http://grass.osgeo.org/documentation/manuals/ para más información, libros y tutoriales en varios idiomas.
Crear una nueva capa vectorial GRASS
To create a new GRASS vector layer with the GRASS plugin, click the
 Create new GRASS vector toolbar icon.
Enter a name in the text box, and you can start digitizing point, line or polygon
geometries following the procedure described in section Digitalizar y editar una capa vectorial GRASS.
In GRASS, it is possible to organize all sorts of geometry types (point, line and area) in one layer, because GRASS uses a topological vector model, so you don’t need to select the geometry type when creating a new GRASS vector. This is different from shapefile creation with QGIS, because shapefiles use the Simple Feature vector model (see section Crear nueva capa vectorial).
Truco
Creating an attribute table for a new GRASS vector layer
If you want to assign attributes to your digitized geometry features, make sure to create an attribute table with columns before you start digitizing (see figure_grass_digitizing_5).
Digitalizar y editar una capa vectorial GRASS
The digitizing tools for GRASS vector layers are accessed using the
 Edit GRASS vector layer icon on the toolbar. Make sure you
have loaded a GRASS vector and it is the selected layer in the legend before
clicking on the edit tool. Figure figure_grass_digitizing_2 shows the GRASS
edit dialog that is displayed when you click on the edit tool. The tools and
settings are discussed in the following sections.
Truco
Digitalizando polígonos en GRASS
If you want to create a polygon in GRASS, you first digitize the boundary of the polygon, setting the mode to ‘No category’. Then you add a centroid (label point) into the closed boundary, setting the mode to ‘Next not used’. The reason for this is that a topological vector model links the attribute information of a polygon always to the centroid and not to the boundary.
Barra de herramientas
In figure_grass_digitizing_1, you see the GRASS digitizing toolbar icons provided by the GRASS plugin. Table table_grass_digitizing_1 explains the available functionalities.
Figure GRASS digitizing 1:

GRASS Digitizing Toolbar
Tabla de digitalización GRASS 1: Herramientas de digitalización GRASS
Category Tab
The Category tab allows you to define the way in which the category values will be assigned to a new geometry element.
Figure GRASS digitizing 2:
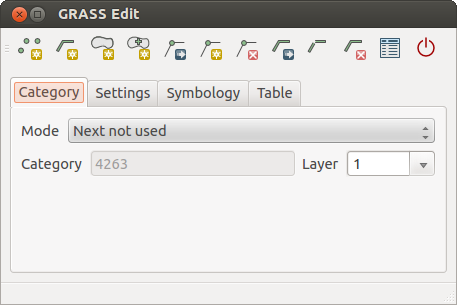
GRASS Digitizing Category Tab
- Mode: The category value that will be applied to new geometry elements.
- Next not used - Apply next not yet used category value to geometry element.
- Manual entry - Manually define the category value for the geometry element in the ‘Category’ entry field.
- No category - Do not apply a category value to the geometry element. This is used, for instance, for area boundaries, because the category values are connected via the centroid.
- Category - The number (ID) that is attached to each digitized geometry element. It is used to connect each geometry element with its attributes.
- Field (layer) - Each geometry element can be connected with several attribute tables using different GRASS geometry layers. The default layer number is 1.
Truco
Creating an additional GRASS ‘layer’ with |qg|
If you would like to add more layers to your dataset, just add a new number in the ‘Field (layer)’ entry box and press return. In the Table tab, you can create your new table connected to your new layer.
Settings Tab
The Settings tab allows you to set the snapping in screen pixels. The threshold defines at what distance new points or line ends are snapped to existing nodes. This helps to prevent gaps or dangles between boundaries. The default is set to 10 pixels.
Figure GRASS digitizing 3:
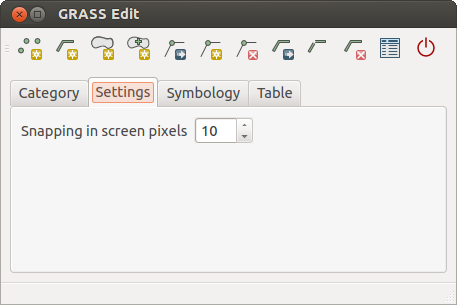
GRASS Digitizing Settings Tab
Symbology Tab
The Symbology tab allows you to view and set symbology and color settings for various geometry types and their topological status (e.g., closed / opened boundary).
Figure GRASS digitizing 4:
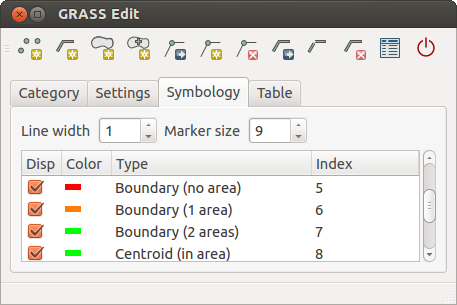
GRASS Digitizing Symbology Tab
Table Tab
The Table tab provides information about the database table for a given ‘layer’. Here, you can add new columns to an existing attribute table, or create a new database table for a new GRASS vector layer (see section Crear una nueva capa vectorial GRASS).
Figure GRASS digitizing 5:

GRASS Digitizing Table Tab
Truco
Editar permisos de GRASS
Debe ser el propietario del DIRECTORIO DE MAPA de GRASS que desee editar. Es imposible editar capas de datos en un DIRECTORIO DE MAPA que no sea suyo, incluso si tiene permisos de escritura.
La herramienta de región GRASS
La definición de la región (ajuste una ventana de trabajo espacial) en GRASS es importante para trabajar con capas ráster. Análisis vectorial esta por defecto no limitado a cualquier definición de región definida. Pero todas los rásters recién creados tendrán la extensión espacial y resolución de la región GRASS definida actualmente, independientemente de su extensión y resolución original. La región GRASS actual es almacenada en el archivo $LOCALIZACIÓN/$DIRECTORIO DE MAPA/WIND, y define los límites norte, sur, este y oeste, número de columnas y filas, resolución espacial horizontal y vertical.
It is possible to switch on and off the visualization of the GRASS region in the QGIS
canvas using the  Display current GRASS region button.
With the  Edit current GRASS region icon, you can open
a dialog to change the current region and the symbology of the GRASS region
rectangle in the QGIS canvas. Type in the new region bounds and resolution, and
click [OK]. The dialog also allows you to select a new region interactively with your
mouse on the QGIS canvas. Therefore, click with the left mouse button in the QGIS
canvas, open a rectangle, close it using the left mouse button again and click
[OK].
El modulo GRASS g.region proporciona muchos más parámetros para definir una extensión de región apropiada y resolución para su análisis ráster. Se puede utilizar estos parámetros con la caja de herramientas GRASS, descrito en la sección La caja de herramientas GRASS.
La caja de herramientas GRASS
The  Open GRASS Tools box provides GRASS module functionalities
to work with data inside a selected GRASS
 LOCATION and MAPSET.
To use the GRASS Toolbox you need to open a LOCATION and MAPSET
that you have write permission for (usually granted, if you created the MAPSET).
This is necessary, because new raster or vector layers created during analysis
need to be written to the currently selected LOCATION and MAPSET.
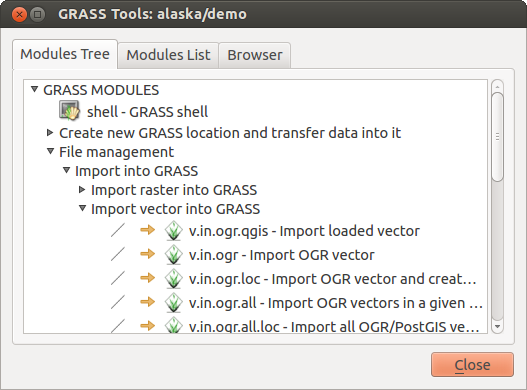
Figure GRASS Toolbox 1:
Trabajando con módulos GRASS
La consola GRASS dentro de la caja de herramientas proporciona acceso a casi todo (más de 300) los módulos GRASS en una interfaz de línea de comando. Para ofrecer un entorno de trabajo más fácil de usar, cerca de 200 de los módulos de GRASS disponibles y funcionalidades también son proporcionados por diálogos gráficos dentro de la caja de herramientas del complemento GRASS.
A complete list of GRASS modules available in the graphical Toolbox in QGIS version 2.8 is available in the GRASS wiki at http://grass.osgeo.org/wiki/GRASS-QGIS_relevant_module_list.
También es posible personalizar el contenido de la caja de herramientas GRASS. Este procedimiento se describe en la sección Personalizar la caja de herramientas GRASS.
Como se muestra en figure_grass_toolbox_1, puede buscar el modulo GRASS apropiado utilizando las temáticas agrupadas Árbol de módulos o en la pestaña de búsqueda Lista de módulos.
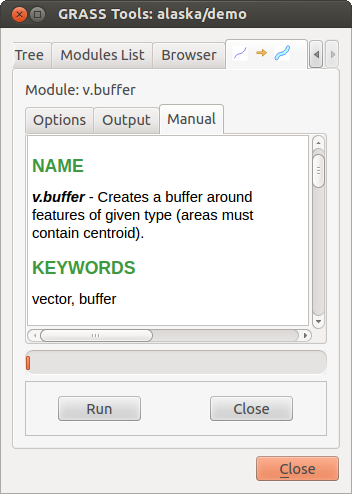
Al hacer clic en un icono de modulo gráfico, una nueva pestaña se añadirá al diálogo de Caja de herramientas, proporciona tres nuevas sub-pestañas Opciones, Salida y Manual.
Opciones
The Options tab provides a simplified module dialog where you can usually select a raster or vector layer visualized in the QGIS canvas and enter further module-specific parameters to run the module.
Figure GRASS module 1:
The provided module parameters are often not complete to keep the dialog clear. If you want to use further module parameters and flags, you need to start the GRASS shell and run the module in the command line.
A new feature since QGIS 1.8 is the support for a Show Advanced Options
button below the simplified module dialog in the Options tab. At the
moment, it is only added to the module v.in.ascii as an example of use, but it will
probably be part of more or all modules in the GRASS Toolbox in future versions
of QGIS. This allows you to use the complete GRASS module options without the need
to switch to the GRASS shell.
Salida
Figure GRASS module 2:
La pestaña Salida proporciona información acerca del estado de salida del módulo. Cuando haga clic en botón [Ejecutar], el módulo cambia a la pestaña de Salida y verá información acerca del proceso de análisis. Si todo funciona bien finalmente verá un mensaje Finalizado con éxito
Manual
Figure GRASS module 3:
La pestaña Manual muestra la página de ayuda HTML del modulo GRASS. Se puede utilizar para comprobar otros parámetros de los módulos y las banderas o para obtener un conocimiento más profundo acerca de la finalidad del módulo. Al final de cada página del manual del módulo, se ven otros enlaces al Índice de ayuda principal, al Índice temático y al Índice completo. Estos enlaces proporcionar información de ejemplo como el modulo g.manual.
Truco
Mostrar resultados inmediatamente
Si desea mostrar sus resultados de cálculo inmediatamente en su lienzo de mapa, se puede utilizar el botón ‘Ver Salida’ en la parte inferior de la pestaña de módulo.
Ejemplos del módulo GRASS
Los siguientes ejemplos demostrarán el poder de algunos módulos GRASS.
Crear curvas de nivel
El primer ejemplo crea un mapa de curvas de nivel vectoriales de un ráster de elevación (DEM). Aquí, se asume que se tiene LOCALIZACIÓN Alaska configurado como se explica en la sección Importar datos dentro de una LOCALIZACIÓN DE GRASS.
- First, open the location by clicking the
 Open mapset button and choosing the Alaska location.
 - Now load the
gtopo30elevation raster by clicking Add GRASS raster layer and selecting the
gtopo30raster from the demo location. - Now open the Toolbox with the
 Open GRASS tools button.
 En la lista de categorías de herramientas, haga doble clic Ráster ‣ Administración de superficie‣ Generar curvas de nivel vectoriales.
- Now a single click on the tool r.contour will open the tool dialog as
explained above (see Trabajando con módulos GRASS). The
gtopo30raster should appear as the Name of input raster. - Type into the Increment between Contour levels
 the value 100. (This will create contour lines at intervals of 100 meters.)
 Escriba en Nombre de salida del mapa vectorial el nombre
ctour_100.Haga clic en [Ejecutar] para iniciar el proceso. Espere varios momentos hasta que el mensaje
Finalizado con éxitoaparezca en la ventana de salida. A continuación haga clic en [Ver Salida] y [Cerrar].
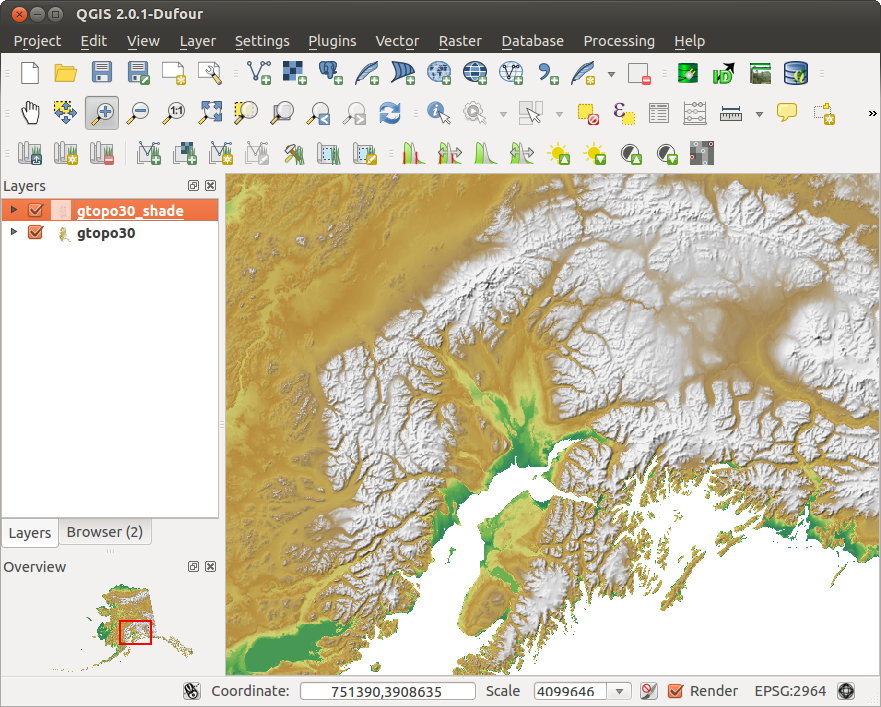
Dado que esta es una región grande, tomará un tiempo para mostrarla. Después de que termine la presentación, puede abrir la ventana de propiedades de la capa para cambiar el color de línea así el contorno aparece claramente sobre el ráster de elevación, como en El Dialogo de las Propiedades del Vector.
El siguiente acercamiento a una pequeña y montañosa área en el centro de Alaska. Al acercarse, se puede observar que las curvas de nivel tienen esquinas afiladas. GRASS ofrece la herramienta v.generalize para alterar ligeramente mapas vectoriales, manteniendo su forma general. La herramienta utiliza varios algoritmos diferentes con propósitos diferentes. Algunos de los algoritmos (es decir, Douglas Peucker y Vertex Reduction) simplificar la línea mediante la eliminación de algunos de los vértices. El vector resultante se carga más rápido. Este proceso es útil cuando se tiene un vector muy detallado, pero va a crear un mapa de escala muy pequeña, por lo que el detalle es innecesario.
Truco
La herramienta de simplificar
Note that the QGIS fTools plugin has a Simplify geometries ‣ tool that works just like the GRASS v.generalize Douglas-Peuker algorithm.
Sin embargo, el proposito de este ejemplo es diferente. Las líneas de curvas de nivel creadas por r.contour tiene ángulos agudos que deben ser suavizados. Entre el algoritmo v.generalize hay Chaiken’s, lo que hace precisamente eso (también astillas de Hermite). Tenga en cuenta que estos algoritmos se pueden añadir vértices adicionales al vector, haciendo que se cargue más lentamente
Abra la caja de herramientas GRASS y haga doble clic en las categorías Vectorial ‣ Desarrollar mapa ‣ Generalización,
Compruebe que el vector ‘ctour_100’ aparece como el Nombre del vector de entrada.
De la lista de algoritmos, elija Chaiken’s. Deje todas las otras opciones en su predeterminado y desplasece hacia abajo a la última fila para ingresar en el campo Nombre del mapa vectorial de salida ‘ctour_100_smooth’, y haga clic en [Ejecutar].
El proceso toma varios minutos. Una vez que aparece
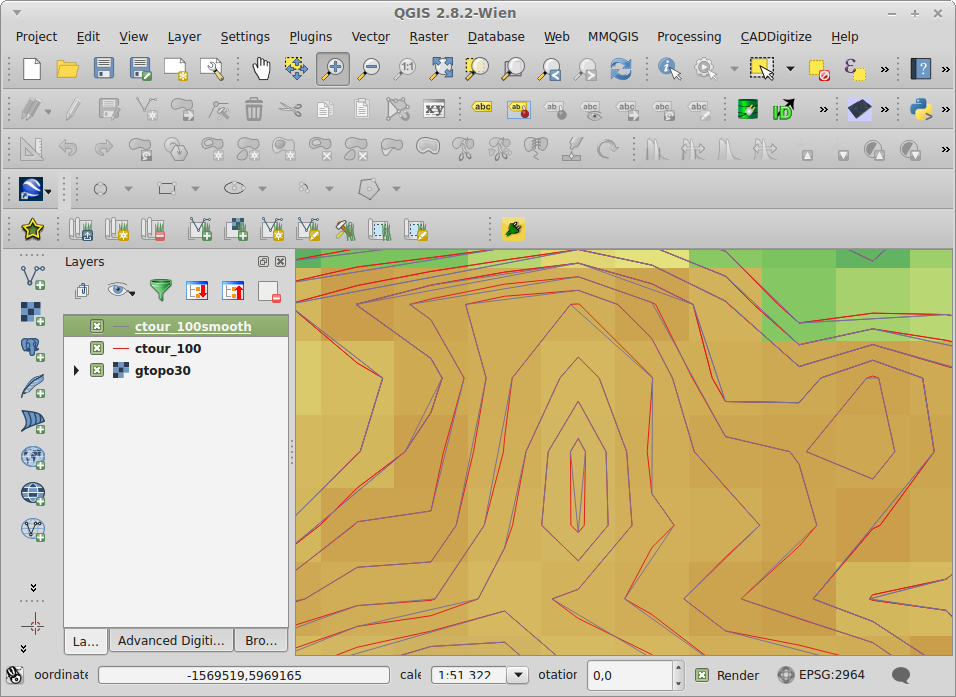
Finalizo con éxitoen la ventana de salida, haga clic [Ver Salida] y a continuación [Cerrar].Se puede cambiar el color del vector para que se muestre claramente sobre el fondo del ráster y para contrastar con las curvas de nivel originales. Se dará cuenta de que las nuevas curvas de nivel tienen esquinas más suaves que el original durante su estancia fiel a la original de forma general.
Figure GRASS module 4:
Truco
Otros usos de r.contour
El proceso descrito anteriormente se puede utilizar en otras situaciones equivalentes. Si tiene un mapa ráster de datos de precipitación, por ejemplo, entonces el mismo método se utilizará para crear un mapa vectorial de líneas isoyetas (lluvia constante).
Crear un efecto sombreado de relieve 3-D
Varios métodos se utilizan para mostrar capas de elevación y da un efecto #-D a mapas. El uso de líneas de curvas de nivel, como se mostro anteriormente, es un método popular regularmente elejido para producir mapas topológicos. El efecto de sombreado se crea de un ráster (elevación) DEM calculando primero la pendiente y el aspecto de cada celda, entonces simula la posición del sol en el cielo y da un valor de reflectancia a cada celda. De este modo se obtienen pendientes frente al sol iluminadas; las pendientes orientadas lejos del sol(en la sombra) se oscurecen.
Comience este ejemplo cargando el ráster de elevación
gtopo30. Inicie la caja de herramientas GRASS y bajo la categoría ráster, haga doble clic para abrir Análisis espacial ‣ Análisis del terreno.A continuación haga clic en r.shaded.relief para abrir el módulo.
- Change the azimuth angle
 270 to 315.
 Ingrese
gtopo30_shadepara el nuevo ráster de mapa de sombras y haga clic en [Ejecutar].Cuando el proceso finalice, añada el ráster de mapa de sombras al mapa. Debe verlo desplegado en escala de grises.
Para ver ambos sombreados y los colores de la gtopo30` juntos, mueva el mapa de sombreado abajo del mapa
gtopo30en la tabla de contenido, a continuación abra la ventana Propiedades degtopo30, cambie a la pestaña de Transparencia y establezca su nivel de transparencia a cerca de 25%.
Ahora debe tener la elevación gtopo30 con su mapa de color y ajuste de transparencia mostrado arriba el mapa de sombras en escala de grises. Con el fin de ver los efectos visuales en el mapa de sombras, apague el mapa gtopo30_shade, a continuación, vuelva a encenderla.
Utilizar la consola de GRASS
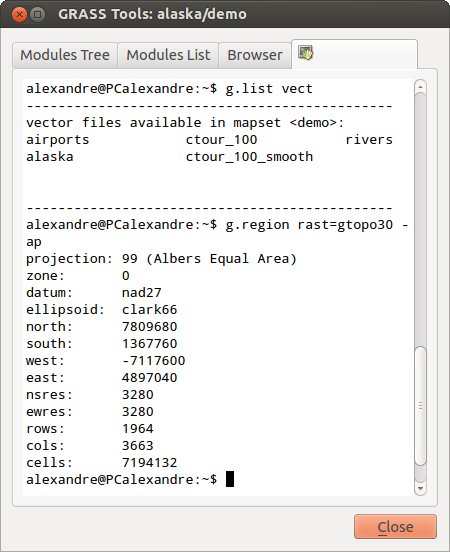
The GRASS plugin in QGIS is designed for users who are new to GRASS and not familiar with all the modules and options. As such, some modules in the Toolbox do not show all the options available, and some modules do not appear at all. The GRASS shell (or console) gives the user access to those additional GRASS modules that do not appear in the Toolbox tree, and also to some additional options to the modules that are in the Toolbox with the simplest default parameters. This example demonstrates the use of an additional option in the r.shaded.relief module that was shown above.
Figure GRASS module 5:
El modulo r.shaded.relief puede tomar un parámetro zmult, que multiplica los valores de elevación relativas a las unidades de las coordenadas X-Y por lo que el efecto de sombreado es incluso más pronunciado.
Cargue el ráster de elevación
gtopo30como antes, a continuación inicie la caja de herramientas GRASS y haga clic en la consola GRASS. En la ventana de la consola, escriba el comandor.shaded.relief map=gtopo30 shade=gtopo30_shade2 azimuth=315 zmult=3y presione [Enter].- After the process finishes, shift to the Browse tab and double-click
on the new
gtopo30_shade2raster to display it in QGIS. Como se explicó anteriormente, mueva ráster del relieve sombreado a bajo del ráster
gtopo30en la tabla de contenido, entonces valide la transparecia de la capa coloreadagtopo30. Debe ver que el efecto 3-D destaca más fuertemente comparada con el primer mapa de relieve sombreado.
Figure GRASS module 6:
Estadísticas de ráster en un mapa vectorial
El siguiente ejemplo muestra como un módulo GRASS puede agregar datos ráster y añadir columnas de una estadística para cada polígono en un mapa vectorial.
De nuevo utilice los datos de Alaska, referirse a Importar datos dentro de una LOCALIZACIÓN DE GRASS para importar los arboles de archivos shape del directorio
shapefilesen GRASS.Ahora un paso intermedio es necesario: los centroides se deben añadir al mapa de árboles importado para que sea una zona de GRASS completa del vector (incluyendo ambos límites y centroides).
De la caja de herramientas, elija Vectorial ‣ Desarrollar mapa -> Administrar objetos espaciales, y abra el modulo v.centroids.
Introduzca como el Mapa vectorial de salida ‘forest_areas’ y ejecute el módulo.
- Now load the
forest_areasvector and display the types of forests - deciduous, evergreen, mixed - in different colors: In the layer Properties window, Symbology tab, choose from Legend type ‘Unique value’ and set the Classification field
to ‘VEGDESC’. (Refer to the explanation of the symbology tab in
Estilo de Menu of the vector section.)
 A continuación vuelva a abrir la caja de herramientas de GRASS y abra Vectorial ‣ Actualizacion vectorial por otros mapas.
Haga clic en el modulo v.rast.stats. Ingrese
gtopo30yforest_areas.Sólo un parámetro más es necesario: Ingrese Prefijo de columna
elev, y haga clic en [Ejecutar]. Este es una operación pesada computacionalmente, que se ejecutará por un largo tiempo (probablemente más de dos horas).Finalmente, abra la tabla de atributos
forest_areas, y verifique que varias de las nuevas columnas se han añadido, incluyendoelev_min,elev_max,elev_mean, etc., para cada polígono de bosque.
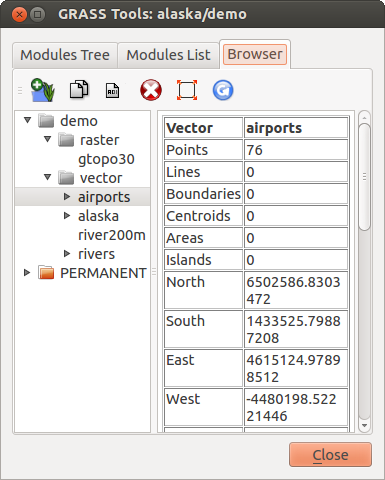
Working with the GRASS LOCATION browser
Another useful feature inside the GRASS Toolbox is the GRASS LOCATION
browser. In figure_grass_module_7, you can see the current working LOCATION
with its MAPSETs.
In the left browser windows, you can browse through all MAPSETs inside the
current LOCATION. The right browser window shows some meta-information
for selected raster or vector layers (e.g., resolution, bounding box, data source,
connected attribute table for vector data, and a command history).
Figure GRASS module 7:
The toolbar inside the Browser tab offers the following tools to manage
the selected LOCATION:
 Add selected map to canvas
 Copy selected map
 Rename selected map
 Delete selected map
 Set current region to selected map
 Refresh browser window
The  Rename selected map and
  Delete selected map only work with maps inside your currently selected
MAPSET. All other tools also work with raster and vector layers in
another MAPSET.
Personalizar la caja de herramientas GRASS
Casi todos los módulos de GRASS se pueden añadir a la caja de herramientas de GRASS. Una interfaz XML se proporciona para analizar los archivos XML muy sencillos que configuran la apariencia y los parámetros de los módulos dentro de la caja de herramientas.
Un ejemplo del archivo XML para generar el módulo v.buffer (v.buffer.qgm) luce como esto:
<?xml version="1.0" encoding="UTF-8"?>
<!DOCTYPE qgisgrassmodule SYSTEM "http://mrcc.com/qgisgrassmodule.dtd">

<qgisgrassmodule label="Vector buffer" module="v.buffer">
        <option key="input" typeoption="type" layeroption="layer" />
        <option key="buffer"/>
        <option key="output" />
</qgisgrassmodule>
The parser reads this definition and creates a new tab inside the Toolbox when you select the module. A more detailed description for adding new modules, changing a module’s group, etc., can be found on the QGIS wiki at http://hub.qgis.org/projects/quantum-gis/wiki/Adding_New_Tools_to_the_GRASS_Toolbox.


