.
Herramientas generales
Teclas de acceso rápido
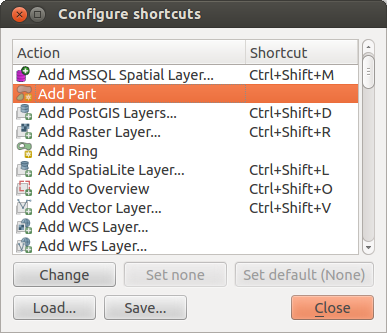
QGIS provides default keyboard shortcuts for many features. You can find them in section Barra de Menú. Additionally, the menu option Settings ‣ Configure Shortcuts.. allows you to change the default keyboard shortcuts and to add new keyboard shortcuts to QGIS features.
Figure Shortcuts 1:
Configuration is very simple. Just select a feature from the list and click on [Change], [Set none] or [Set default]. Once you have finished your configuration, you can save it as an XML file and load it to another QGIS installation.
Ayuda de contexto
Cuando necesite ayuda sobre un tema especifico, puede acceder a la ayuda de contexto mediante el botón [Ayuda] disponible en la mayoría de diálogos – tenga en cuenta que los complementos de terceros pueden apuntar a paginas web dedicadas.
Renderizado
By default, QGIS renders all visible layers whenever the map canvas is refreshed. The events that trigger a refresh of the map canvas include:
Añadir una capa
Desplazar o hacer zoom
- Resizing the QGIS window
Cambiar la visibilidad de una o varias capas
QGIS allows you to control the rendering process in a number of ways.
Renderizado dependiente de la escala
El renderizado dependiente de la escala le permite especificar las escalas mínima y máxima a las que una capa será visible. Para establecer el renderizado dependiente de la escala, abra el diálogo Propiedades mediante doble clic en una capa en el panel Capas. En la pestaña General, haga clic en la casilla  Visibilidad dependiente de la escala para activar la característica, luego establezca los valores mínimo y máximo de escala.
You can determine the scale values by first zooming to the level you want to use and noting the scale value in the QGIS status bar.
Controlar el renderizado del mapa
Map rendering can be controlled in the various ways, as described below.
Suspender el renderizado
To suspend rendering, click the  Render checkbox in the
lower right corner of the status bar. When the
  Render
checkbox is not checked, QGIS does not redraw the canvas in response to any of
the events described in section Renderizado. Examples of when you
might want to suspend rendering include:
Añadir muchas capas y simbolizarlas antes de dibujar
Añadir una o más capas grandes y establecer la dependencia de escala antes de dibujar
Añadir una o más capas grandes y hacer zoom a una vista específica antes de dibujar
Cualquier combinación de la anteriores
Marcar la casilla  Renderizar habilita el renderizado y origina un refresco inmediato del lienzo del mapa.
Configurar la opción de añadir una capa
Puede establecer una opción para cargar siempre las nuevas capas sin dibujarlas. Esto significa que las capas se añadirán al mapa pero su casilla de visibilidad en el panel Capas no estará marcada de forma predeterminada. Para establecer esta opción, seleccione la opción de menú Configuración ‣ Opciones y haga clic en la pestaña Representación. Desmarque la casilla  Por omisión, las nuevas capas añadidas al mapa se deben visualizar. Cualquier capa añadida posteriormente al mapa estará desactivada (invisible) por omisión.
Detener el renderizado
Para detener el dibujado del mapa, presione la tecla ESC. Esto detendrá el refresco del lienzo del mapa y dejará el mapa parcialmente dibujado. Puede que tarde un poco desde que se presiona la tecla ESC hasta que se detenga el dibujado del mapa.
Nota
Actualmente no es posible detener la representación — esto se desactivó en el paso a Qt4 debido a problemas y cuelgues de la Interfaz de Usuario (IU).
Updating the Map Display During Rendering
You can set an option to update the map display as features are drawn. By default, QGIS does not display any features for a layer until the entire layer has been rendered. To update the display as features are read from the datastore, choose menu option Settings ‣ Options and click on the Rendering tab. Set the feature count to an appropriate value to update the display during rendering. Setting a value of 0 disables update during drawing (this is the default). Setting a value too low will result in poor performance, as the map canvas is continually updated during the reading of the features. A suggested value to start with is 500.
Influir en la calidad del renderizado
To influence the rendering quality of the map, you have two options. Choose menu option Settings ‣ Options, click on the Rendering tab and select or deselect following checkboxes:
Acelerar renderizado
There are two settings that allow you to improve rendering speed. Open the QGIS options dialog using Settings ‣ Options, go to the Rendering tab and select or deselect the following checkboxes:
 Enable back buffer. This provides better graphics
performance at the cost of losing the possibility to cancel rendering and
incrementally draw features. If it is unchecked, you can set the
Number of features to draw before updating the display, otherwise
this option is inactive.
 Usar cacheado de representación cuando sea posible para acelerar redibujados
Mediciones
Measuring works within projected coordinate systems (e.g., UTM) and unprojected data. If the loaded map is defined with a geographic coordinate system (latitude/longitude), the results from line or area measurements will be incorrect. To fix this, you need to set an appropriate map coordinate system (see section Trabajar con Proyecciones). All measuring modules also use the snapping settings from the digitizing module. This is useful, if you want to measure along lines or areas in vector layers.
To select a measuring tool, click on  and select the tool you want
to use.
Measure length, areas and angles
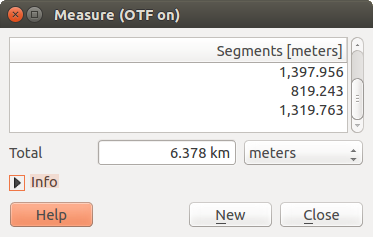
 Measure Line: QGIS is able to measure real distances
between given points according to a defined ellipsoid. To configure this,
choose menu option Settings ‣ Options, click on the
Map tools tab and select the appropriate ellipsoid. There, you can
also define a rubberband color and your preferred measurement units (meters or
feet) and angle units (degrees, radians and gon). The tool then allows you to
click points on the map. Each segment length, as well as the total, shows up in
the measure window. To stop measuring, click your right mouse button.
Note that you can interactively change the measurement units in the measurement
dialog. It overrides the Preferred measurement units in the options.
There is an info section in the dialog that shows which CRS settings are being used
during measurement calculations.
Figure Measure 1:
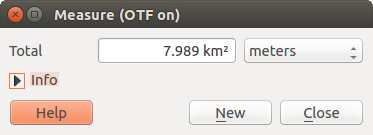
 Measure Area: Areas can also be measured. In the
measure window, the accumulated area size appears. In addition, the measuring
tool will snap to the currently selected layer, provided that layer has its
snapping tolerance set (see section Configurar la tolerancia del autoensamblado y radio de búsqueda). So, if you want
to measure exactly along a line feature, or around a polygon feature, first set
its snapping tolerance, then select the layer. Now, when using the measuring
tools, each mouse click (within the tolerance setting) will snap to that layer.
Figure Measure 2:
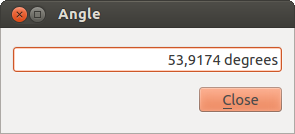
 Measure Angle: You can also measure angles. The
cursor becomes cross-shaped. Click to draw the first segment of the angle you
wish to measure, then move the cursor to draw the desired angle. The measure
is displayed in a pop-up dialog.
Figure Measure 3:
Seleccionar y deseleccionar objetos espaciales
The QGIS toolbar provides several tools to select features in the map canvas.
To select one or several features, just click on  and select your
tool:
 Select Single Feature
 Select Features by Rectangle
 Select Features by Polygon
 Select Features by Freehand
 Select Features by Radius
To deselect all selected features click on  Deselect
features from all layers.
![]() Select feature using an expression allow user
to select feature using expression dialog. See Expressions
chapter for some example.
Select feature using an expression allow user
to select feature using expression dialog. See Expressions
chapter for some example.
Users can save features selection into a New Memory Vector Layer or a New Vector Layer using Edit ‣ Paste Feature as ... and choose the mode you want.
Identificar objetos espaciales
The Identify tool allows you to interact with the map canvas and get information on features
in a pop-up window. To identify features, use View ‣ Identify
features or press Ctrl + Shift + I, or click on the  Identify features icon in the toolbar.
If you click on several features, the Identify results dialog will list information about all the selected features. The first item is the number of the layer in the list of results, followed by the layer name. Then, its first child will be the name of a field with its value. The first field is the one selected in Properties ‣ Display. Finally, all information about the feature is displayed.
Esta ventana puede ser personalizada para mostrar campos personalizados, pero por omisión mostrará tres tipos de información:
- Actions: Actions can be added to the identify feature windows. When clicking on the action label, action will be run. By default, only one action is added, to view feature form for editing.
- Derived: This information is calculated or derived from other information. You can find clicked coordinate, X and Y coordinates, area in map units and perimeter in map units for polygons, length in map units for lines and feature ids.
- Data attributes: This is the list of attribute fields from the data.
Figure Identify 1:
At the top of the window, you have five icons:
At the bottom of the window, you have the Mode and View comboboxes. With the Mode combobox you can define the identify mode: ‘Current layer’, ‘Top down, stop at first’, ‘Top down’ and ‘Layer selection’. The View can be set as ‘Tree’, ‘Table’ and ‘Graph’.
The identify tool allows you to auto open a form. In this mode you can change the feautures attributes.
Otras funciones se pueden encontrar en el menú contextual del elemento identificado. Por ejemplo, del menú contextual se puede:
Ver el formulario del objeto espacial
Zum a objeto espacial
Copiar objeto espacial: Copiar toda la geometría y atributos del objeto espacial
- Toggle feature selection: adds identified feature to selection
Copiar el valor del atributo: copiar solo el valor del atributo sobre el cual se hizo clic
- Copy feature attributes: Copy only attributes
Limpiar resultados: quitar resultados de la ventana
Limpiar resaltados: Deseleccionar los objetos espaciales en el mapa
Resaltar todo
Resaltar capa
Activar capa: Elegir una capa para ser activada
Propiedades de la capa: Abrir la ventana de propiedades de la capa.
Expandir todo
Colapsar todo
Elementos decorativos
The Decorations of QGIS include the Grid, the Copyright Label, the North Arrow and the Scale Bar. They are used to ‘decorate’ the map by adding cartographic elements.
Cuadrícula
 Cuadrícula permite agregar una rejilla de coordenadas y anotaciones a la vista del mapa.
Figure Decorations 1:
Seleccione en el menú Ver ‣ Ilustraciones‣ Cuadrícula. Aparece el díálogo (ver figure_decorations_1).
Activar la casilla
 Activar cuadrícula y establecer la definición de la cuadrícula de acuerdo con las capas cargadas en la vista del mapa.
Activar la casilla
 Dibujar anotaciones y establecer la definición de las anotaciones de acuerdo con las capas cargadas en la vista del mapa.
- Click [Apply] to verify that it looks as expected.
- Click [OK] to close the dialog.
Etiqueta de derechos de autor
 Copyright label adds a copyright label using the text
you prefer to the map.
Figure Decorations 2:
Seleccione en el menú Ver ‣ Ilustraciones‣ Etiqueta de Copyright. Aparece el díálogo (ver figure_decorations_2).
Escribir el texto que se quiera colocar en el mapa. Se puede usar HTML como se muestra en el ejemplo.
- Choose the placement of the label from the Placement
 combo box.
 Comprobar que la casilla de verificación
 Activar etiqueta de copyright este marcada.
- Click [OK].
In the example above, which is the default, QGIS places a copyright symbol followed by the date in the lower right-hand corner of the map canvas.
Flecha del Norte
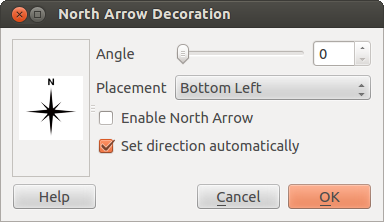
 North Arrow places a simple north arrow on the map canvas.
At present, there is only one style available. You can adjust the angle of the
arrow or let QGIS set the direction automatically. If you choose to let QGIS
determine the direction, it makes its best guess as to how the arrow should be
oriented. For placement of the arrow, you have four options, corresponding to
the four corners of the map canvas.
Figure Decorations 3:
Barra de escala
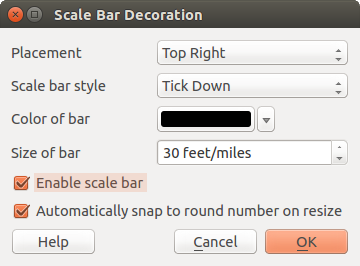
 Scale Bar adds a simple scale bar to the map canvas. You
can control the style and placement, as well as the labeling of the bar.
Figure Decorations 4:
QGIS only supports displaying the scale in the same units as your map frame. So if the units of your layers are in meters, you can’t create a scale bar in feet. Likewise, if you are using decimal degrees, you can’t create a scale bar to display distance in meters.
Para añadir una barra de escala:
Seleccionar del menú Ver ‣ Ilustraciones ‣ Barra de escala. Se iniciará el diálogo (ver figure_decorations_4).
- Choose the placement from the Placement
 combo box.
 - Choose the style from the Scale bar style
 combo box.
 - Select the color for the bar Color of bar
 or use
the default black color.
 - Set the size of the bar and its label Size of bar
 .
. Comprobar que la casilla de verificación
 Habilitar barra de escala esté marcada.
- Optionally, check
 Automatically snap to round number
on resize.
 - Click [OK].
Truco
Configuración de elementos decorativos
Al guardar un proyecto .qgs, cualquiera de los cambios que se hayan hecho a la cuadrícula, flecha de norte, barra de escala y copyright se guardarán en el proyecto y se restaurán la próxima vez que cargue el proyecto.
Herramientas de anotaciones
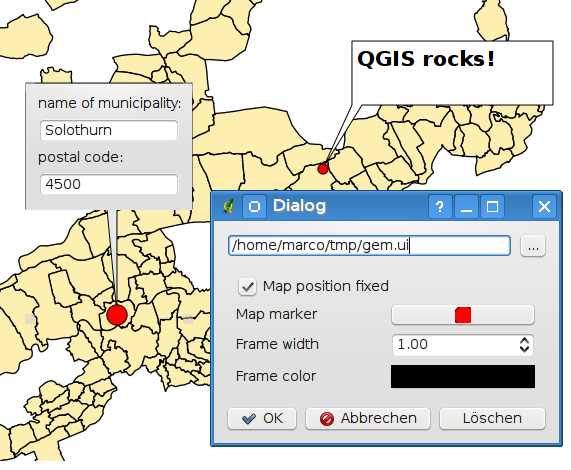
The  Text Annotation tool in the attribute
toolbar provides the possibility to place formatted text in a balloon on the
QGIS map canvas. Use the Text Annotation tool and click into the
map canvas.
Figure annotation 1:
Haciendo doble clic sobre el elemento se abre un cuadro de diálogo con varias opciones. Hay un editor de texto para escribir el texto con formato y otros ajustes de elementos. Por ejemplo, existe la opción de tener el elemento colocado en una posición del mapa (mostrado por el símbolo del marcador) o tener el elemento en una posición de la pantalla (no relacionado con el mapa). El elemento se puede mover por la posición del mapa (al arrastrar el marcador del mapa) o moviendo solo el globo. Los iconos son parte del tema de los SIG, y se utilizan de forma predeterminada en otros temas también.
The  Move Annotation tool allows you to move the
annotation on the map canvas.
Anotaciones HTML
The  Html Annotation tools in the attribute
toolbar provides the possibility to place the content of an html file in a
balloon on the QGIS map canvas. Using the Html Annotation tool, click
into the map canvas and add the path to the html file into the dialog.
Anotaciones SVG
The  SVG Annotation tool in the attribute toolbar
provides the possibility to place an SVG symbol in a balloon on the QGIS map
canvas. Using the SVG Annotation tool, click into the map canvas and
add the path to the SVG file into the dialog.
Anotaciones de formulario
Additionally, you can also create your own annotation forms. The
 Form Annotation tool is useful to display
attributes of a vector layer in a customized Qt Designer form (see
figure_custom_annotation). This is similar to the designer forms for the
Identify features tool, but displayed in an annotation item.
Also see this video https://www.youtube.com/watch?v=0pDBuSbQ02o from
Tim Sutton for more information.
Figure annotation 2:
Nota
Si presiona Ctrl+T mientras está activa una herramienta Anotación (mover anotación, anotación de texto, anotación de formulario), se invierten los estados de visibilidad de los elementos.
Marcadores espaciales
Spatial Bookmarks allow you to “bookmark” a geographic location and return to it later.
Crear un marcador
Para crear un marcador:
Hacer zoom o desplazarse al área de interés.
- Select the menu option View ‣ New Bookmark or press
Ctrl-B. Introduzca un nombre descriptivo para el marcador (hasta 255 caracteres).
- Press
Enterto add the bookmark or [Delete] to remove the bookmark.
Tenga en cuenta que puede tener múltiples marcadores con el mismo nombre.
Trabajar con marcadores
To use or manage bookmarks, select the menu option View ‣ Show Bookmarks. The Geospatial Bookmarks dialog allows you to zoom to or delete a bookmark. You cannot edit the bookmark name or coordinates.
Zooming to a Bookmark
From the Geospatial Bookmarks dialog, select the desired bookmark by clicking on it, then click [Zoom To]. You can also zoom to a bookmark by double-clicking on it.
Deleting a Bookmark
To delete a bookmark from the Geospatial Bookmarks dialog, click on it, then click [Delete]. Confirm your choice by clicking [Yes], or cancel the delete by clicking [No].
Import or export a bookmark
To share or transfer your bookmarks between computers you can use the Share pull down menu in the Geospatial Bookmarks dialog.
Anidar proyectos
Si se quiere incluir contenido de otros proyectos en un proyecto, se puede elegir Capa ‣ Empotrar capas y grupos.
Empotrar capas
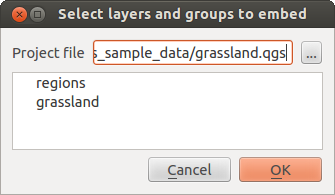
El siguiente cuadro de diálogo le permite incluir capas de otros proyectos. Aquí un pequeño ejemplo:
- Press
 to look for another project from the Alaska dataset.
 - Select the project file
grassland. You can see the content of the project (see figure_embed_dialog). - Press
Ctrland click on the layersgrasslandandregions. Press [OK]. The selected layers are embedded in the map legend and the map view now.
Figure Nesting 1:
Si bien las capas incrustadas son editables, no se pueden cambiar sus propiedades como estilo y etiquetado.
