4.2. Lesson: Labels
Labels kunnen aan een kaart worden toegevoegd om elke soort informatie over een object weer te geven. Elke vectorlaag kan labels met zich geassocieerd hebben. Deze labels zijn afhankelijk van de gegevens voor attributen van een laag voor hun inhoud.
Het doel voor deze les: Nuttige en goed uitziende labels toe kunnen passen op een laag.
4.2.1.  Follow Along: Labels gebruiken
First, ensure that the  button is visible in the GUI:
Go to the menu item
Ensure that the Label Toolbar item has a check mark next to it. If it doesn’t, click on the Label Toolbar item to activate it.
Click on the
placeslayer in the Layers panel so that it is highlightedClick on the
 toolbar button to open the
Labels tab of the Layer Styling panel
toolbar button to open the
Labels tab of the Layer Styling panelSwitch from No Labels to
 Single Labels
You’ll need to choose which field in the attributes will be used for the labels. In the previous lesson, you decided that the
namefield was the most suitable one for this purpose.Select
namefrom the Value list:
Click Apply
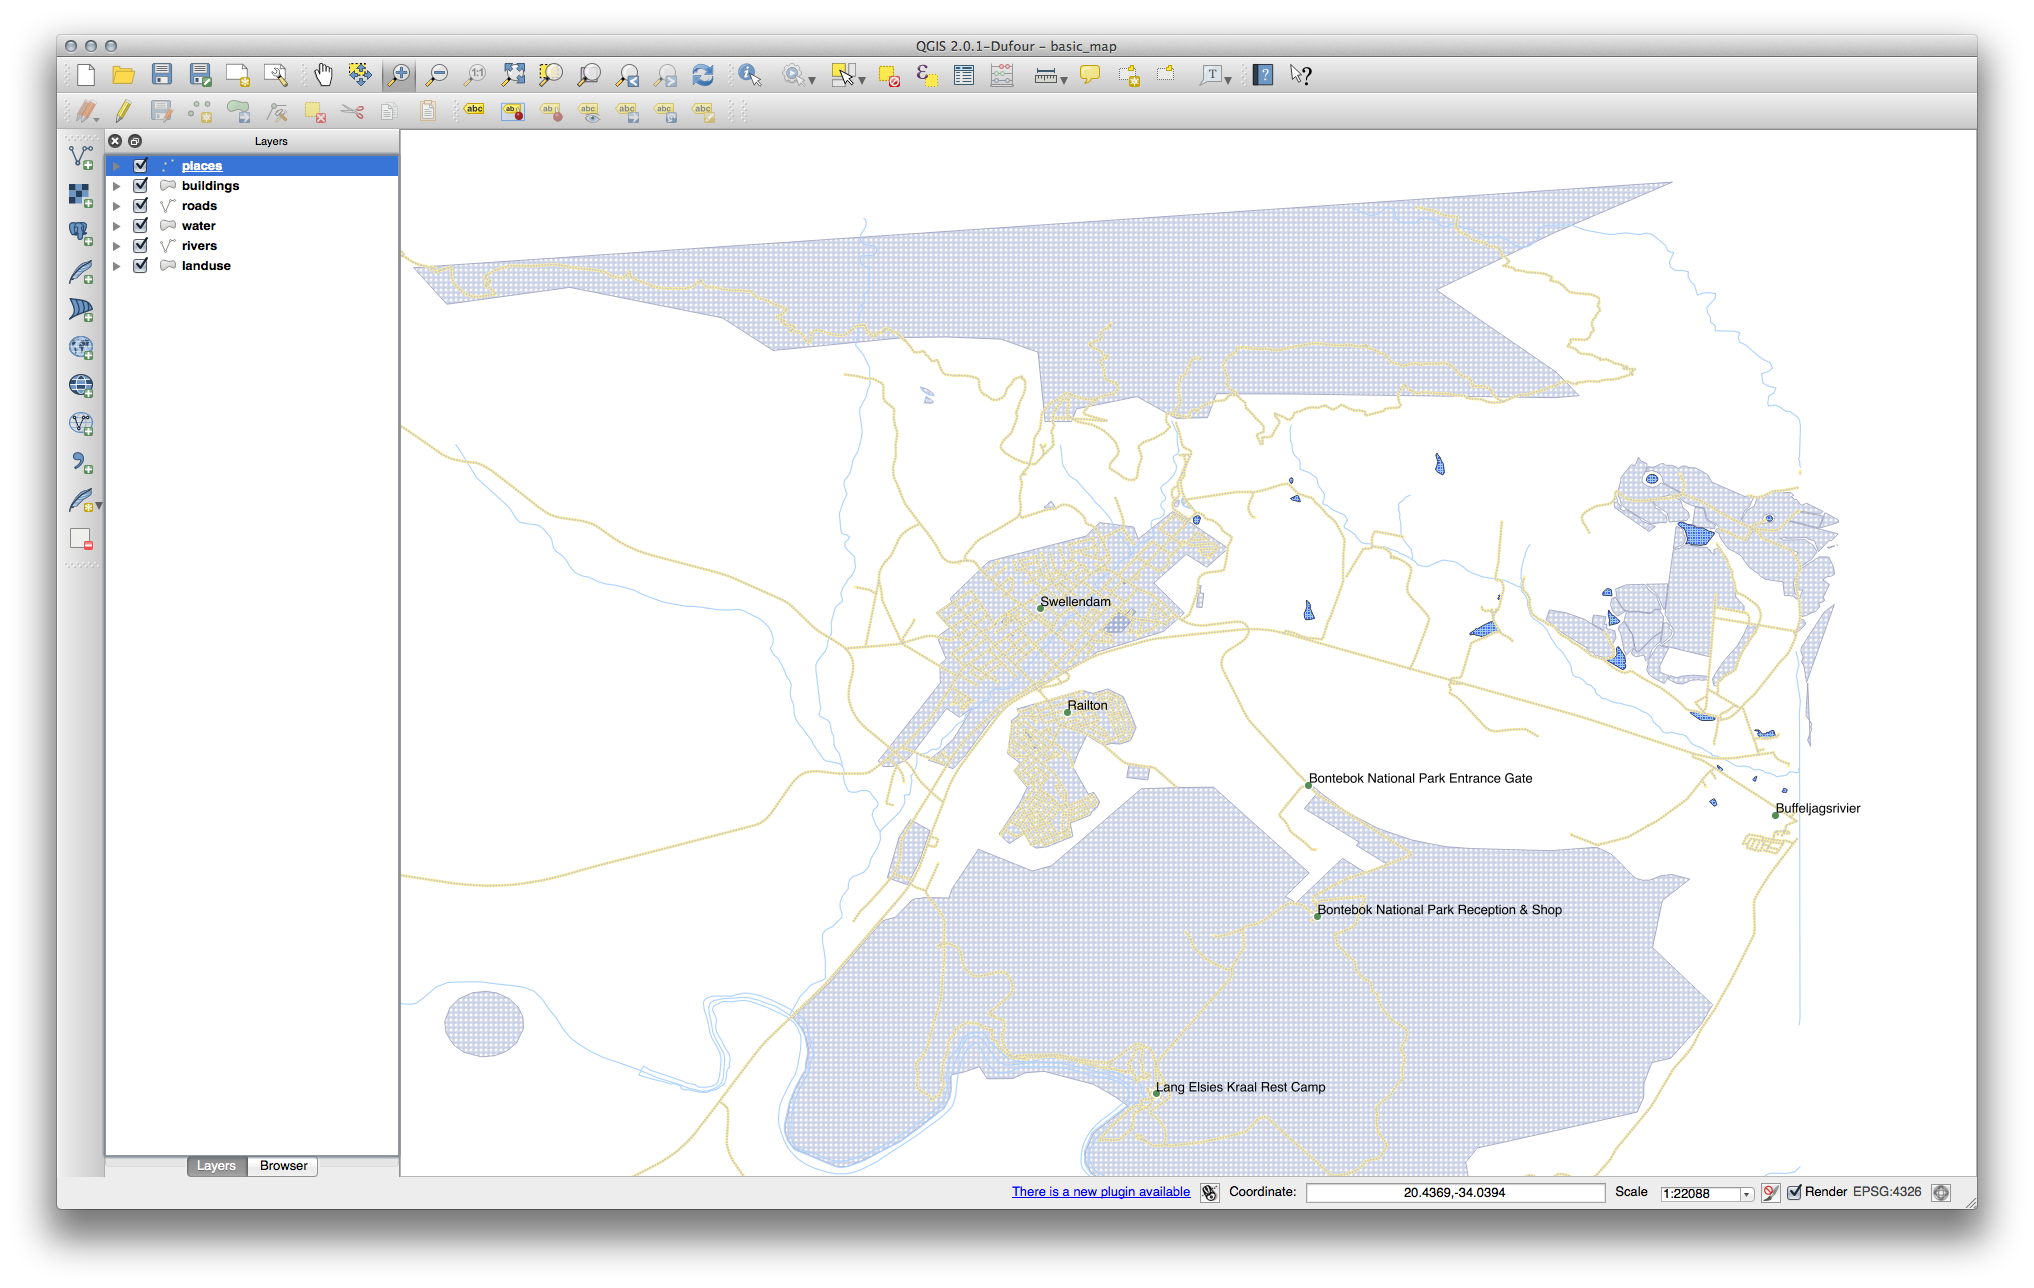
De kaart zou nu labels moeten hebben zoals deze:
4.2.2.  Follow Along: Opties voor labels wijzigen
Depending on the styles you chose for your map in earlier lessons, you might find that the labels are not appropriately formatted and either overlap or are too far away from their point markers.
Notitie
Above, you used the  button in the
Label Toolbar to open the Layer Styling panel. As
with Symbology, the same label options are available via both
the Layer Styling panel and the Layer Properties
dialog. Here, you’ll use the Layer Properties dialog.
Open the Layer Properties dialog by double-clicking on the
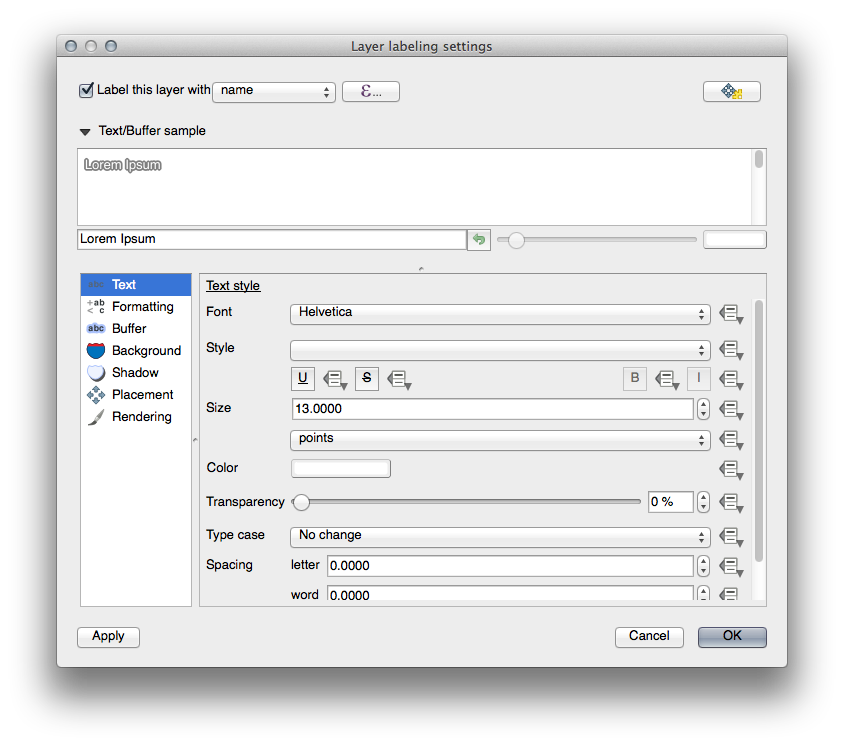
placeslayerZorg er voor dat Tekst is geselecteerd in de lijst met opties aan de linkerkant, werk dan de opties voor tekstopmaak bij zodat die overeenkomen met die welke hier worden weergegeven:
Click Apply
That font may be larger and more familiar to users, but its readability is still dependent on what layers are rendered beneath it. To solve this, let’s take a look at the Buffer option.
Select Buffer from the left-hand options list
Selecteer het keuzevak naast Teken tekstbuffer, en kies dan de opties, zodat die overeenkomen met die welke hier worden weergegeven:

Click Apply
U zult zien dat dit een gekleurde buffer of rand toevoegt aan de labels met plaatsen, wat het eenvoudiger maakt ze te zien op de kaart:

Nu kunnen we de plaatsing van de labels in relatie tot hun punt markeringen aanpakken.
Select Placement from the left-hand options list
Select Around point and change the value of Distance to
2.0Millimeters:
Click Apply
U zult nu zien dat de labels niet langer hun punt-markeringen overlappen.
4.2.3.  Follow Along: Labels in plaats van symbologie voor lagen gebruiken
In many cases, the location of a point doesn’t need to be very specific. For
example, most of the points in the places layer refer to entire
towns or suburbs, and the specific point associated with such features is not
that specific on a large scale. In fact, giving a point that is too specific is
often confusing for someone reading a map.
Een voorbeeld: op een kaart van de wereld zou het punt dat wordt opgegeven voor de Europese Unie bijvoorbeeld ergens in Polen kunnen liggen. Voor iemand die de kaart leest zou het zien van een punt dat is gelabeld Europese Unie in Polen, zou het kunnen lijken dat de hoofdstad van de Europese Unie daarom in Polen ligt.
Het is vaak nuttig om de symbolen voor punten uit te schakelen en ze compleet te vervangen door labels om dus dit soort misverstanden te voorkomen.
In QGIS kunt u dit doen door de positie van de labels te wijzigen zodat ze direct worden gerenderd over de punten waar zij naar verwijzen.
Open the
 Labels tab of the
Layer Properties dialog for the
 placeslayerSelect the Placement option from the options list
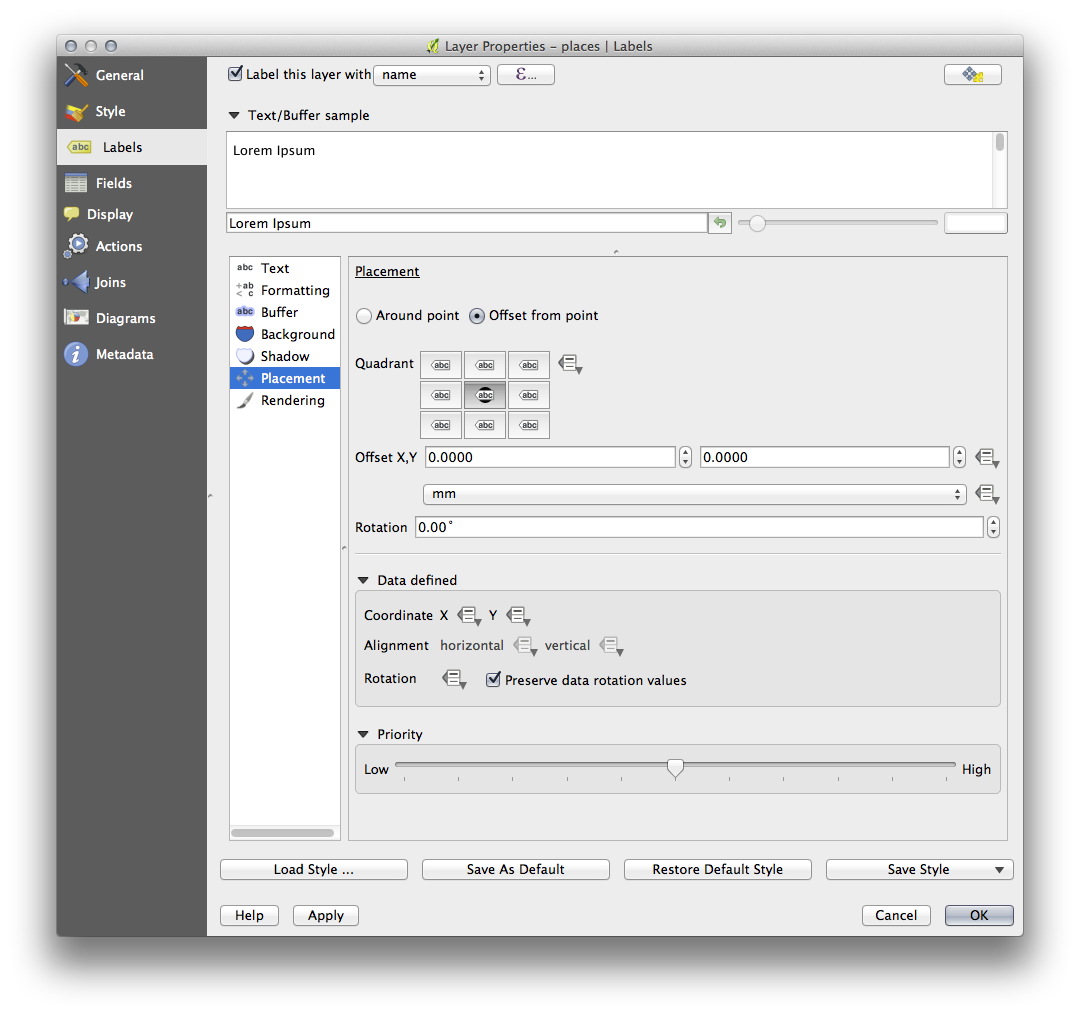
Click on the Offset from point button
Dit zal de opties Kwadrant onthullen die u kunt gebruiken om de positie van het label in relatie tot de punt-markering in te stellen. In dit geval willen we het label centreren op het punt, dus kies het kwadrant in het centrum:
Hide the point symbols by editing the layer Symbology as usual, and setting the size of the Marker size to
0.0:
Click Apply and you’ll see this result:

If you were to zoom out on the map, you would see that some of the labels
disappear at larger scales to avoid overlapping. Sometimes this is what you
want when dealing with datasets that have many points, but at other times
you will lose useful information this way. There is another possibility for
handling cases like this, which we’ll cover in a later exercise in this lesson.
For now, zoom out and click on the  button in the toolbar
and see what happens.
4.2.4.  Try Yourself De labels aanpassen
Reset the label and symbol settings to have a point marker and a label offset of
2.0Millimeters.
Set the map to the scale
1:100000. You can do this by typing it into the Scale box in the Status Bar. Modify your labels to be suitable for viewing at this scale.
4.2.5.  Follow Along: Lijnen labelen
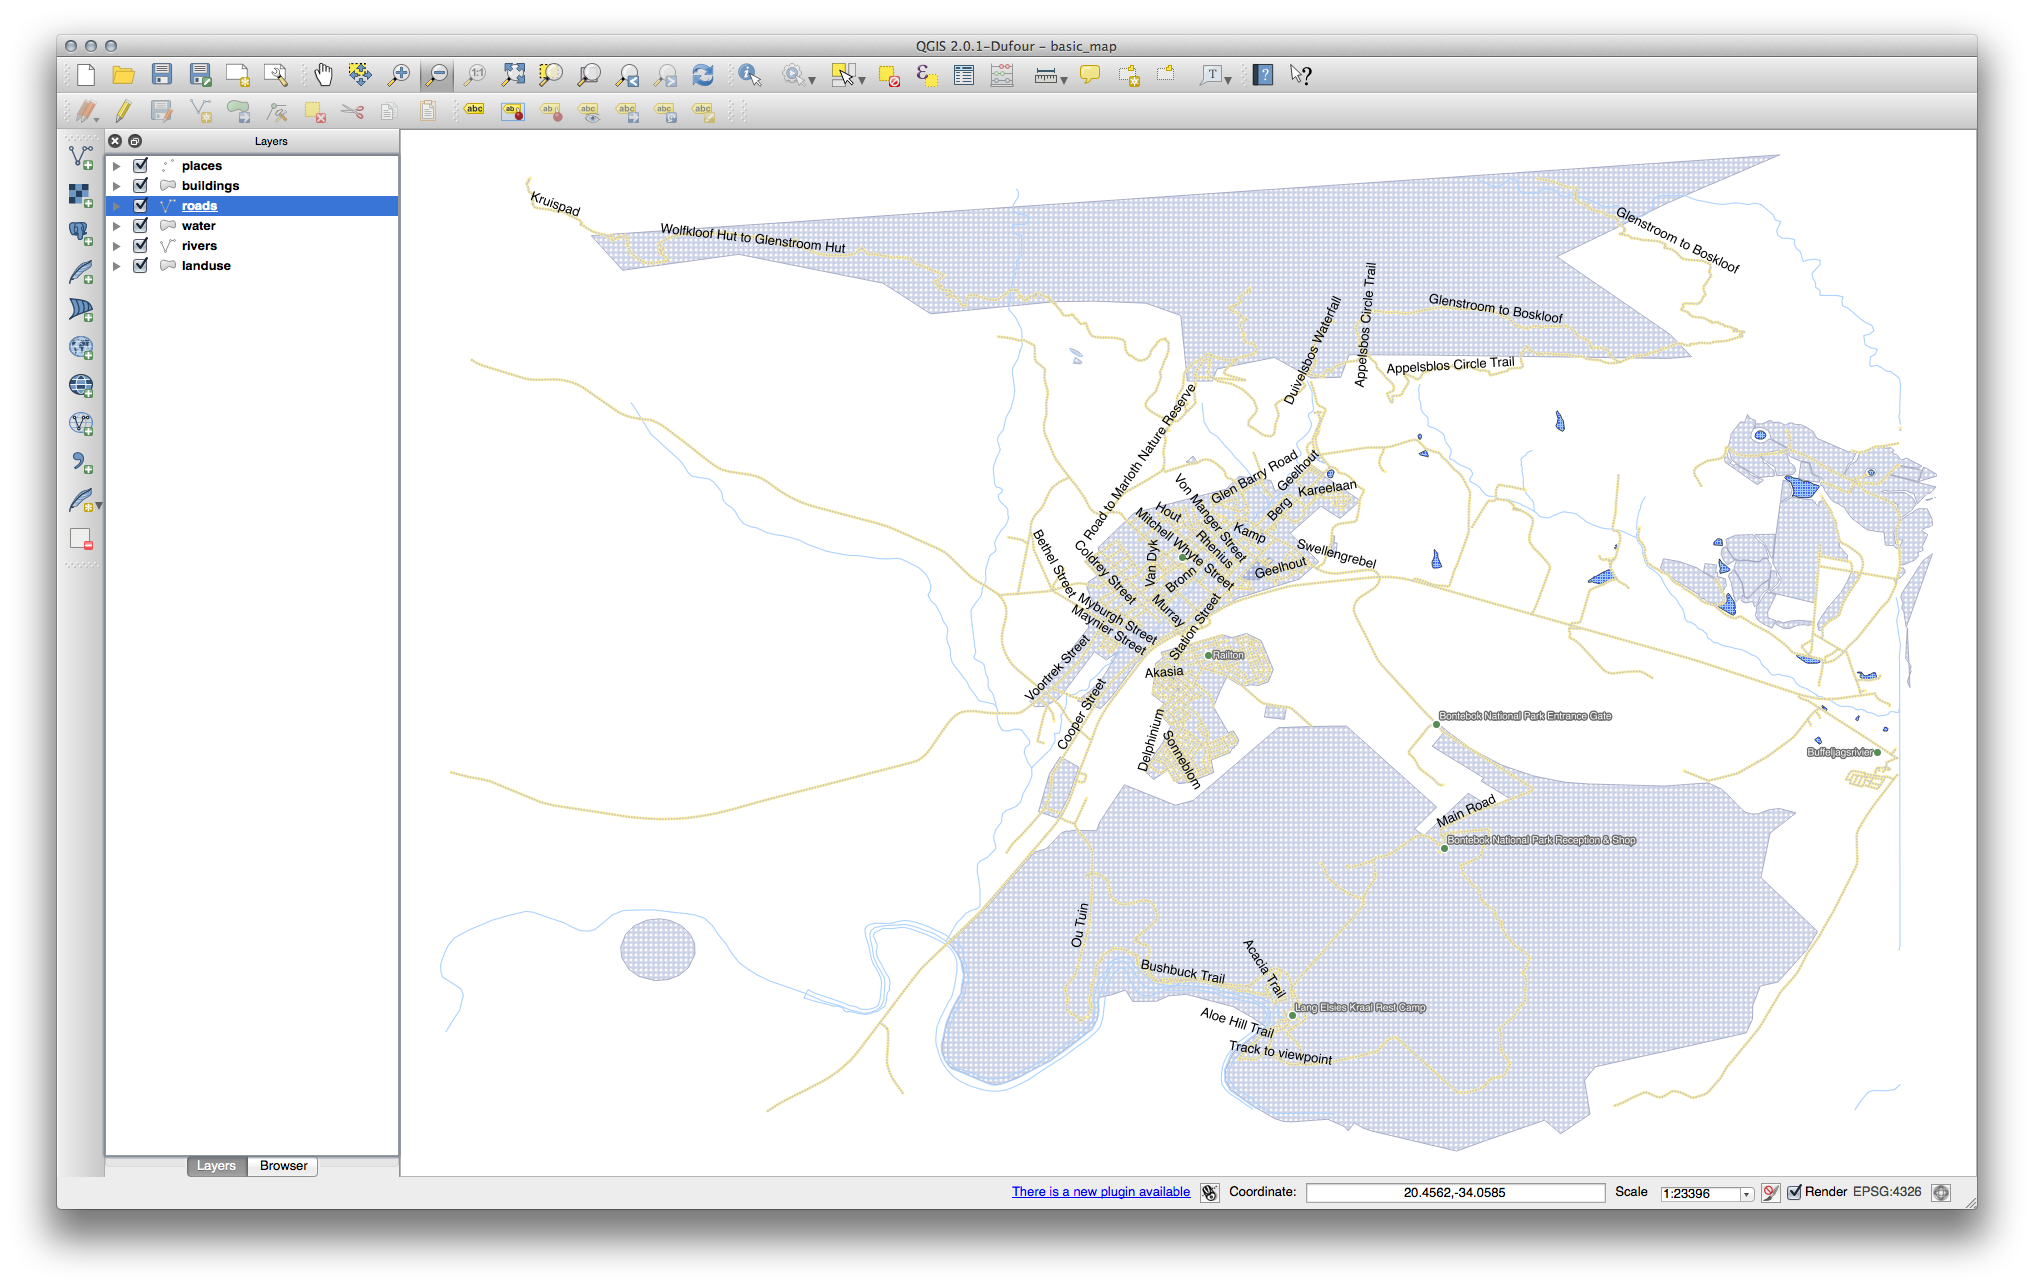
Nu u weet hoe het labelen werkt is er een aanvullend probleem. Punten en polygonen zijn eenvoudig te labelen, maar hoe gaat dat met lijnen? Als u ze op dezelfde manier labelt als de punten, zouden uw resultaten er als volgt uitzien:
We will now reformat the roads layer labels so that they are easy to
understand.
Hide the
placeslayer so that it doesn’t distract youActivate
 Single Labels for the
 roadslayer as you did above forplacesSet the font Size to
10so that you can see more labelsZoom in on the Swellendam town area
In the Labels tab’s Placement tab, choose the following settings:

You’ll probably find that the text styling has used default values and the labels are consequently very hard to read. Update the Text to use a dark-grey or black Color and the Buffer to use a light-yellow Color.
De kaart zal er ongeveer zoals deze uitzien, afhankelijk van de schaal:

U zult zien dat sommige namen van wegen meerdere malen verschijnen en dat is niet altijd nodig. Dit voorkomen:
In the Labels tab of the Layer Properties dialog, choose the Rendering option and select Merge connected lines to avoid duplicate labels as shown:

Klik op OK
Een andere nuttige functie is om te voorkomen dat labels die worden getekend voor objecten te kort worden om te worden opgemerkt.
In the same Rendering panel, set the value of Suppress labeling of features smaller than … to
5.00 mmand note the results when you click ApplyTry out different Placement settings as well. As we’ve seen before, the Horizontal option is not a good idea in this case, so let’s try the Curved option instead.
Select the Curved option in the Placement panel of the Layers tab
Hier is het resultaat:
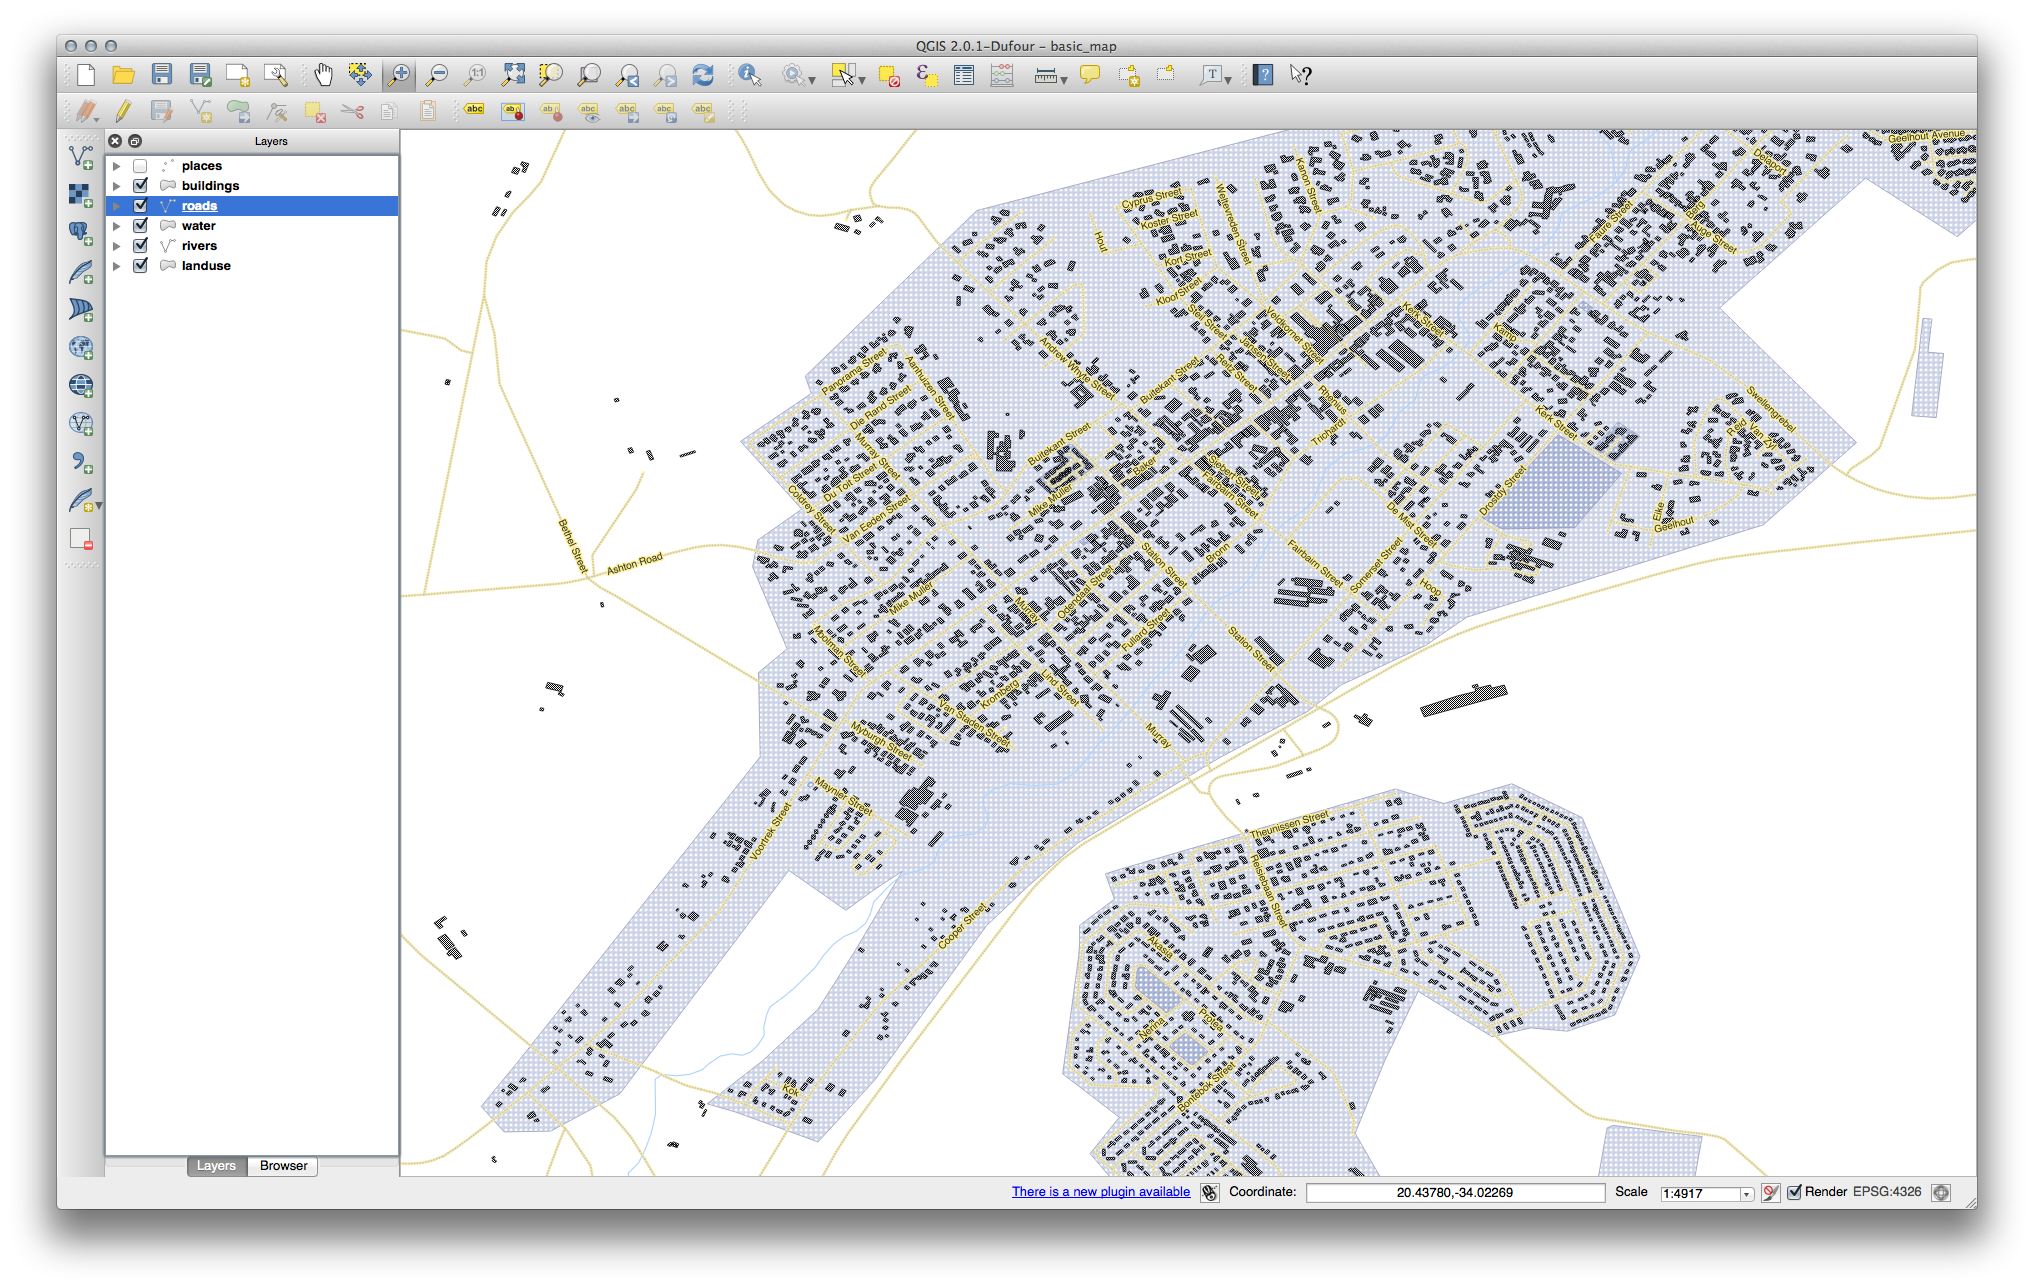
As you can see, this hides some labels that were previously visible, because of the difficulty of making some of them follow twisting street lines while still being legible. It makes other labels much more useful since they track the roads rather than float in space between them. You can decide which of these options to use, depending on what you think seems more useful or what looks better.
4.2.6.  Follow Along: Gegevensgedefinieerde instellingen
Deactivate labeling for the
roadslayerReactivate labeling for the
placeslayerOpen the attribute table for
placesvia the button
It has one field which is of interest to us now:
placewhich defines the type of urban area for each record. We can use this data to influence the label styles.Navigate to the Text panel in the
placesLabels panelClick the
 button next to the Italic text button beneath
Style and select to open the
Expression String Builder:
Under , double click on
placeand then click All Unique. This will list all unique values of theplacefield of this layer. Add a=in the text editor and then double click ontown.Alternatively, you can type:
"place" = 'town'directly in the text editor.Click OK twice:
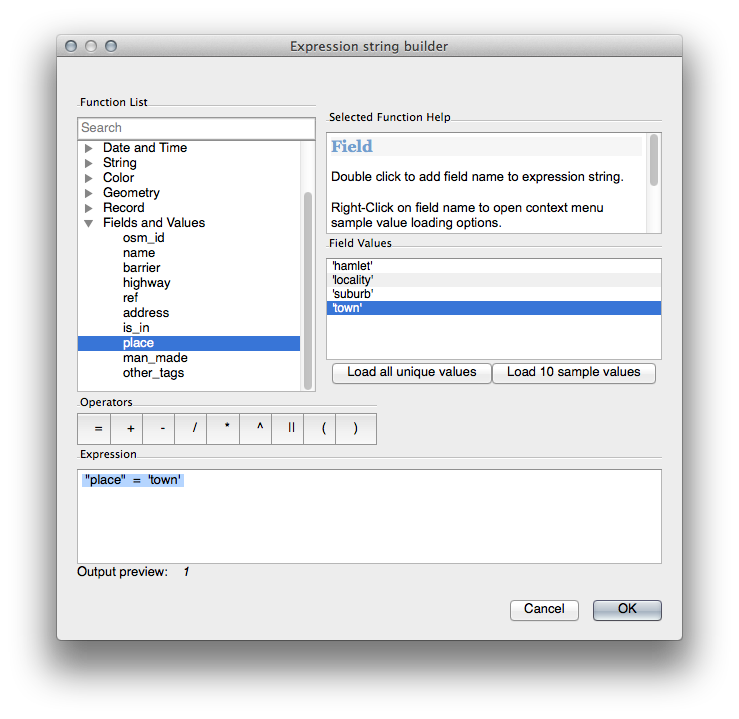
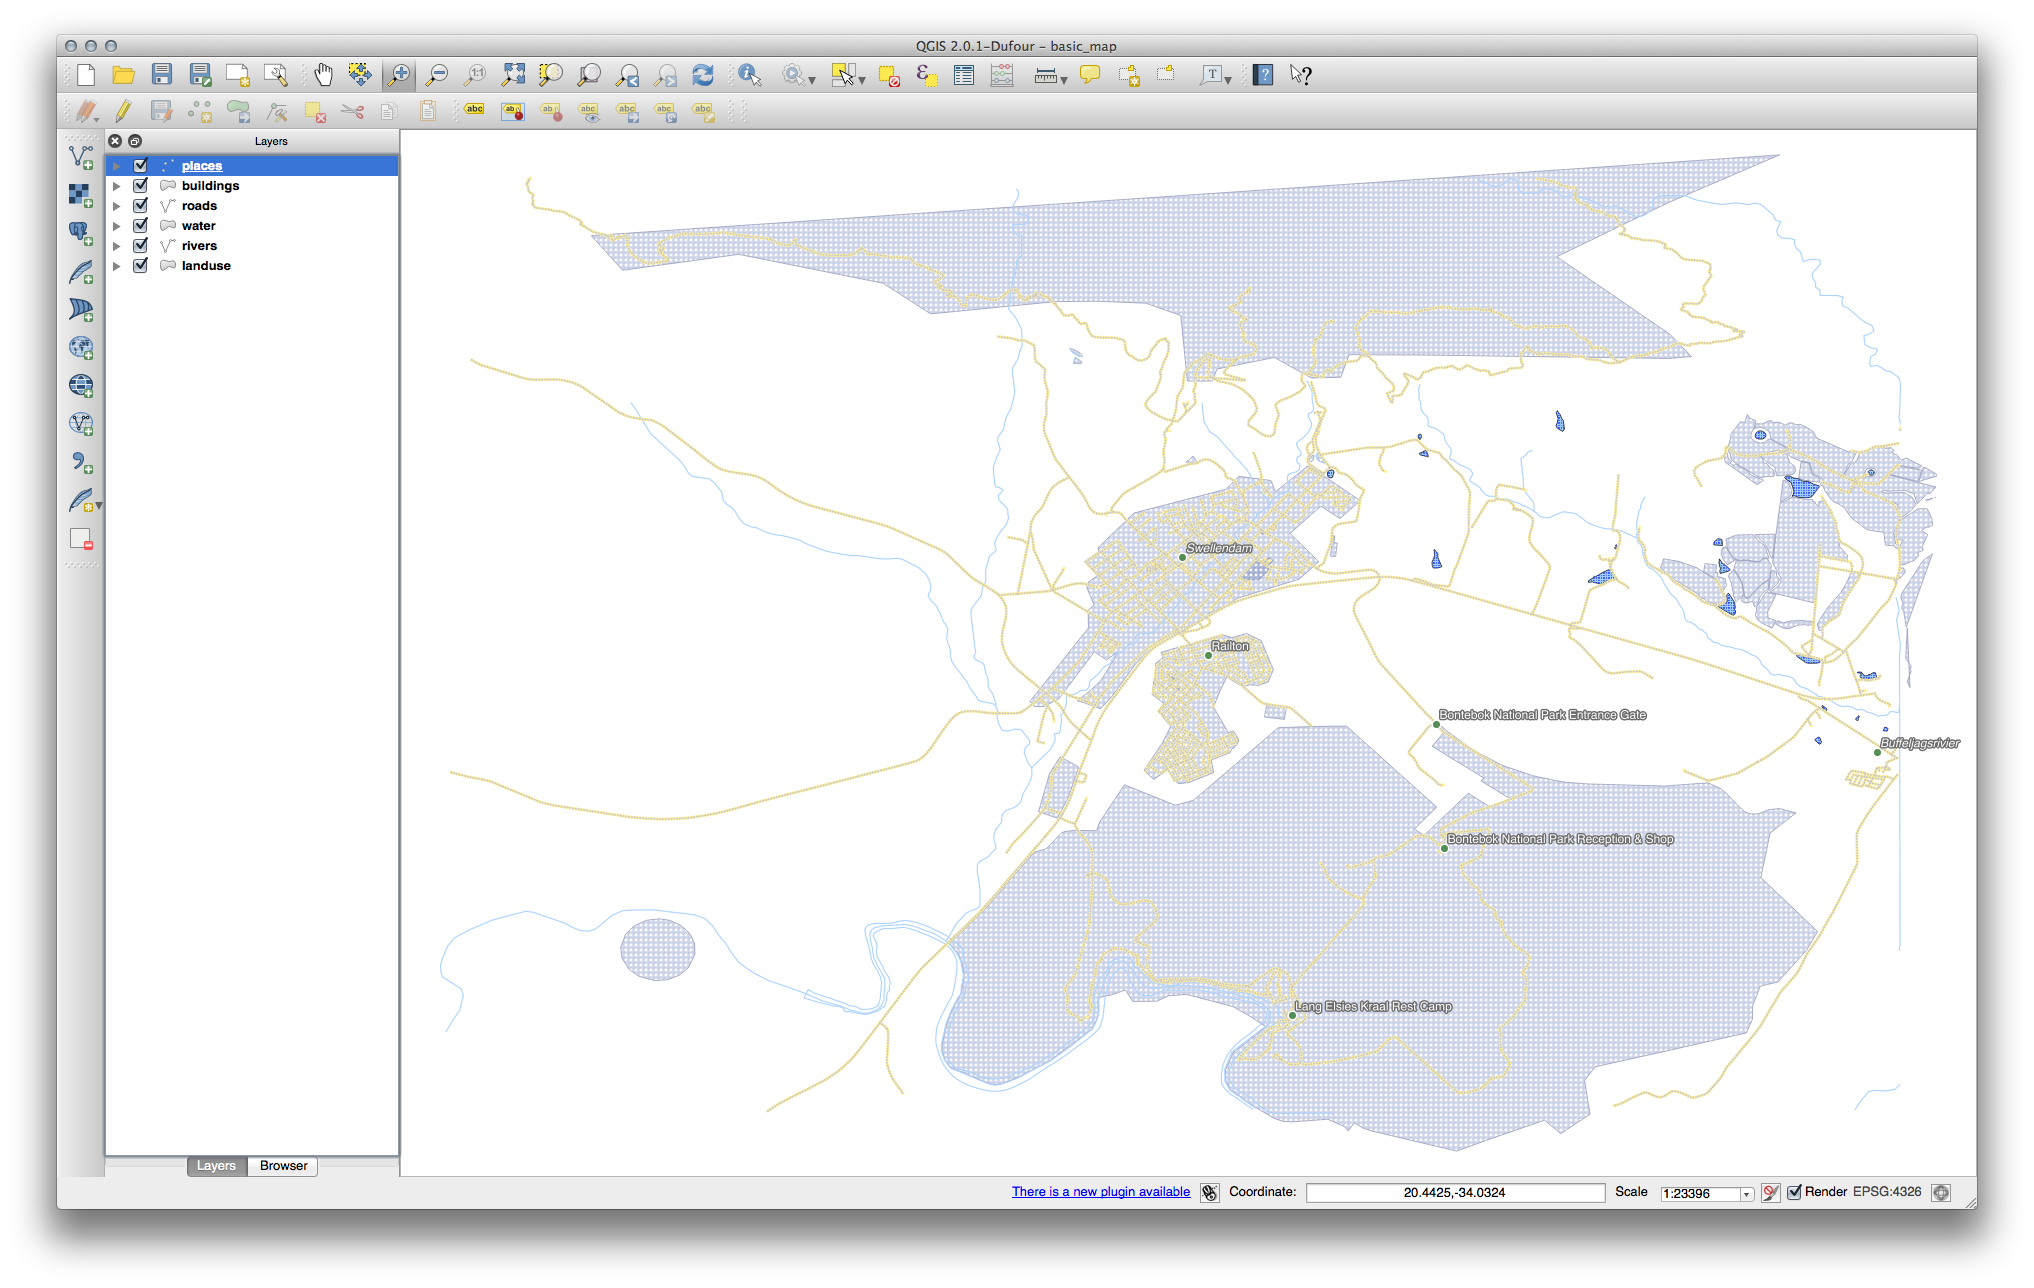
Notice that the labels for all places whose place
field matches town are displayed in italics.
4.2.7.  Try Yourself Gegevensgedefinieerde instellingen gebruiken
Notitie
We springen hier een stukje vooruit om enkele geavanceerde instellingen voor labelen te demonstreren. Op het niveau voor gevorderden wordt aangenomen dat u weet wat het volgende betekent. Als u dat niet weet, laat dit gedeelte dan rusten en kom later terug als u de vereiste materialen heeft behandeld.
Open the Attribute Table for
placesConfigureer die als volgt:

Use this to set custom font sizes for each different type of place (each key in the
placefield)
4.2.8.  Meer mogelijkheden met labelen
We can’t cover every option in this course, but be aware that the Label tab has many other useful functions. You can set scale-based rendering, alter the rendering priority for labels in a layer, and set every label option using layer attributes. You can even set the rotation, XY position, and other properties of a label (if you have attribute fields allocated for the purpose), then edit these properties using the tools adjacent to the main Layer Labeling Options button:
(Deze gereedschappen zullen actief zijn als de vereiste velden voor attributen bestaan en u in de modus Bewerken bent.)
Het staat u uiteraard vrij om meer mogelijkheden van het systeem voor labelen te verkennen.
4.2.9. In Conclusion
U heeft nu geleerd hoe u attributen van lagen gebruikt voor het maken van dynamische labels. Dit kan uw kaart veel informatiever maken en meer stijl geven!
4.2.10. What’s Next?
Nu u weet hoe attributen een visueel verschil voor uw kaart kunnen maken, hoe zijn ze te gebruiken om de symbologie van objecten zelf te wijzigen? Dat is het onderwerp voor de volgende les!


