데이터 열기
오픈소스 소프트웨어 생태계의 일원으로서, QGIS는 서로 다른 라이브러리들을 기반으로 빌드되어, 자체 제공자와 결합해 다음과 같은 여러 포맷들을 읽고, 많은 경우 작성할 수도 있는 능력을 갖추고 있습니다:
Vector data formats include ESRI formats (Shapefile, Geodatabase…), MapInfo and MicroStation file formats, AutoCAD DWG/DXF, GeoPackage, GeoJSON, GRASS, GPX, KML, Comma Separated Values, and many more… Read the complete list of OGR vector supported formats.
Raster data formats include ArcInfo Binary Grid, ArcInfo ASCII Grid, JPEG, GeoTIFF, ERDAS IMAGINE, MBTiles, R or Idrisi rasters, ASCII Gridded XYZ, GDAL Virtual, SRTM, Sentinel Data, and many more… Read the complete list of raster supported formats.
Database formats include PostgreSQL/PostGIS, SQLite/SpatiaLite, Oracle, DB2 or MSSQL Spatial, MySQL…
Support of web data services (WM(T)S, WFS, WCS, CSW, ArcGIS Servers…) is also handled by QGIS providers (see OGC 데이터 클라이언트로서의 QGIS).
보존된(archived) 폴더에서 지원하는 파일을 읽어올 수 있고, 가상(virtual) 및 메모리 레이어 같은 QGIS 자체 포맷도 사용할 수 있습니다.
As of the date of this document, more than 80 vector and 140 raster formats are supported by the GDAL/OGR and QGIS native providers.
참고
Not all of the listed formats may work in QGIS for various reasons. For
example, some require external proprietary libraries, or the GDAL/OGR
installation of your OS may not have been built to support the format you
want to use. To see the list of available formats, run the command line
ogrinfo --formats (for vector) and gdalinfo --formats (for raster),
or check menu (for raster)
in QGIS.
In QGIS, depending on the data format, there are different tools to open it,
mainly available in the menu
or from the Manage Layers toolbar (enabled through menu).
However, all these tools point to a unique dialog, the Data Source
Manager dialog that you can directly open with the  Open Data Source Manager button available on the Data Source
Manager Toolbar or by pressing Ctrl+L. Indeed, the Data Source
Manager dialog offers a unified interface to open vector or raster file-based
data as well as databases or web services supported by QGIS. It can be set
modal or not with the
Open Data Source Manager button available on the Data Source
Manager Toolbar or by pressing Ctrl+L. Indeed, the Data Source
Manager dialog offers a unified interface to open vector or raster file-based
data as well as databases or web services supported by QGIS. It can be set
modal or not with the  Modeless data source manager dialog
in menu.
Modeless data source manager dialog
in menu.
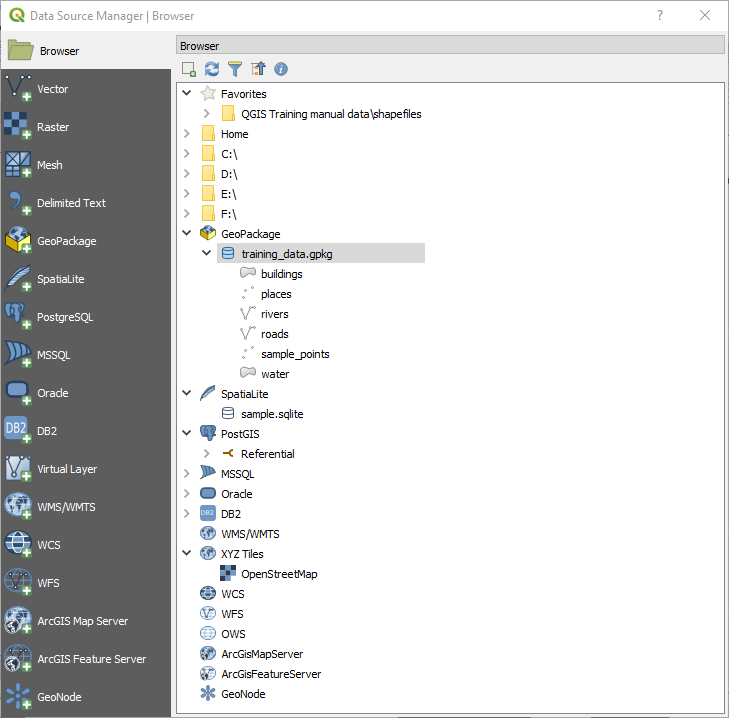
QGIS Data Source Manager dialog
Beside this main entry point, you also have the  DB Manager
plugin that offers advanced capabilities to analyze and manipulate connected
databases. More information on DB Manager capabilities are exposed in DB Manager Plugin.
DB Manager
plugin that offers advanced capabilities to analyze and manipulate connected
databases. More information on DB Manager capabilities are exposed in DB Manager Plugin.
There are also many other tools, native or third-party plugins, that help you open dedicated data formats.
This chapter will describe only the tools provided by default in QGIS to load data. It will mainly focus on the Data Source Manager dialog but more than describing each tab, it will also explore the tools based on the data provider or format specificities.
탐색기 패널
The Browser is one of the main ways to quickly and easily add your data to projects. It’s available as:
a Data Source Manager tab, enabled pressing the
Open Data Source Manager button (Ctrl+L);as a QGIS panel you can open from the menu (or
 ) or by pressing Ctrl+2.
In both cases, the Browser helps you navigate in your file system and manage geodata, regardless the type of layer (raster, vector, table), or the datasource format (plain or compressed files, database, web services).
The context menu for an element in the Browser panel is opened by right-clicking on it.
For file system directory entries, the context menu offers the following:
Add as a Favorite
Properties…
Hide from Browser
Fast Scan this Directory
New Directory…
Open Directory
Favourites, can also be removed and renamed:
Rename favourite…
Remove favourite
For leaf entries that can act as layers in the project, the context menu will have a selection of entries. For example, for non-database, non-service-based vector, raster and mesh data sources:
Add Selected Layer(s) to Canvas
Properties…
Delete File 《<name of file>》…
In the Layer properties entry, you will find (similar to what you will find in the vector and raster layer properties once the layers have been added to the project):
Metadata for the layer. Metadata groups: Information from provider (if possible, Path will be a hyperlink to the source), Identification, Extent, Access, Fields (for vector layers), Bands (for raster layers), Contacts, Links (for vector layers), References (for raster layers), History.
A Preview panel
The attribute table for vector sources (in the Attributes panel).
To add a layer to the project using the Browser:
Enable the Browser as described above. A browser tree with your file system, databases and web services is displayed. You may need to connect databases and web services before they appear (see dedicated sections).
Find the layer in the list.
Use the context menu, double-click its name, or drag-and-drop it into the map canvas. Your layer is now added to the Layers panel and can be viewed on the map canvas.
팁
Open a QGIS project directly from the browser
You can also open a QGIS project directly from the Browser panel by double-clicking its name or by drag-and-drop into the map canvas.
파일을 불러들이고 나면, 맵 둘러보기 도구를 이용해서 맵을 이동 및 확대/축소할 수 있습니다. 레이어 스타일을 변경하려면, 레이어 명을 더블 클릭해서 Layer Properties 대화창을 열거나 범례에 있는 레이어 명을 오른쪽 클릭한 다음 컨텍스트 메뉴에서 을 선택하십시오. 벡터 레이어의 심볼을 설정하는 작업에 대해 더 자세히 알고 싶다면 Symbology Properties 을 참조하세요.
탐색기 패널 상단에 있는 아이콘의 기능은 다음과 같습니다:
 Add Selected Layers: 레이어의 컨텍스트 메뉴에서 를 선택해도 맵 캔버스에 데이터를 추가할 수 있습니다.
 Refresh: 탐색 트리를 새로고칩니다.
 Filter Browser: 특정 데이터를 검색합니다. 검색어 또는 임의 문자 기호(wildcard)를 입력하면 탐색기가 트리를 필터링해서 입력 문자열과 일치하는 데이터베이스 테이블, 파일명 또는 폴더를 가리키는 경로만 표시합니다. 일치하지 않는 다른 데이터 또는 폴더는 숨깁니다. 나란히 있는 QGIS 탐색기 패널 그림의 Browser Panel(2) 예시를 참조하십시오. 필터링 작업은 대소문자를 구분할 수도 있고 안 할 수도 있습니다. 다음 옵션으로 필터링을 설정할 수도 있습니다:
normal: 검색어를 포함하는 모든 항목을 반환합니다.
wildcard(s) 이용: 검색 문자열에서 위치를 지정하는
?그리고/또는*문자를 이용해서 검색을 세밀하게 조정합니다.regular expression 이용
 Collapse All: 탐색 트리 전체를 접습니다.
 Enable/disable properties widget: when toggled on,
a new widget is added at the bottom of the panel showing, if applicable,
metadatas of the selected item.
Enable/disable properties widget: when toggled on,
a new widget is added at the bottom of the panel showing, if applicable,
metadatas of the selected item.
탐색 트리에 있는 항목을 오른쪽 클릭하면 다음 작업을 할 수 있습니다:
파일 또는 테이블인 경우, 해당 항목의 메타데이터를 표시하거나 사용자의 프로젝트에 항목을 열 수 있습니다. 테이블의 경우 재명명하거나, 삭제하거나, 추출할 수도 있습니다.
폴더인 경우, 사용자의 즐겨찾기에 북마크해두고 탐색 트리에서 숨길 수 있습니다. 탭에서 이렇게 숨긴 풀더들을 관리할 수 있습니다.
데이터베이스 또는 웹 서버로의 연결을 생성할 수 있습니다.
스키마를 새로고침하거나, 재명명하거나 삭제할 수 있습니다.
단순히 드래그&드롭하는 것만으로 데이터베이스로 파일을 불러들이거나 어떤 스키마/데이터베이스에서 다른 스키마/데이터베이스로 테이블을 복사할 수도 있습니다. 드래그하는 동안 오래 스크롤을 해야 하는 일을 피하기 위해 두 번째 탐색 패널을 사용할 수 있습니다. 그냥 파일을 선택한 다음 한쪽 패널에서 다른 패널로 드래그&드롭하십시오.
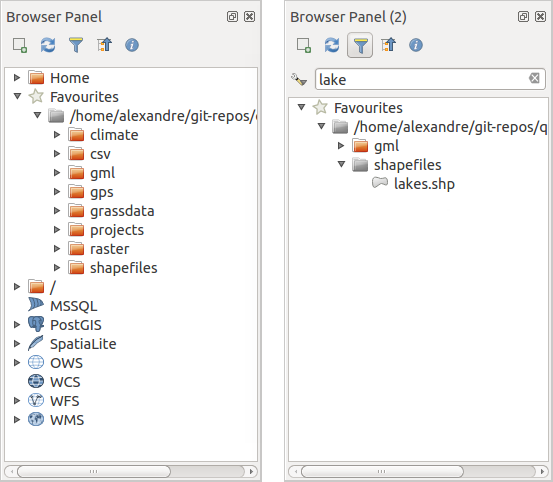
나란히 있는 QGIS 탐색기 패널
팁
사용자 OS의 파일 탐색기에서 단순히 드래그&드롭하는 것만으로 QGIS에 레이어 추가
사용자의 운영체제 파일 탐색기에서 Layers Panel 또는 맵 캔버스로 파일(들)을 드래그&드롭해서 프로젝트에 추가할 수도 있습니다.
데이터베이스 관리자
DB Manager 플러그인은 하나의 사용자 인터페이스에서 QGIS가 지원하는 공간 데이터베이스 유형(PostGIS, SpatiaLite, GeoPackage, Oracle Spatial, MSSQL, DB2, 가상 레이어)을 통합하고 관리하기 위한 자체 도구이자, QGIS의 주 도구 가운데 하나이기도 합니다. 메뉴에서 이 플러그인을 활성화시킬 수 있습니다.
DB Manager 플러그인은 다음 여러 기능들을 제공합니다:
데이터베이스에 연결해서 그 구조 및 내용을 표시합니다.
데이터베이스의 테이블을 미리보기합니다.
맵 캔버스에 레이어를 더블 클릭 또는 드래그&드롭으로 추가합니다.
QGIS 탐색기 또는 다른 데이터베이스로부터 데이터베이스에 레이어를 추가합니다.
SQL 쿼리의 산출물을 생성하고 맵 캔버스에 추가합니다.
가상 레이어 를 생성합니다.
DB Manager Plugin 에서 데이터베이스 관리자에 관한 더 자세한 정보를 설명하고 있습니다.
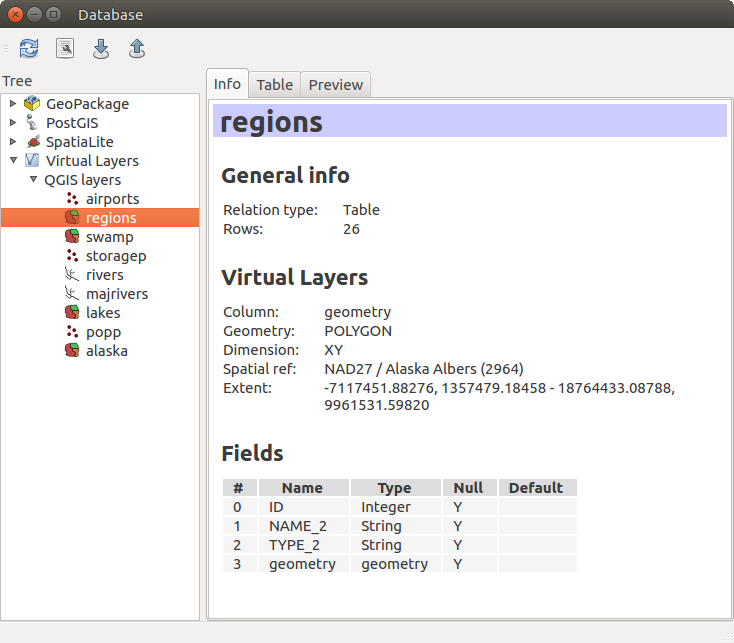
데이터베이스 관리자 대화창
제공자 기반 불러오기 도구
QGIS가 유형에 상관없이 레이어를 추가하기 위해 제공하는 주 도구인 탐색기 패널 및 데이터베이스 관리자 이외에도, 데이터 제공자에 특화된 도구들이 존재합니다.
참고
일부 외부 플러그인 도 QGIS에서 특정 파일 포맷을 열기 위한 도구를 제공합니다.
파일에서 레이어 불러오기
파일에서 레이어를 다음과 같이 불러올 수 있습니다:
for vector data (like Shapefile, Mapinfo or dxf layer), click on
 Add Vector Layer toolbar button, select the
Add Vector
Layer menu option or press Ctrl+Shift+V.
This will bring up a new window (see figure_vector_add) from which you can
check
Add Vector Layer toolbar button, select the
Add Vector
Layer menu option or press Ctrl+Shift+V.
This will bring up a new window (see figure_vector_add) from which you can
check  File and click on Browse. You can
also specify the encoding for the file if desired.
File and click on Browse. You can
also specify the encoding for the file if desired.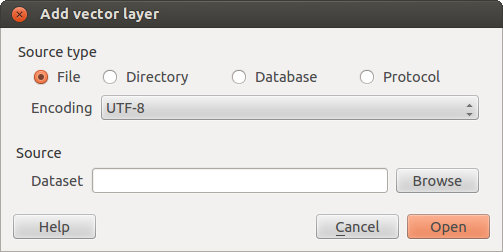
벡터 레이어 추가 대화창
래스터 레이어의 경우,
 Add Raster Layer 아이콘을 클릭하거나, Add Raster Layer 메뉴 옵션을 선택하거나, Ctrl+Shift+R 조합 키를 누르십시오.
표준 파일 열기 대화창(OGR 지원 벡터 레이어 열기 대화창 그림 참조)이 열릴 겁니다. 이 창에서 파일 시스템을 둘러보고 shapefile, GeoTIFF 또는 다른 지원 데이터소스를 불러올 수 있습니다. 선택 상자 Filter  를 통해 몇몇 지원 파일 유형을 사전 선택할 수 있습니다. 잘 검증된 포맷들만 목록에 표시됩니다.
 All files (*.*) 를 선택하면 다른 검증 안 된 포맷들도 불러올 수 있습니다.
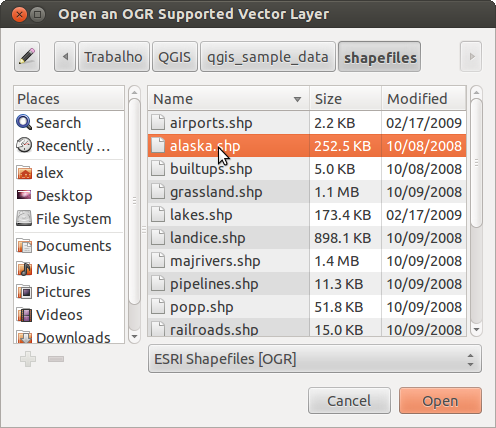
OGR 지원 벡터 레이어 열기 대화창
Selecting a file from the list and clicking Open loads it into QGIS.
More than one layer can be loaded at the same time by holding down the
Ctrl or Shift key and clicking on multiple items in the dialog.
Figure_vector_loaded shows QGIS after loading the alaska.shp file.
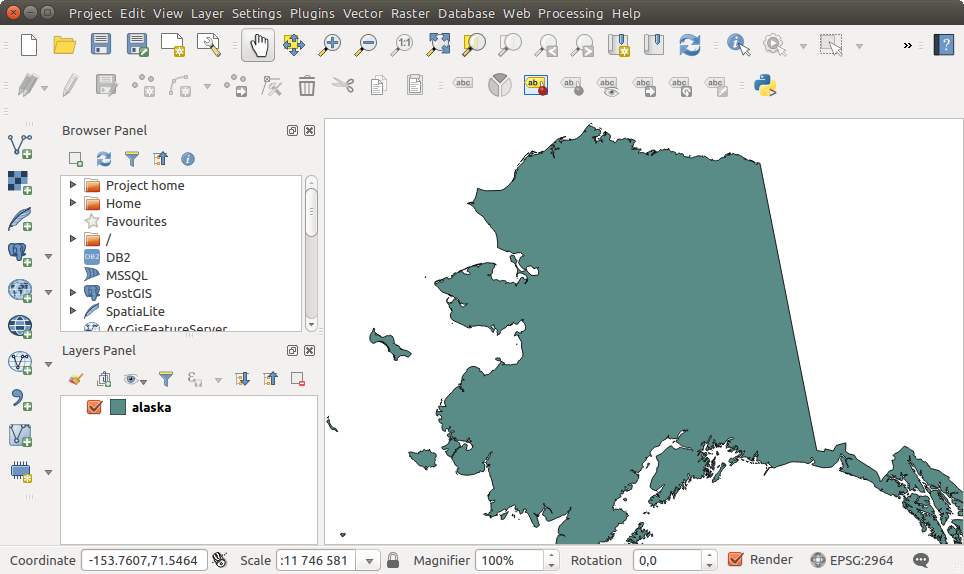
알래스카 shapefile을 불러들인 QGIS
참고
MapInfo(예를 들면 .tab) 또는 Autocad(.dxf) 같은 일부 포맷은 파일 하나 안에 서로 다른 도형 유형을 함께 담을 수 있기 때문에 QGIS에 이런 포맷을 불러올 경우, 레이어 하나 당 도형 유형 하나만 보유할 수 있도록, 사용할 도형을 선택할 수 있는 대화창이 열립니다.
Using the Add Vector Layer tool:
You can also load specific formats like
ArcInfo Binary Coverage,UK. National Transfer Format, as well as the raw TIGER format of theUS Census BureauorOpenfileGDB. To do that, you’d need to select Directory as Source type. In this case
a directory can be selected in the dialog after pressing Browse.With the
Database source type you can select an
existing database connection or create one to the selected database type.
Available database types are ODBC,OGDI Vectors,Esri Personal Geodatabase,MySQLas well asPostgreSQLorMSSQL.Pressing the New button opens the Create a New OGR Database Connection dialog whose parameters are among the ones you can find in 저장된 연결 생성하기. Pressing Open you can select from the available tables for example of the PostGIS enabled database.
The last source type,
Protocol, enables to open
data from the web using for example GeoJSONorCouchDBformat. After selecting the type you have to fill URI of the source.
팁
맥OS에 마운트된 외부 드라이브로부터 레이어와 프로젝트 불러오기
On macOS, portable drives that are mounted beside the primary hard drive
do not show up as expected under .
We are working on a more macOS-native open/save dialog to fix this.
As a workaround, you can type /Volumes in the File name box
and press Enter. Then you can navigate to external drives and network
mounts.
구분 텍스트 파일 가져오기
Delimited text file (e.g. .csv, .txt) can be loaded in QGIS
using the tools described above. However, loaded this way, it’ll show up like a
simple table data. Sometimes, delimited text files can contain geometric data
you’d want to visualize; this is what the  Add
Delimited Text Layer is designed for.
Add
Delimited Text Layer is designed for.
Click the Open Data Source Manager icon to open the
Data Source Manager dialog and enable the
Delimited Text tab, as shown in figure_delimited_text.
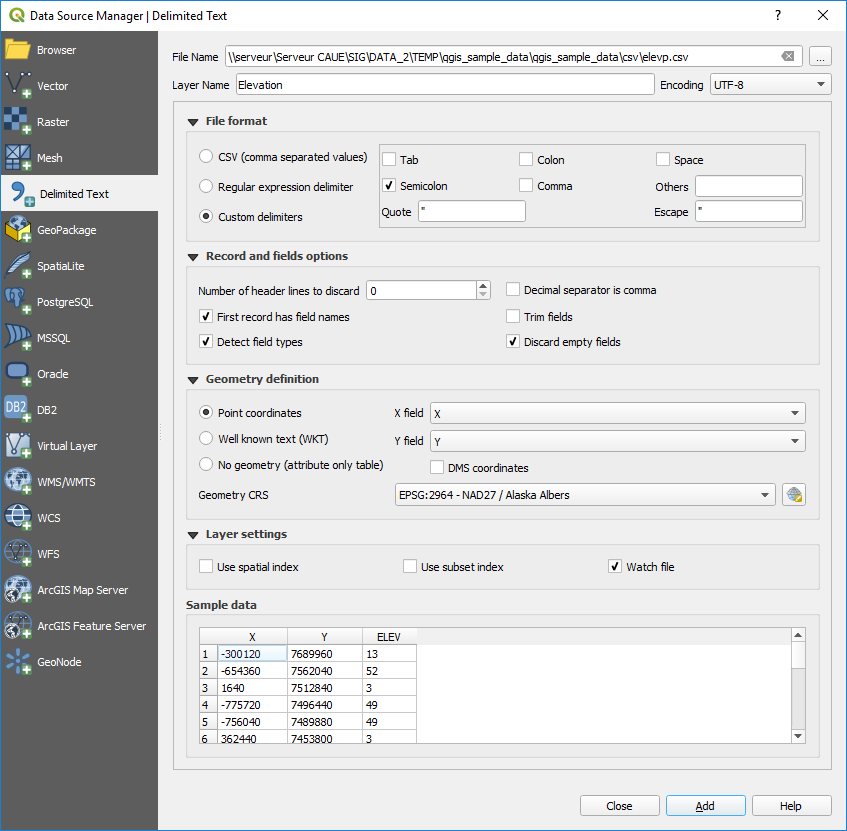
구분 텍스트 대화창
First, select the file to import (e.g., qgis_sample_data/csv/elevp.csv)
by clicking on the Browse button. In the Layer name field,
provide the name to use for the layer in the project (e.g., Elevation).
File format
Once the file is selected, QGIS attempts to parse the file with the most recently used delimiter, trying to identify fields and rows. To enable QGIS to properly parse the file, it is important to select the correct delimiter. You can specify a delimiter by activating:
- CSV (comma separated values) to use the comma character;
 Custom delimiters:
 comma,space,tab,semicolon등등 사전 정의된 여러 구분자들 가운데 선택합니다.- Regular expression delimiter: Expression 란에 구분자로 이용할 텍스트를 입력합니다. 예를 들어 구분자를 탭으로 변경하려면, (탭 문자를 나타내는 정규 표현식인)
\t를 입력하세요.
Records and fields
Other than settings to identify rows and fields in the data, some convenient options can be used to tweak the data recognition:
Number of header lines to discard: convenient when you want to avoid some lines to show in the import, either because those are blank lines or with another formatting.
- First records has field names: values in the first row
of data are used as field names, otherwise QGIS adds a fields row of a type
field_1,field_2… - Detect field types: automatically recognizes the field
type. If unchecked then all attributes are treated as text fields.
- Decimal separator is comma: if necessary, you can force
a comma to be the decimal separator.
- Trim fields: allows you to trim leading and trailing
spaces from fields.
- Discard empty fields.
As you set the parser properties, a sample data preview updates at the bottom of the dialog.
Geometry definition
Once the file is parsed, set Geometry definition to
- Point coordinates and provide the X
field and Y field if the layer is of point geometry type and
contain such coordinate fields. If the coordinates are defined as
degrees/minutes/seconds, activate the DMS coordinates
checkbox;
- Well known text (WKT) option if the spatial
information is represented by WKT: select the Geometry field
containing the WKT definition and choose the approriate Geometry
field or let QGIS auto-detect it;
If the file contains non-spatial data, activate
No
geometry (attribute only table) and it will be loaded as an ordinary table.
Besides the features geometry information, you can also set the layer’s
Geometry CRS using the  Select CRS widget.
Layer settings
여기에 더해, 다음 옵션을 활성화시킬 수 있습니다:
- Use spatial index to improve the performance of
displaying and spatially selecting features;
- Use subset index to improve performance of subset
filters (when defined in the layer properties);
- Watch file to watch for changes to the file by other
applications while QGIS is running.
At the end, click OK to add the layer to the map. In our example, a
point layer named Elevation is added to the project and behaves like any
other map layer in QGIS. However, this layer is the result of a query on the
.csv source layer (hence, linked to it) and would require to be
saved in order to get a spatial layer on disk.
DXF 또는 DWG 파일 가져오기
DXF and DWG files can be added to QGIS by simple drag-and-drop
from the common
Browser Panel. You’ll be prompted to select the sublayers you’d like to add
to the project. Layers are added with random style properties.
참고
포인트, 라인 그리고/또는 폴리곤 같은 도형 유형을 담고 있는 DXF 파일의 경우, <filename.dxf> entities <geometry type> 을 따와서 레이어를 명명합니다.
To keep the dxf/dwg file structure and its symbology in QGIS, you may want to use the dedicated tool which allows you to:
import elements from the drawing file into a GeoPackage database.
and add to the project any of the imported elements.
In the DWG/DXF Import dialog, to first import the drawing file contents:
Input the location of the Target package, i.e. the new GeoPackage file that will store the data. If an existing file is provided, then it will be overwritten.
Specify the coordinate reference system of the data in the drawing file.
Check
Expand block references to import the
blocks in the drawing file as normal elements.Check
Use curves to promote the imported layers
to a curvedgeometry type.Use the Import button to select the DWG/DXF file to use (one per geopackage). The GeoPackage database will be automatically populated with the drawing file content. Depending on the size of the *CAD file, this could take some time.
After the .dwg or .dxf data is imported into the GeoPackage
database the frame in the lower half of the dialog is populated with the list of
layers from the imported file. There you can select which layers to add to the
QGIS project:
At the top, set a Group name to group the drawing files in the project.
Check layers to show: Each selected layer is added to an ad hoc group which contains vector layers for the point, line, label and area features of the drawing layer. The style of each layer is setup so that it resembles the look it originally had in *CAD.
Check whether layer should be visible at opening.
Alternatively using the
Merge layers option places all
layers in a single group.Press OK to open the layers in QGIS.
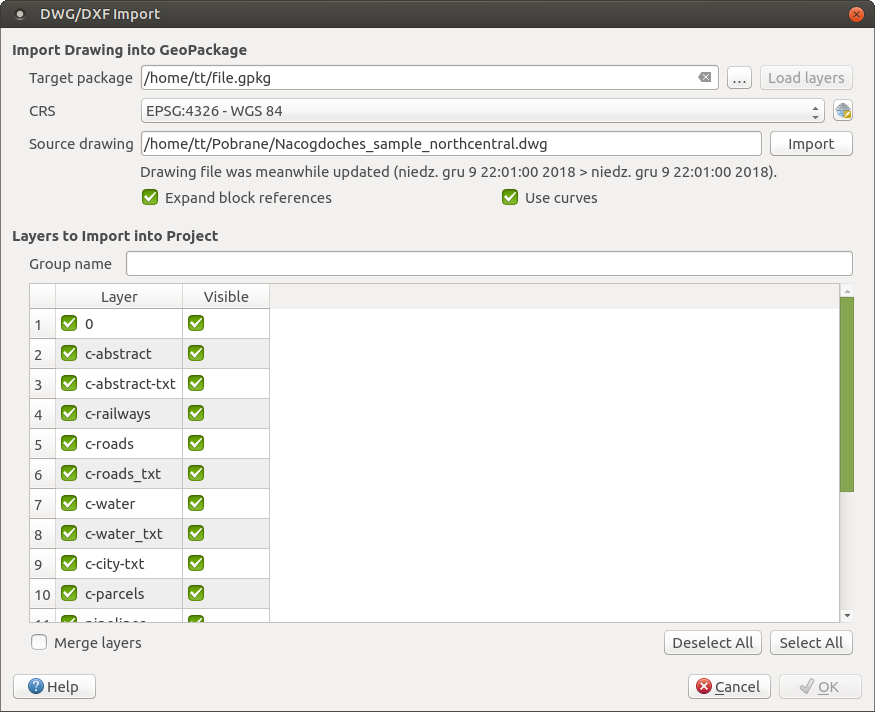
Import dialog for DWG/DXF files
OpenStreetMap 벡터 가져오기
최근 몇 년 동안, OpenStreetMap 프로젝트가 인기를 끌고 있습니다. 많은 나라에서 디지털 도로 지도 같은 무료로 쓸 수 있는 지리 데이터가 없기 때문입니다. GPS 데이터, 항공사진 또는 현지인의 지식으로부터 편집 가능하고 무료인 세계 지도를 생성하는 것이 OSM(OpenStreetMap) 프로젝트의 목표입니다. 이 목표를 돕기 위해, QGIS는 OSM 데이터를 지원하고 있습니다.
Browser Panel 을 통해 맵 캔버스에 .osm 파일을 불러올 수 있는데, 이때 도형 유형을 바탕으로 하위 레이어를 선택할 수 있는 대화창이 열립니다. 불러온 레이어는 파일에 있는 모든 도형 유형 데이터를 담고 있으며 .osm 파일 데이터 구조를 유지할 것입니다.
SpatiaLite 레이어
 처음으로 SpatiaLite 데이터베이스에서 데이터를 불러오는 경우, 다음 가운데 한 방법으로 시작하십시오:
- Add SpatiaLite Layer 툴바 버튼을 클릭합니다.
메뉴에서
옵션을 선택합니다.Ctrl+Shift+L 조합 키를 누릅니다.
This will bring up a window that will allow you either to connect to a
SpatiaLite database already known to QGIS, which you can choose from the
drop-down menu, or to define a new connection to a new database. To define a
new connection, click on New and use the file browser to point to
your SpatiaLite database, which is a file with a .sqlite extension.
QGIS는 SpatiaLite에서 편집할 수 있는 뷰도 지원합니다.
GRASS
GRASS GIS 통합 에서 GRASS 벡터 데이터 작업을 설명하고 있습니다.
데이터베이스 관련 도구
저장된 연결 생성하기
In order to read and write tables from the many database formats QGIS supports you’ll need to create a connection to that database. While QGIS Browser Panel is the simplest and recommanded way to connect and use databases, QGIS provides other tools to connect to each of them and load their tables:
 or by typing
Ctrl+Shift+D;
or by typing
Ctrl+Shift+D; or by typing
Ctrl+Shift+M;
or by typing
Ctrl+Shift+M; or by typing
Ctrl+Shift+O;
or by typing
Ctrl+Shift+O; or by typing
Ctrl+Shift+2.
or by typing
Ctrl+Shift+2.
Manage Layers Toolbar 또는 메뉴를 통해 이 도구들에 접근할 수 있습니다. SpatiaLite 데이터베이스 연결 방법은 SpatiaLite 레이어 에서 설명하고 있습니다.
팁
QGIS 탐색기 패널에서 데이터베이스 연결 생성
탐색 트리에서 대응하는 데이터베이스 유형을 선택해서 오른쪽 클릭한 다음, Connect 를 선택하면 데이터베이스 연결 대화창이 열릴 겁니다.
Most of the connection dialogs follow a common basis that will be described below using the PostGreSQL database tool as example. For additional settings specific to other providers, you can find corresponding description at:
The first time you use a PostGIS data source, you must create a connection to a database that contains the data. Begin by clicking the appropriate button as exposed above, opening an Add PostGIS Table(s) dialog (see figure_add_postgis_tables). To access the connection manager, click on the New button to display the Create a New PostGIS Connection dialog.
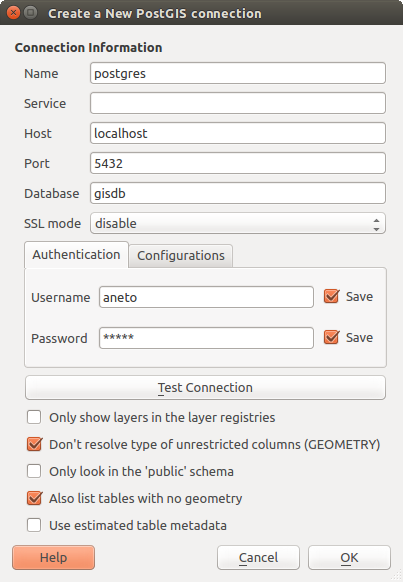
새 PostGIS 연결 생성 대화창
PostGIS 연결에 필요한 파라미터를 설명하겠습니다. 다른 데이터베이스 유형의 경우, 특정 연결 요구사항 에서 차이점들을 참조하세요.
Name: A name for this connection. It can be the same as Database.
Service: Service parameter to be used alternatively to hostname/port (and potentially database). This can be defined in
pg_service.conf. Check the PostgreSQL 서비스 연결 파일 section for more details.Host: Name of the database host. This must be a resolvable host name such as would be used to open a TCP/IP connection or ping the host. If the database is on the same computer as QGIS, simply enter localhost here.
Port: Port number the PostgreSQL database server listens on. The default port for PostGIS is
5432.Database: Name of the database.
SSL mode: SSL encryption setup. The following options are available:
Prefer (the default): I don’t care about encryption, but I wish to pay the overhead of encryption if the server supports it.
Require: I want my data to be encrypted, and I accept the overhead. I trust that the network will make sure I always connect to the server I want.
Verify CA: I want my data encrypted, and I accept the overhead. I want to be sure that I connect to a server that I trust.
Verify Full: I want my data encrypted, and I accept the overhead. I want to be sure that I connect to a server I trust, and that it’s the one I specify.
Allow: I don’t care about security, but I will pay the overhead of encryption if the server insists on it.
Disable: I don’t care about security, and I don’t want to pay the overhead of encryption.
Authentication, basic.
Username: User name used to log in to the database.
Password: Password used with Username to connect to the database.
You can save any or both of the
usernameandpasswordparameters, in which case they will be used by default each time you need to connect to this database. If not saved, you’ll be prompted to fill the missing credentials to connect to the database in next QGIS sessions; meanwhile the connection parameters you entered are stored in a temporary internal cache and returned whenever a username/password for the same database is requested, until you close the current QGIS process.경고
QGIS 사용자 설정 및 보안
Authentication 탭에서 username 과 password 를 저장하면 연결 환경 설정에 보안되지 않은 인증 정보를 저장하게 됩니다. 예를 들면, 다른 사용자와 프로젝트 파일을 공유하는 경우, 이런 인증 정보가 노출될 것입니다. 따라서 사용자 인증 정보를 인증 환경 설정 (Configurations 탭 – 더 자세한 내용은 인증 시스템 참조) 또는 서비스 연결 파일(예시를 보려면 PostgreSQL 서비스 연결 파일 참조)에 대신 저장하는 편이 좋습니다.
데이터베이스 유형에 따라 다음 체크박스들을 선택적으로 활성화할 수 있습니다:
- Only show layers in the layer registries
- Don’t resolve type of unrestricted columns (GEOMETRY)
- Only look in the 〈public〉 schema
- Also list tables with no geometry
- Use estimated table metadata
- Allow saving/loading QGIS projects in the database:
more details here
팁
수행 속도 향상을 위해 예측된 테이블 메타데이터 이용
레이어 초기화 시, 데이터베이스 테이블에 저장된 도형의 특성을 밝히기 위해 다양한 쿼리가 필요할 수도 있습니다. Use estimated table metadata 옵션을 체크하면, 전체 테이블을 쿼리하는 대신 일부 행을 검사하고 테이블 통계를 이용하는 쿼리를 실행합니다. 대용량 데이터셋의 경우 작업 속도를 현저하게 높일 수 있지만, 레이어 특성을 부정확하게 표시할 수도 있고 (예를 들어 필터링된 레이어의 피처 개수가 부정확할 것입니다) 유일무이하다고 간주한 열이 사실은 그렇지 않은 경우 이상하게 동작할 가능성조차 있습니다.
Once all parameters and options are set, you can test the connection by clicking on the Test Connection button or apply it hitting OK. From the Add PostGIS Table(s), click now on Connect and the dialog is filled with tables from the selected database (as shown in figure_add_postgis_tables).
특정 연결 요구사항
데이터베이스 유형의 독특함 때문에, 모든 데이터베이스 연결 옵션은 동일합니다. 다음은 그 연결의 특정 요소들에 대한 설명입니다.
PostgreSQL 서비스 연결 파일
서비스 연결 파일을 이용하면 PostgreSQL 연결 파라미터들을 단일 서비스명으로 묶을 수 있습니다. 그러면 클라이언트가 해당 서비스명을 지정해서 관련 설정을 사용할 수 있습니다.
서비스 연결 파일명은 GNU/리눅스, 맥OS 등 *닉스 시스템에서는 .pg_service.conf 이며 윈도우에서는 pg_service.conf 입니다.
서비스 파일의 내용은 다음과 비슷합니다:
[water_service]
host=192.168.0.45
port=5433
dbname=gisdb
user=paul
password=paulspass

[wastewater_service]
host=dbserver.com
dbname=water
user=waterpass
참고
앞의 예시에는 서비스가 water_service 와 wastewater_service 2개 있습니다. QGIS, pgAdmin 등에서 사용자가 연결하고자 하는 서비스명만 (괄호로 감싸지 않고) 설정해서 연결할 수 있습니다. psql 서비스를 이용하고자 하는 경우, psql 명령어를 실행하기 전에 export PGSERVICE=water_service 같은 명령어를 입력해야 합니다.
여기 에서 모든 파라미터들을 찾아볼 수 있습니다.
참고
서비스 파일에 비밀번호를 저장하고 싶지 않다면 .pg_pass 옵션을 이용할 수 있습니다.
GNU/리눅스, 맥OS 등 *닉스 운영체제 상에서 사용자 홈 디렉터리에 .pg_service.conf 파일을 저장하면 PostgreSQL 클라이언트가 해당 파일을 자동적으로 인식할 것입니다. 예를 들면, 로그인한 사용자가 web 일 경우, (다른 환경 변수를 지정하지 않고) 직접 작업하려면 /home/web/ 디렉터리에 .pg_service.conf 파일을 저장해야 합니다.
PGSERVICEFILE 환경 변수를 생성해서 서비스 파일의 위치를 지정할 수 있습니다. (예를 들어 *닉스 운영체제에서 일시적으로 PGSERVICEFILE 변수를 설정하려면 export PGSERVICEFILE=/home/web/.pg_service.conf 명령어를 실행하십시오.)
pg_config --sysconfdir 명령어로 .pg_service.conf 파일이 있는 폴더를 지정하거나, 서비스 연결 파일이 있는 디렉터리를 지정한 PGSYSCONFDIR 환경 변수를 추가해서 시스템 수준에서 (모든 사용자가) 서비스 연결 파일을 이용할 수 있도록 할 수도 있습니다. 동일한 명칭의 서비스 정의가 사용자 파일과 시스템 파일 양쪽에 모두 있을 경우, 사용자 파일을 우선합니다.
경고
윈도우의 경우 다음과 같은 위험 부담이 있습니다:
서비스 파일을
.pg_service.conf가 아니라pg_service.conf로 저장해야 합니다.서비스 파일이 제대로 동작하려면 유닉스 서식으로 저장해야 합니다. 한 가지 방법을 소개하자면, Notepad++ 로 파일을 연 다음 메뉴 옵션을 선택하면 됩니다.
다양한 방법으로 환경 변수를 추가할 수 있습니다. 확실하다고 알려진 검증된 방법은 메뉴에서
PGSERVICEFILE과 그 경로C:\Users\John\pg_service.conf를 입력해서 추가하는 것입니다.환경 변수를 추가한 다음 컴퓨터를 재시작해야 할 수도 있습니다.
Oracle 데이터베이스를 연결하기
Oracle Spatial의 공간 기능들을 이용하면 Oracle 데이터베이스 내부에서 지리 및 위치 데이터를 자체 유형으로 관리할 수 있습니다. 저장된 연결 생성하기 에 있는 몇몇 옵션 이외에도, 연결 대화창은 다음을 제안합니다:
Database: Oracle 인스턴스의 SID 또는 SERVICE_NAME입니다.
Port: Oracle 데이터베이스 서버가 열어 놓은 포트 번호입니다. 기본 포트는
1521입니다.Workspace: 전환할 작업 공간입니다.
다음 체크박스를 선택적으로 활성화할 수 있습니다:
- Only look in metadata table: restricts the displayed
tables to those that are in the
all_sdo_geom_metadataview. This can speed up the initial display of spatial tables. - Only look for user’s tables: when searching for spatial
tables, restricts the search to tables that are owned by the user.
- Also list tables with no geometry: indicates that
tables without geometry should also be listed by default.
- Use estimated table statistics for the layer metadata:
when the layer is set up, various metadata are required for the Oracle table.
This includes information such as the table row count, geometry type and
spatial extents of the data in the geometry column. If the table contains a
large number of rows, determining this metadata can be time-consuming. By
activating this option, the following fast table metadata operations are
done: Row count is determined from
all_tables.num_rows. Table extents are always determined with the SDO_TUNE.EXTENTS_OF function, even if a layer filter is applied. Table geometry is determined from the first 100 non-null geometry rows in the table. - Only existing geometry types: only lists the existing
geometry types and don’t offer to add others.
- Include additional geometry attributes
팁
Oracle 공간 레이어
일반적으로, USER_SDO_METADATA 테이블의 항목이 Oracle 레이어를 정의합니다.
To ensure that selection tools work correctly, it is recommended that your tables have a primary key.
DB2 데이터베이스를 연결하기
저장된 연결 생성하기 에 있는 몇몇 옵션 이외에도, ODBC에 정의된 Service/DSN 명칭을 이용하거나 또는 드라이버, 호스트 및 포트 정보를 이용해서 DB2 데이터베이스(자세한 정보는 DB2 Spatial 레이어 참조)로의 연결을 지정할 수 있습니다.
ODBC Service/DSN 연결은 ODBC에 정의된 서비스명을 필요로 합니다.
드라이버/호스트/포트 연결은 다음을 필요로 합니다:
Driver: DB2 드라이버의 명칭입니다. 일반적으로
IBM DB2 ODBC DRIVER일 겁니다.DB2 Host: 데이터베이스 호스트의 명칭입니다. TCP/IP 연결을 열거나 호스트를 핑(ping)하는 데 쓰일 수도 있기 때문에 분해할 수 있는(resolvable) 호스트명이어야만 합니다. 데이터베이스가 QGIS와 동일한 컴퓨터에 있는 경우, 그냥 localhost 라고 입력하십시오.
DB2 Port: DB2 데이터베이스 서버가 열어 놓은 포트 번호입니다. 기본 DB2 LUW 포트는
50000입니다. 기본 DB2 z/OS 포트는446입니다.
팁
DB2 공간 레이어
DB2GSE.ST_GEOMETRY_COLUMNS 뷰에 있는 행이 DB2 공간 레이어를 정의합니다.
참고
QGIS에서 DB2 공간 테이블을 효과적으로 작업하려면, 테이블이 PRIMARY KEY 로 정의된 INTEGER 또는 BIGINT 열을 가지고 있어야만 합니다. 새 피처를 추가하려 할 경우, 이 열은 GENERATED 특성도 가지고 있어야 합니다.
공간 열이 특정 공간 참조 식별자(대부분의 경우 WGS84 좌표를 뜻하는 4326)로 등록돼 있으면 편리합니다. ST_Register_Spatial_Column 저장 프로시저 를 호출하면 공간 열을 등록할 수 있습니다.
MSSQL Spatial을 연결하기
저장된 연결 생성하기 에 있는 몇몇 옵션 이외에도, 새 MSSQL 연결 생성 대화창에서 Provider/DSN 명칭을 입력할 수 있습니다. 사용할 수 있는 데이터베이스도 표시할 수 있습니다.
데이터베이스 레이어 불러오기
사용자가 데이터베이스 연결을 하나 이상 정의하고 나면 (저장된 연결 생성하기 참조) 데이터베이스에서 레이어를 불러올 수 있습니다. 물론 불러올 데이터가 있어야만 합니다. 예를 들어 PostGIS 데이터베이스로 데이터를 가져오는 작업에 대한 내용은 PostgreSQL로 데이터 가져오기 를 참조하십시오.
데이터베이스에서 레이어를 불러오려면 다음 단계를 거쳐야 합니다:
Open the 《Add <database> table(s)》 dialog (see 저장된 연결 생성하기).
Choose the connection from the drop-down list and click Connect.
- Also list tables with no geometry 체크박스를 활성화하거나 비활성화합니다.
Optionally, use some
Search Options to reduce the
list of tables to those matching your search. You can also set this option
before you hit the Connect button, speeding this way the database
fetching.이용할 수 있는 레이어 목록에서 사용자가 추가하려 하는 레이어(들)를 찾습니다.
그 레이어를 클릭해서 선택하십시오. Shift 키를 누른 채 클릭하면 레이어 여러 개를 선택할 수 있습니다.
If applicable, use the Set Filter button (or double-click the layer) to start the Query Builder dialog (See section 쿼리 작성기) and define which features to load from the selected layer. The filter expression appears in the
sqlcolumn. This restriction can be removed or edited in the frame.The checkbox in the
Select at idcolumn that is activated by default gets the features ids without the attributes and speeds in most cases the data loading.Click on the Add button to add the layer to the map.
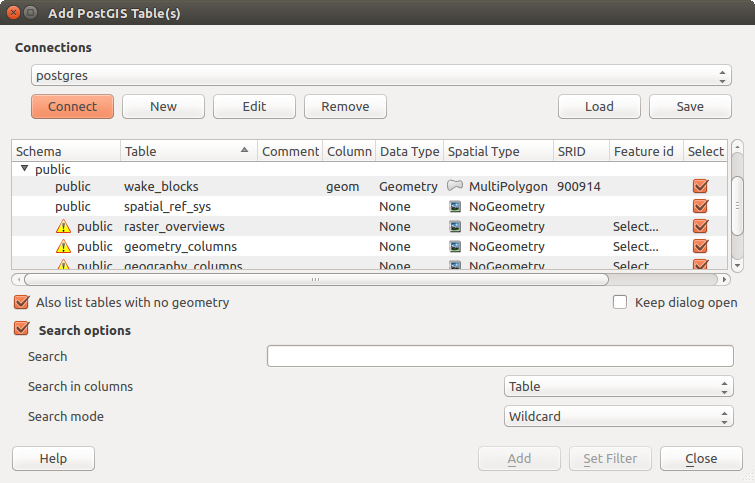
PostGIS 테이블 추가 대화창
팁
Use the Browser Panel to speed up loading of database table(s)
Adding DB tables from their ad hoc tab of the Data Source Manager dialog to QGIS may sometimes be time consuming as QGIS fetches statistics and properties (e.g. geometry type and field, CRS, number of features) of each table beforehand. To avoid this, once the connection is set, it’s better to use the Browser Panel or the DB Manager to drag and drop the database tables in the map canvas.
QGIS 사용자 지정 포맷
QGIS는 특화된 불러오기 도구를 이용해 응용 프로그램에 불러올 수 있는 사용자 지정 포맷을 2개 제공합니다.
임시 스크래치 레이어(Temporary Scratch Layer): 함께 열린 프로젝트에 종속된 메모리 레이어 (자세한 내용은 새 임시 스크래치 레이어 생성하기 참조)
가상 레이어(Virtual Layer): 다른 레이어(들)에 대한 쿼리에서 산출된 레이어 (자세한 내용은 Creating virtual layers 참조)
QLR - QGIS Layer Definition File
Layer definitions can be saved as a
Layer Definition File (QLR -
.qlr) using
in the layer
context menu.
The QLR format makes it possible to share 《complete》 QGIS layers with other QGIS users. QLR files contain links to the data sources and all the QGIS style information necessary to style the layer.
QLR files are shown in the Browser Panel and can be used to add layers (with their saved styles) to the Layers Panel. You can also drag and drop QLR files from the system file manager into the map canvas.
웹 서비스를 연결하기
QGIS를 통해 서로 다른 OGC 웹 서비스 유형(WM(T)S, WFS(-T), CSW 등등)에 접근할 수 있습니다. QGIS 서버 덕분에, 이 서비스들을 웹 상에 공개할 수도 있습니다. OGC 데이터 작업 에서 이런 역량 및 방법에 대해 설명하고 있습니다.