The Toolbox
The Processing Toolbox is the main element of the processing GUI, and the one that you are more likely to use in your daily work. It shows the list of all available algorithms grouped in different blocks called Providers, and custom models and scripts you can add to extend the set of tools. Hence the toolbox is the access point to run them, whether as a single process or as a batch process involving several executions of the same algorithm on different sets of inputs.
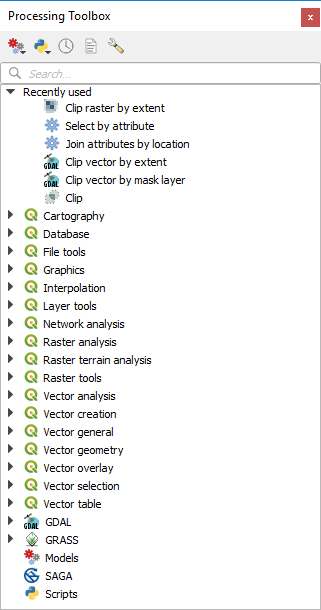
プロセッシングツールボックス
Providers can be (de)activated in the Processing settings dialog. By default, only providers that do not rely on third-party applications (that is, those that only require QGIS elements to be run) are active. Algorithms requiring external applications might need additional configuration. Configuring providers is explained in a later chapter in this manual.
In the upper part of the toolbox dialog, you will find a set of tools to:
work with
 Models: Create New Model...,
Open Existing Model... and Add Model to Toolbox...;
Models: Create New Model...,
Open Existing Model... and Add Model to Toolbox...;work with
 Scripts: Create New Script...,
Create New Script from Template..., Open Existing
Script... and Add Script to Toolbox...;
Scripts: Create New Script...,
Create New Script from Template..., Open Existing
Script... and Add Script to Toolbox...;toggle the toolbox to the in-place modification mode using the
 Edit Features In-Place button: only
the algorithms that are suitable to be executed on the active layer without
outputting a new layer are displayed;
Below this toolbar is a  Search... box to help you easily find
the tools you need.
You can enter any word or phrase on the text box. Notice that, as you type, the
number of algorithms, models or scripts in the toolbox is reduced to just those
that contain the text you have entered in their names or keywords.
注釈
At the top of the list of algorithms are displayed the most recent used tools; handy if you want to reexecute any.
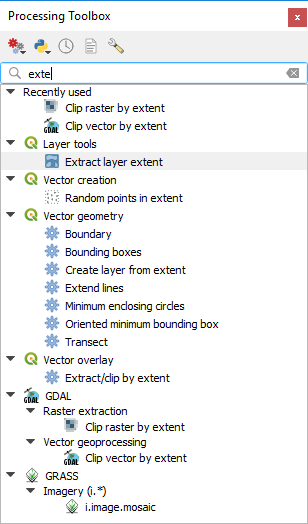
検索結果を表示している[プロセッシングツールボックス]
To execute a tool, just double-click on its name in the toolbox.
アルゴリズムダイアログ
Once you double-click on the name of the algorithm that you want to execute, a
dialog similar to that in the figure below is shown (in this case, the dialog
corresponds to the Centroids algorithm).
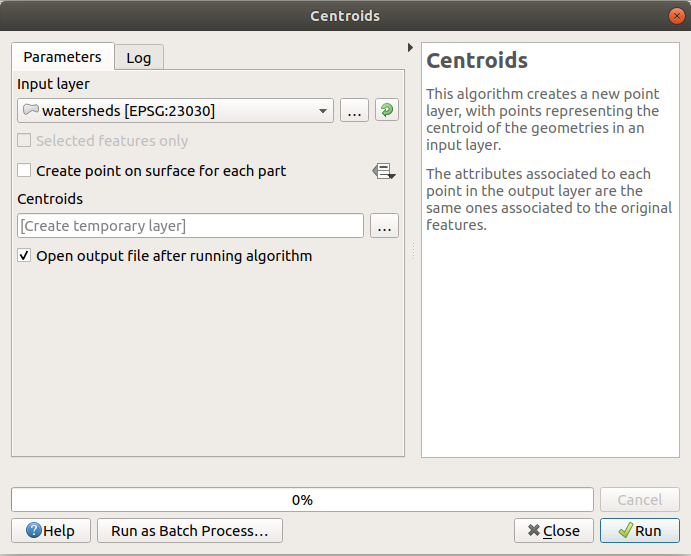
Algorithm Dialog - Parameters
このダイアログでは、アルゴリズムを実行する必要があるの入力値を設定するために使用されます。これは、入力値と設定する設定パラメーターのリストを示しています。それはもちろん、さまざまなコンテンツを持って実行するアルゴリズムの要件に応じて、それらの要件に基づいて自動的に作成されます。
パラメーターの数とタイプは、アルゴリズムの特性に依存しますが、構造は、それらのすべてについても同様です。テーブルで検出されたパラメーターは、次のいずれかのタイプのものとすることができます。
ラスターレイヤー 、QGISで利用可能なすべてのこのようなレイヤーのリスト(現在開いている)から選択します。セレクタを使用すると、その右側にボタンも含まれ、現在QGISにロードされていないレイヤーを表すファイル名を選択できるようになります。
ベクターレイヤー は、QGISで利用可能なすべてのベクターレイヤーのリストから選択します。QGISにロードされていないレイヤーは、ラスターレイヤーの場合のように、同様に選択できますが、このアルゴリズムは、レイヤーの属性テーブルから選択したテーブルのフィールドを必要としない場合にのみ。その場合には、彼らは利用できるフィールド名のリストを取得するように開く必要があるため、開かれたレイヤーだけが選択できます。
以下の図のように、各ベクターレイヤーにイテレータボタンが表示されるでしょう.

ベクターイテレータボタン
アルゴリズムがそれらのいくつかを含む場合は、それらのひとつだけを切り替えできるようになります。ベクター入力に対応するボタンがトグルされた場合、アルゴリズムは、アルゴリズムが実行された回数と同じ数の出力を生成する、全レイヤーに一度だけの代わりに、その地物のそれぞれに繰り返し実行されます。これにより、レイヤー内のすべての地物を別々に処理する必要があるとき、プロセスを自動化できます。
注釈
By default, the parameters dialog will show a description of the CRS of each layer along with its name. If you do not want to see this additional information, you can disable this functionality in the Processing Settings dialog, unchecking the option.
テーブル 、QGISで使用可能なすべてのリストから選択します。非空間テーブルは、ベクターレイヤーのようなものとしてQGISにロードされ、実際にプログラムによってそのようなものとして処理されます。現在、一つのテーブルを必要とするアルゴリズムを実行するときに表示される使用可能なテーブルのリストは、dBaseの内のファイル(
.dbf)またはカンマ区切り値(.CSV)フォーマットからのテーブルに制限されます。オプション 、利用可能なオプションのリストから選択する
A numerical value, to be introduced in a spin box. In some contexts (when the parameter applies at the feature level and not at the layer's), you will find a
 Data-defined override button by its side, allowing
you to open the expression builder and enter a
mathematical expression to generate variable values for the parameter. Some useful
variables related to data loaded into QGIS can be added to your expression, so
you can select a value derived from any of these variables, such as the cell size
of a layer or the northernmost coordinate of another one.
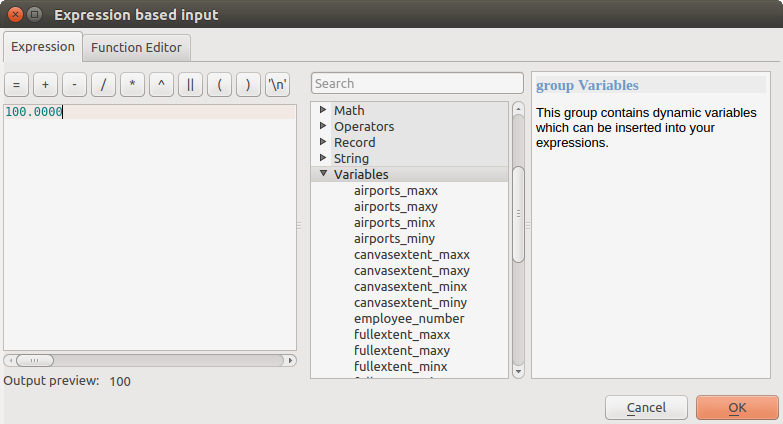
式に基づく入力
範囲 、2個のテキストボックスで最小値と最大値で指定されます.
テキストストリング 、1個のテキストボックスで指定されます.
フィールド 、ベクターレイヤーまたは別のパラメーターで選択された単一のテーブルの属性テーブルから選択します。
A coordinate reference system. You can select it among the recently used ones from the drop-down list or from the CRS selection dialog that appears when you click on the button on the right-hand side.
An extent, to be entered by four numbers representing its
xmin,xmax,ymin,ymaxlimits. Clicking on the button on the right-hand side of the value selector, a pop-up menu will appear, giving you options:to select the value from a layer or the current canvas extent;
or to define it by dragging directly onto the map canvas.

範囲セレクタ
最初のオプションを選択すると次のようなウィンドウが表示されます。
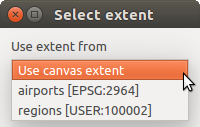
範囲リスト
2番目を選択した場合は、パラメーターウィンドウはそれ自身を非表示にしますので、キャンバスにクリックしてドラッグできます。選択した矩形を定義すると、ダイアログが再表示され、範囲テキストボックス内の値を格納します。
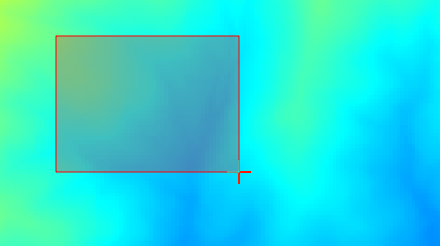
範囲ドラッグ
A list of elements (whether raster or vector layers, tables, fields) to select from. Click on the ... button at the left of the option to see a dialog like the following one. Multiple selection is allowed and when the dialog is closed, number of selected items is displayed in the parameter text box widget.
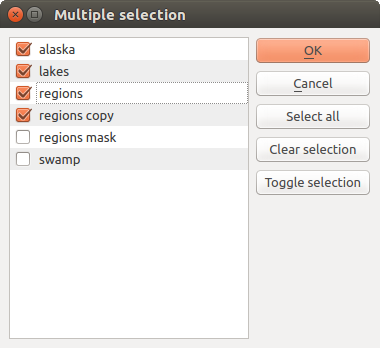
複数選択
小さなテーブル 、ユーザーによって編集されます。これらは、とりわけ、ルックアップテーブルまたはコンボリューションカーネルのようなパラメーターを定義するために使用されます。
右側にあるボタンをクリックするとテーブルを表示してその値を編集できます.
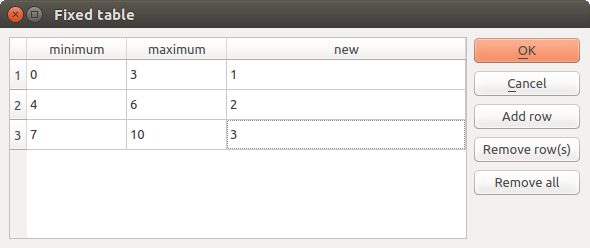
固定テーブル
アルゴリズムによっては、行数は、ウィンドウの右側にあるボタンを使用せずに変更できます。
注釈
Some algorithms require many parameter to run, e.g. in the
ラスタ計算機 you have to specify manually the cell size, the
extent and the CRS. You can avoid to choose all the parameters manually when
the algorithm has the Reference layers parameter. With this parameter you
can choose the reference layer and all its properties (cell size, extent, CRS)
will be used.
Along with the Parameters tab, there is another tab named Log (see figure below). Information provided by the algorithm during its execution is written in this tab, and allow you to track the execution and be aware and have more details about the algorithm as it runs. Notice that not all algorithms write information to this tab, and many of them might run silently without producing any output other than the final files.
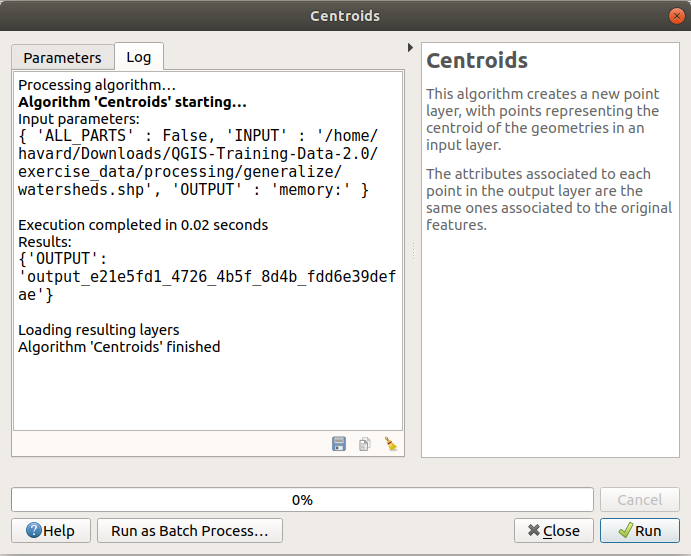
Algorithm Dialog - Log
At the bottom of the Log tab you will find buttons to
Save Log to File, Copy Log to Clipboard and Clear Log.
These are particularly handy when you have checked the
Keep dialog open after running algorithm in the General part
of the Processing options.
On the right hand side of the dialog you will find a short description of the algorithm, which will help you understand its purpose and its basic ideas. If such a description is not available, the description panel will not be shown.
For a more detailed help file, which might include description of every parameter it uses, or examples, you will find a Help button at the bottom of the dialog bringing you to the Processing algorithms documentation or to the provider documentation (for some third-party providers).
投影法についての記述
Processing algorithm execution are always performed in the input layer coordinate reference system (CRS). Due to QGIS's on-the-fly reprojecting capabilities, although two layers might seem to overlap and match, that might not be true if their original coordinates are used without reprojecting them onto a common coordinate system. Whenever you use more than one layer as input to a QGIS native algorithm, whether vector or raster, the layers will all be reprojected to match the coordinate reference system of the first input layer.
This is however less true for most of the external applications whose algorithms are exposed through the processing framework as they assume that all of the layers are already in a common coordinate system and ready to be analyzed.
By default, the parameters dialog will show a description of the CRS of each layer along with its name, making it easy to select layers that share the same CRS to be used as input layers. If you do not want to see this additional information, you can disable this functionality in the Processing settings dialog, unchecking the Show layer CRS definition in selection boxes option.
If you try to execute an algorithm using as input two or more layers with unmatching CRSs, a warning dialog will be shown. This occurs thanks to the Warn before executing if layer CRS's do not match option.
アルゴリズムは実行できますが、ほとんどの場合、入力レイヤーに重なる部分がないために空白レイヤーになるなど、間違った結果が生じることに注意してください。
ちなみに
Use Processing algorithms to do intermediate reprojection
When an algorithm can not successfully perform on multiple input layers due to unmatching CRSs, use QGIS internal algorithm such as Reproject layer to perform layers' reprojection to the same CRS before executing the algorithm using these outputs.
アルゴリズムによって生成されたデータオブジェクト
アルゴリズムによって生成されるデータオブジェクトは以下のタイプが利用できます:
ラスターレイヤー
ベクターレイヤー
テーブル
HTML ファイル (テキストとグラフィック出力の場合利用できます)
These are all saved to disk, and the parameters table will contain a text box corresponding to each one of these outputs, where you can type the output channel to use for saving it. An output channel contains the information needed to save the resulting object somewhere. In the most usual case, you will save it to a file, but in the case of vector layers, and when they are generated by native algorithms (algorithms not using external applications) you can also save to a PostGIS, GeoPackage or SpatiaLite database, or a memory layer.
出力チャンネルを選択するには、単にテキストボックスの右側にあるボタンをクリックすると、使用可能なオプションを備えた小型のコンテキストメニューが表示されます。
最も一般的なケースでは、ファイルに保存を選択します。そのオプションを選択した場合、目的のファイル・パスを選択でき、保存ファイルダイアログでプロンプトが表示されます。サポートされているファイルの拡張子は出力とアルゴリズムの種類に応じて、ダイアログのファイル形式セレクタに示されています。
The format of the output is defined by the filename extension. The supported
formats depend on what is supported by the algorithm itself. To select a format,
just select the corresponding file extension (or add it, if you are directly typing
the file path instead). If the extension of the file path you entered does not
match any of the supported formats, a default extension will be
appended to the file path, and the file format corresponding to that extension will
be used to save the layer or table. Default extensions are .dbf for
tables, .tif for raster layers and .gpkg for vector layers. These
can be modified in the setting dialog, selecting any other of the formats supported
by QGIS.
If you do not enter any filename in the output text box (or select the corresponding option in the context menu), the result will be saved as a temporary file in the corresponding default file format, and it will be deleted once you exit QGIS (take care with that, in case you save your project and it contains temporary layers).
You can set a default folder for output data objects. Go to the settings
dialog (you can open it from the
menu), and in the
General group, you will find a parameter named Output folder.
This output folder is used as the default path in case you type just a filename
with no path (i.e., myfile.shp) when executing an algorithm.
反復モードのベクターレイヤーを使用するアルゴリズムを実行する場合、入力されたファイルパスには、ベース名を使用し、反復のインデックスを表す数値を付加命名されているすべての生成されたファイルのためのベースパスとして使用されます。ファイルの拡張子(と形式)このようなすべての生成されたファイルに使用されます。
Apart from raster layers and tables, algorithms also generate graphics and text as HTML files. These results are shown at the end of the algorithm execution in a new dialog. This dialog will keep the results produced by any algorithm during the current session, and can be shown at any time by selecting from the QGIS main menu.
外部アプリケーションには(特に拡張子に制限がない)複数のファイルを出力とするものもありますが、それらは上記のカテゴリのいずれにも属しません。これらの出力ファイルはQGISによって処理される(開かれたり、現在のQGISプロジェクトに含まれる)ことはありません、なぜならほとんどの場合それらはQGISでサポートされていないファイル形式や要素に対応しているからです。これは、例えば、レーザー測量データに使用されるLASファイルの場合です。ファイルは作成されますが、QGIS作業セッションには何も新しいものは表示されません。
他の出力タイプのすべてに対し、アルゴリズムによってか生成されると、ファイルをロードするかどうかをアルゴリズムに指示するために使用できるチェックボックスがあります。デフォルトでは、すべてのファイルが開かれます。
オプションの出力はサポートされていません。つまり、すべての出力が作成されます。しかし、与えられた出力に興味がない場合は、対応するチェックボックスのチェックを外すことで、本質的にそれをオプションの出力のように動作させることができます(つまり、レイヤーがとにかく作成されるが、テキストボックスが空のままにした場合、それは一時ファイルに保存され、QGISを終了した後に削除されます)。


