Ausdrücke für das Beschriften verwenden 
Vektorlayereigenschaften
The Layer Properties dialog for a vector layer provides information about the layer, symbology settings and labeling options. If your vector layer has been loaded from a PostgreSQL/PostGIS datastore, you can also alter the underlying SQL for the layer by invoking the Query Builder dialog on the General tab. To access the Layer Properties dialog, double-click on a layer in the legend or right-click on the layer and select Properties from the pop-up menu.
Figure Vector Properties 1:
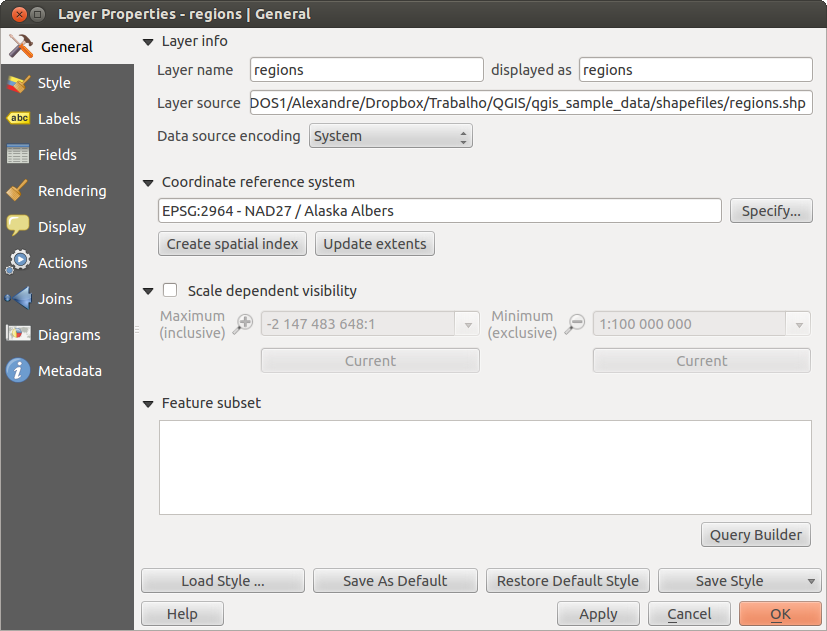
Vector Layer Properties Dialog
Menü Stil
The Style menu provides you with a comprehensive tool for rendering and symbolizing your vector data. You can use Layer rendering ‣ tools that are common to all vector data, as well as special symbolizing tools that were designed for the different kinds of vector data.
Renderers
The renderer is responsible for drawing a feature together with the correct symbol. There are four types of renderers: single symbol, categorized, graduated and rule-based. There is no continuous color renderer, because it is in fact only a special case of the graduated renderer. The categorized and graduated renderers can be created by specifying a symbol and a color ramp - they will set the colors for symbols appropriately. For point layers, there is a point displacement renderer available. For each data type (points, lines and polygons), vector symbol layer types are available. Depending on the chosen renderer, the Style menu provides different additional sections. On the bottom right of the symbology dialog, there is a [Symbol] button, which gives access to the Style Manager (see Presentation). The Style Manager allows you to edit and remove existing symbols and add new ones.
After having made any needed changes, the symbol can be added to the list of
current style symbols (using [Symbol]  Save in symbol library),
and then it can easily be used in the future. Furthermore, you can use the [Save Style] button to
save the symbol as a QGIS layer style file (.qml) or SLD file (.sld). SLDs can be exported from any type of renderer – single symbol,
categorized, graduated or rule-based – but when importing an SLD, either a
single symbol or rule-based renderer is created.
That means that categorized or graduated styles are converted to rule-based.
If you want to preserve those renderers, you have to stick to the QML format.
On the other hand, it can be very handy sometimes to have this easy way of
converting styles to rule-based.
Save in symbol library),
and then it can easily be used in the future. Furthermore, you can use the [Save Style] button to
save the symbol as a QGIS layer style file (.qml) or SLD file (.sld). SLDs can be exported from any type of renderer – single symbol,
categorized, graduated or rule-based – but when importing an SLD, either a
single symbol or rule-based renderer is created.
That means that categorized or graduated styles are converted to rule-based.
If you want to preserve those renderers, you have to stick to the QML format.
On the other hand, it can be very handy sometimes to have this easy way of
converting styles to rule-based.
Wenn Sie den Darstellungstyp beim Einstellen des Stils eines Vektorlayers ändern werden die Einstellungen für das Symbol beibehalten. Beachten Sie dass dieses Vorgehen nur für eine Änderunge funktioniert. Wenn Sie den Darstellungstyp wiederholt ändern gehen die Einstellungen für das Symbol verloren.
If the datasource of the layer is a database (PostGIS or Spatialite for example), you can save your layer style inside a table of the database. Just click on Save Style comboxbox and choose Save in database item then fill in the dialog to define a style name, add a description, an ui file and if the style is a default style. When loading a layer from the database, if a style already exists for this layer, QGIS will load the layer and its style. You can add several style in the database. Only one will be the default style anyway.
Figure Vector Properties 2:
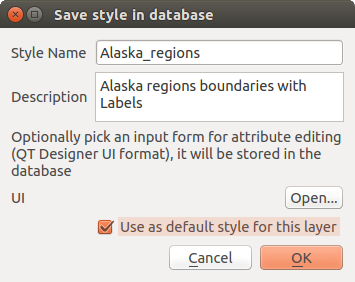
Save Style in database Dialog
Tipp
Auswahl und Ändern von Mehrfachsymbolen
Mit der Symbologie können Sie Mehrfachsymbole auswählen und Rechtsklicken um Farbe, Transparenz, Größe oder Breite der ausgewählten Einträge zu ändern.
Single Symbol Renderer
The Single Symbol Renderer is used to render all features of the layer using a single user-defined symbol. The properties, which can be adjusted in the Style menu, depend partially on the type of layer, but all types share the following dialog structure. In the top-left part of the menu, there is a preview of the current symbol to be rendered. On the right part of the menu, there is a list of symbols already defined for the current style, prepared to be used by selecting them from the list. The current symbol can be modified using the menu on the right side.
If you click on the first level in the Symbol layers dialog on the left side, it’s possible to define basic parameters like Size, Transparency, color and Rotation. Here, the layers are joined together.
Figure Symbology 3:
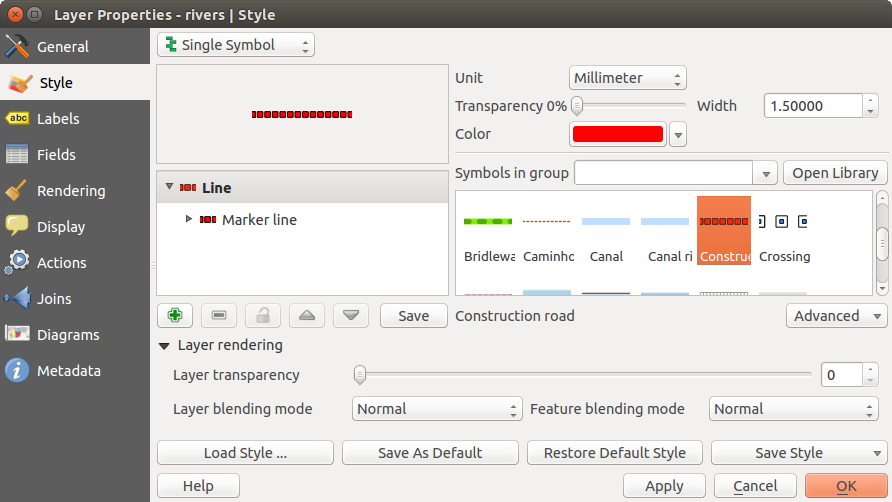
Single symbol line properties
In any spinbox in this dialog you can enter expressions. E.g. you can calculate simple math like multiplying the existing size of a point by 3 without resorting to a calculator.
Figure Symbology 4:
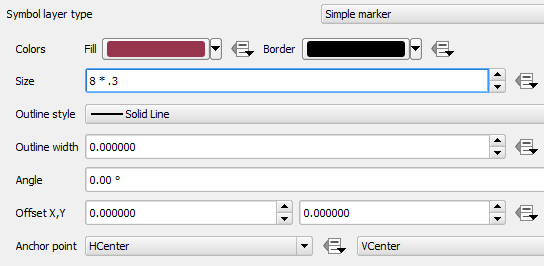
Expression in Size spinbox
If you click on the second level in the Symbol layers dialog a ‘Data-defined override’ for nearly all settings is possible. When using a data-defined color one may want to link the color to a field ‘budged’. Here a comment functionality is inserted.
/* This expression will return a color code depending on the field value.
 * Negative value: red
 * 0 value: yellow
 * Positive value: green
 */
CASE
  WHEN value < 0 THEN '#DC143C' -- Negative value: red
  WHEN value = 0 THEN '#CCCC00' -- Value 0: yellow
  ELSE '#228B22'                -- Positive value: green
END
Figure Symbology 5:

Data-defined symbol with Edit... menu
Categorized Renderer
The Categorized Renderer is used to render all features from a layer, using a single user-defined symbol whose color reflects the value of a selected feature’s attribute. The Style menu allows you to select:
- The attribute (using the Column listbox or the
 Set column expression function, see Ausdrücke)
 - The symbol (using the Symbol dialog)
- The colors (using the color Ramp listbox)
Then click on Classify button to create classes from the distinct value of the attribute column. Each classes can be disabled unchecking the checkbox at the left of the class name.
You can change symbol, value and/or label of the class, just double click on the item you want to change.
Right-click shows a contextual menu to Copy/Paste, Change color, Change transparency, Change output unit, Change symbol width.
The [Advanced] button in the lower-right corner of the dialog allows you to set the fields containing rotation and size scale information. For convenience, the center of the menu lists the values of all currently selected attributes together, including the symbols that will be rendered.
The example in figure_symbology_6 shows the category rendering dialog used for the rivers layer of the QGIS sample dataset.
Figure Symbology 6:
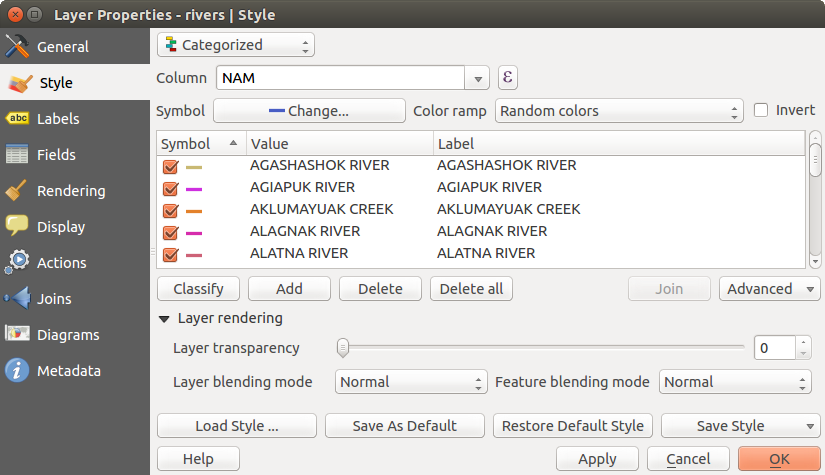
Categorized Symbolizing options
Graduated Renderer
The Graduated Renderer is used to render all the features from a layer, using a single user-defined symbol whose color reflects the assignment of a selected feature’s attribute to a class.
Figure Symbology 7:
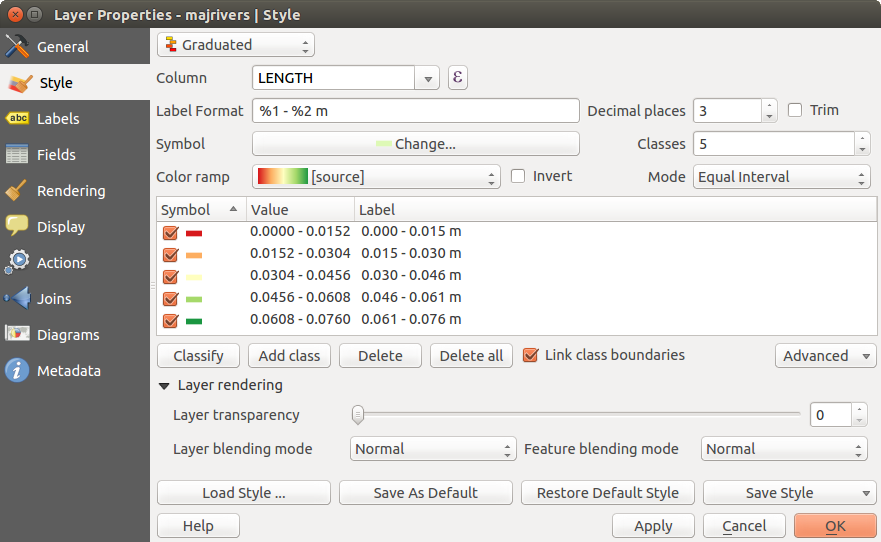
Graduated Symbolizing options
Like the Categorized Renderer, the Graduated Renderer allows you to define rotation and size scale from specified columns.
Also, analogous to the Categorized Renderer, the Style tab allows you to select:
- The attribute (using the Column listbox or the
Set column expression function, see Ausdrücke chapter)
- The symbol (using the Symbol Properties button)
- The colors (using the color Ramp list)
Additionally, you can specify the number of classes and also the mode for classifying features within the classes (using the Mode list). The available modes are:
Gleiches Intervall: jede Klasse hat die gleich Größe (z.B. Werte von 0 bis 16 und 4 Klassen, jede Klasse hat eine Größe von 4);
Quantil: jede Klasse beinhaltet die gleiche Anzahl von Elementen (nach der Idee eines Boxplots);
Natürliche Unterbrechungen (Jenks): die Varianz innerhalb jeder Klasse ist minimal währenddessen die Varianz zwischen Klassen maximal ist;
Standardabweichung: Klassen werden abhängig von der Standardabweichung der Werte erstellt;
- Pretty Breaks: the same of natural breaks but the extremes number of each class are integers.
Das Listenfeld im mittleren Teill des Stil Menüs führt die Klassen zusammen mit ihren Bereichen, Beschriftungen und Symbolen die dargestellt werden auf.
Click on Classify button to create classes using the choosen mode. Each classes can be disabled unchecking the checkbox at the left of the class name.
You can change symbol, value and/or label of the clic, just double clicking on the item you want to change.
Right-click shows a contextual menu to Copy/Paste, Change color, Change transparency, Change output unit, Change symbol width.
The example in figure_symbology_7 shows the graduated rendering dialog for the rivers layer of the QGIS sample dataset.
Tipp
Thematische Karten anhand von Ausdrücken erstellen
Categorized and graduated thematic maps can now be created using the result of an expression.
In the properties dialog for vector layers, the attribute chooser has been augmented with a
Set column expression function. So now you no longer
need to write the classification attribute to a new column in your attribute table if you want the
classification attribute to be a composite of multiple fields, or a formula of some sort.
Rule-based rendering
The Rule-based Renderer is used to render all the features from a layer, using rule based symbols whose color reflects the assignment of a selected feature’s attribute to a class. The rules are based on SQL statements. The dialog allows rule grouping by filter or scale, and you can decide if you want to enable symbol levels or use only the first-matched rule.
The example in figure_symbology_8 shows the rule-based rendering dialog for the rivers layer of the QGIS sample dataset.
To create a rule, activate an existing row by double-clicking on it, or click on ‘+’ and
click on the new rule. In the Rule properties dialog, you can define a label
for the rule. Press the  button to open the expression string builder. In
the Function List, click on Fields and Values to view all attributes of
the attribute table to be searched. To add an attribute to the field calculator Expression field,
double click its name in the Fields and Values list. Generally, you
can use the various fields, values and functions to construct the calculation
expression, or you can just type it into the box (see Ausdrücke).
You can create a new rule by copying and pasting an existing rule with the right mouse button.
You can also use the ‘ELSE’ rule that will be run if none of the other
rules on that level match.
Since QGIS 2.8 the rules appear in a tree hierarchy in the map legend. Just double-klick
the rules in the map legend and the Style menu of the layer properties appears showing the rule that
is the background for the symbol in the tree.
button to open the expression string builder. In
the Function List, click on Fields and Values to view all attributes of
the attribute table to be searched. To add an attribute to the field calculator Expression field,
double click its name in the Fields and Values list. Generally, you
can use the various fields, values and functions to construct the calculation
expression, or you can just type it into the box (see Ausdrücke).
You can create a new rule by copying and pasting an existing rule with the right mouse button.
You can also use the ‘ELSE’ rule that will be run if none of the other
rules on that level match.
Since QGIS 2.8 the rules appear in a tree hierarchy in the map legend. Just double-klick
the rules in the map legend and the Style menu of the layer properties appears showing the rule that
is the background for the symbol in the tree.
Figure Symbology 8:
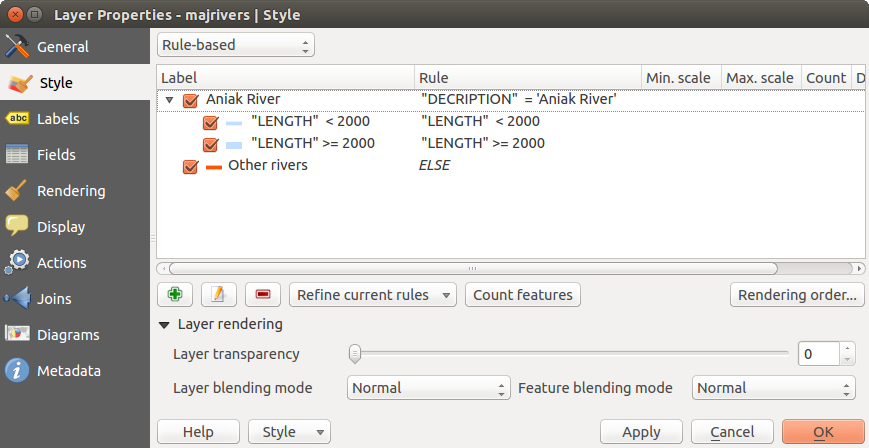
Rule-based Symbolizing options
Point displacement
The Point Displacement Renderer works to visualize all features of a point layer, even if they have the same location. To do this, the symbols of the points are placed on a displacement circle around a center symbol.
Figure Symbology 9:
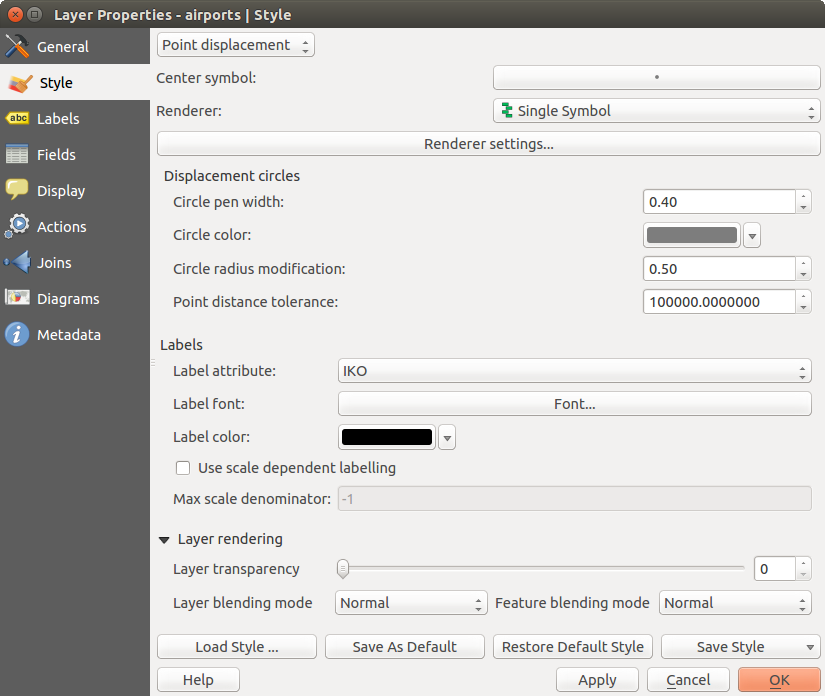
Point displacement dialog
Tipp
Symbologie exportierten
You have the option to export vector symbology from QGIS into Google *.kml, *.dxf and MapInfo *.tab files. Just open the right mouse menu of the layer and click on Save selection as ‣ to specify the name of the output file and its format. In the dialog, use the Symbology export menu to save the symbology either as Feature symbology ‣ or as Symbol layer symbology ‣. If you have used symbol layers, it is recommended to use the second setting.
Inverted Polygon
Inverted polygon renderer allows user to define a symbol to fill in outside of the layer’s polygons. As before you can select subrenderers. These subrenderers are the same as for the main renderers.
Figure Symbology 10:
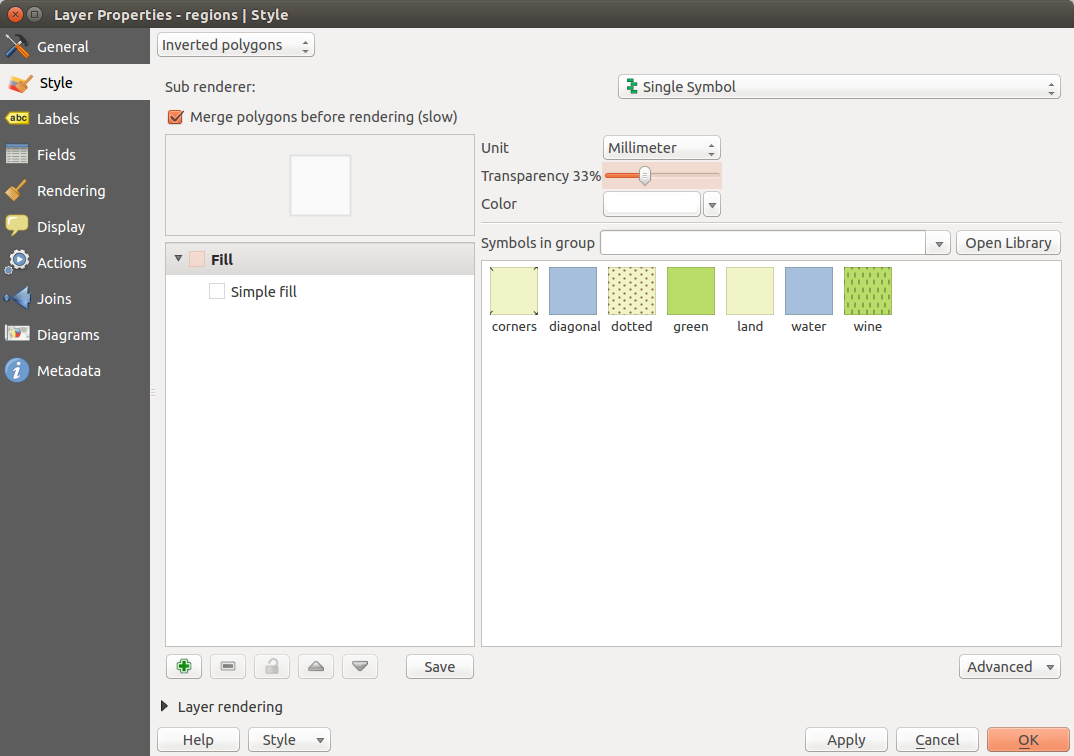
Inverted Polygon dialog
Tipp
Switch quickly between styles
Once you created one of the above mentioned styles you can right-klick on the layer and choose Styles ‣ Add to save your style. Now you can easily switch between styles you created using the Styles ‣ menu again.
Heatmap
With the Heatmap renderer you can create live dynamic heatmaps for (multi)point layers. You can specify the heatmap radius in pixels, mm or map units, choose a color ramp for the heatmap style and use a slider for selecting a tradeoff between render speed and quality. When adding or removing a feature the heatmap renderer updates the heatmap style automatically.
Color Picker
Regardless the type of style to be used, the select color dialog will show when you click to choose a
color - either border or fill color. This dialog has four different tabs which allow you to select colors by  color ramp,
 color wheel,
  color swatches or
  color picker.
Whatever method you use, the selected color is always described through color sliders for HSV (Hue, Saturation, Value) and RGB (Red, Green, Blue) values. There is also an opacity slider to set transparency level. On the lower left part of the dialog you can see a comparison between the current and the new color you are presently selecting and on the lower right part you have the option to add the color you just tweaked into a color slot button.
Figure color picker 1:
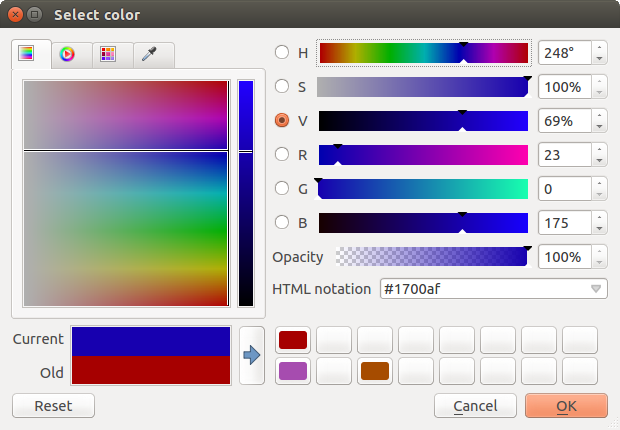
Color picker ramp tab
With color ramp or with color wheel, you can browse to all possible color combinations.
There are other possibilities though. By using color swatches you can choose from a preselected list. This selected list is
populated with one of three methods: Recent colors, Standard colors or Project colors
Figure color picker 2:

Color picker swatcher tab
Another option is to use the color picker which allows you to sample a color from under your mouse pointer at any part of
QGIS or even from another application by pressing the space bar. Please note that the color picker is OS dependent and is currently not supported by OSX.
Tipp
quick color picker + copy/paste colors
You can quickly choose from Recent colors, from Standard colors or simply copy or paste a color by clicking the drop-down arrow that follows a current color box.
Figure color picker 3:
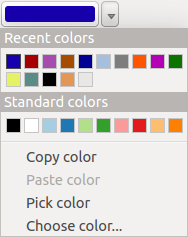
Quick color picker menu
Layerdarstellung
Layertransparenz
 : Sie können den unten liegenden Layer in der Kartenansicht mit diesem Werkzeug sichtbar machen. Verwenden Sie den Slider um die Sichtbarkeit Ihres Vektorlayers an Ihre Bedürfnisse anzupassen. Sie können auch eine genaue Definition des Prozentgrades der Sichtbarkeit im Menü neben dem Slider vornehmen.
- Layer blending mode and Feature blending mode: You can achieve special rendering effects with these tools that you may
previously only know from graphics programs. The pixels of your overlaying and underlaying layers are mixed
through the settings described below.
- Normal: This is the standard blend mode, which uses the alpha channel of the top pixel to blend with the pixel beneath it. The colors aren’t mixed.
- Lighten: This selects the maximum of each component from the foreground and background pixels. Be aware that the results tend to be jagged and harsh.
- Screen: Light pixels from the source are painted over the destination, while dark pixels are not. This mode is most useful for mixing the texture of one layer with another layer (e.g., you can use a hillshade to texture another layer).
- Dodge: Dodge will brighten and saturate underlying pixels based on the lightness of the top pixel. So, brighter top pixels cause the saturation and brightness of the underlying pixels to increase. This works best if the top pixels aren’t too bright; otherwise the effect is too extreme.
- Addition: This blend mode simply adds pixel values of one layer with the other. In case of values above one (in the case of RGB), white is displayed. This mode is suitable for highlighting features.
- Darken: This creates a resultant pixel that retains the smallest components of the foreground and background pixels. Like lighten, the results tend to be jagged and harsh.
- Multiply: Here, the numbers for each pixel of the top layer are multiplied with the corresponding pixels for the bottom layer. The results are darker pictures.
- Burn: Darker colors in the top layer cause the underlying layers to darken. Burn can be used to tweak and colorise underlying layers.
- Overlay: This mode combines the multiply and screen blending modes. In the resulting picture, light parts become lighter and dark parts become darker.
- Soft light: This is very similar to overlay, but instead of using multiply/screen it uses color burn/dodge. This is supposed to emulate shining a soft light onto an image.
- Hard light: Hard light is also very similar to the overlay mode. It’s supposed to emulate projecting a very intense light onto an image.
- Difference: Difference subtracts the top pixel from the bottom pixel, or the other way around, to always get a positive value. Blending with black produces no change, as the difference with all colors is zero.
- Subtract: This blend mode simply subtracts pixel values of one layer from the other. In case of negative values, black is displayed.
Menü Beschriftungen
The  Labels core application provides smart
labeling for vector point, line and polygon layers, and it only requires a
few parameters. This new application also supports on-the-fly transformed layers.
The core functions of the application have been redesigned. In QGIS, there are a
number of other features that improve the labeling. The following menus
have been created for labeling the vector layers:
Labels core application provides smart
labeling for vector point, line and polygon layers, and it only requires a
few parameters. This new application also supports on-the-fly transformed layers.
The core functions of the application have been redesigned. In QGIS, there are a
number of other features that improve the labeling. The following menus
have been created for labeling the vector layers:
- Text
Formatierung
Puffer
Hintergrund
Schatten
Platzierung
Darstellung
Let us see how the new menus can be used for various vector layers.
Labeling point layers
Start QGIS and load a vector point layer. Activate the layer in the legend and click on the
Layer Labeling Options icon in the QGIS toolbar menu.
The first step is to activate the  Label this layer with checkbox
and select an attribute column to use for labeling. Click if you
want to define labels based on expressions - See labeling_with_expressions.
Label this layer with checkbox
and select an attribute column to use for labeling. Click if you
want to define labels based on expressions - See labeling_with_expressions.
The following steps describe a simple labeling without using the Data defined override functions, which are situated next to the drop-down menus.
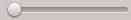
You can define the text style in the Text menu (see Figure_labels_1 ). Use the Type case option to influence the text rendering. You have the possibility to render the text ‘All uppercase’, ‘All lowercase’ or ‘Capitalize first letter’. Use the blend modes to create effects known from graphics programs (see blend_modes).
In the Formatting menu, you can define a character for a line break in the labels with the ‘Wrap on character’ function.
Use the Formatted numbers option to format the numbers in an attribute table. Here,
decimal places may be inserted. If you enable this option, three decimal places are initially set by default.
To create a buffer, just activate the Draw text buffer checkbox in the Buffer menu.
The buffer color is variable. Here, you can also use blend modes (see blend_modes).
If the color buffer’s fill checkbox is activated, it will interact with partially transparent
text and give mixed color transparency results. Turning off the buffer fill fixes that issue (except where the interior
aspect of the buffer’s stroke intersects with the text’s fill) and also allows you to make outlined text.
In the Background menu, you can define with Size X and Size Y the shape of your background. Use Size type to insert an additional ‘Buffer’ into your background. The buffer size is set by default here. The background then consists of the buffer plus the background in Size X and Size Y. You can set a Rotation where you can choose between ‘Sync with label’, ‘Offset of label’ and ‘Fixed’. Using ‘Offset of label’ and ‘Fixed’, you can rotate the background. Define an Offset X,Y with X and Y values, and the background will be shifted. When applying Radius X,Y, the background gets rounded corners. Again, it is possible to mix the background with the underlying layers in the map canvas using the Blend mode (see blend_modes).
Use the Shadow menu for a user-defined Drop shadow. The drawing of the background is very variable.
Choose between ‘Lowest label component’, ‘Text’, ‘Buffer’ and ‘Background’. The Offset angle depends on the orientation
of the label. If you choose the Use global shadow checkbox, then the zero point of the angle is
always oriented to the north and doesn’t depend on the orientation of the label. You can influence the appearance of the shadow
with the Blur radius. The higher the number, the softer the shadows. The appearance of the drop shadow can also be altered by choosing a blend mode (see blend_modes).
Choose the Placement menu for the label placement and the labeling priority. Using the
 Offset from point setting, you now have the option to use Quadrants
to place your label. Additionally, you can alter the angle of the label placement with the Rotation setting.
Thus, a placement in a certain quadrant with a certain rotation is possible.
In the priority section you can define with which priority the labels are rendered.
It interacts with labels of the other vector layers in the map canvas. If there are labels from different layers
in the same location then the label with the higher priority will be displayed and the other will be
left out.
Offset from point setting, you now have the option to use Quadrants
to place your label. Additionally, you can alter the angle of the label placement with the Rotation setting.
Thus, a placement in a certain quadrant with a certain rotation is possible.
In the priority section you can define with which priority the labels are rendered.
It interacts with labels of the other vector layers in the map canvas. If there are labels from different layers
in the same location then the label with the higher priority will be displayed and the other will be
left out.
In the Rendering menu, you can define label and feature options. Under Label options,
you find the scale-based visibility setting now. You can prevent QGIS from rendering only selected labels with
the Show all labels for this layer (including colliding labels) checkbox.
Under Feature options, you can define whether every part of a multipart feature is to be labeled. It’s possible to define
whether the number of features to be labeled is limited and to Discourage labels from covering features.
Figure Labels 1:
Smart labeling of vector point layers
Labeling line layers
The first step is to activate the Label this layer checkbox
in the Label settings tab and select an attribute column to use for
labeling. Click if you
want to define labels based on expressions - See labeling_with_expressions.
After that, you can define the text style in the Text menu. Here, you can use the same settings as for point layers.
Also, in the Formatting menu, the same settings as for point layers are possible.
The Buffer menu has the same functions as described in section labeling_point_layers.
The Background menu has the same entries as described in section labeling_point_layers.
Also, the Shadow menu has the same entries as described in section labeling_point_layers.
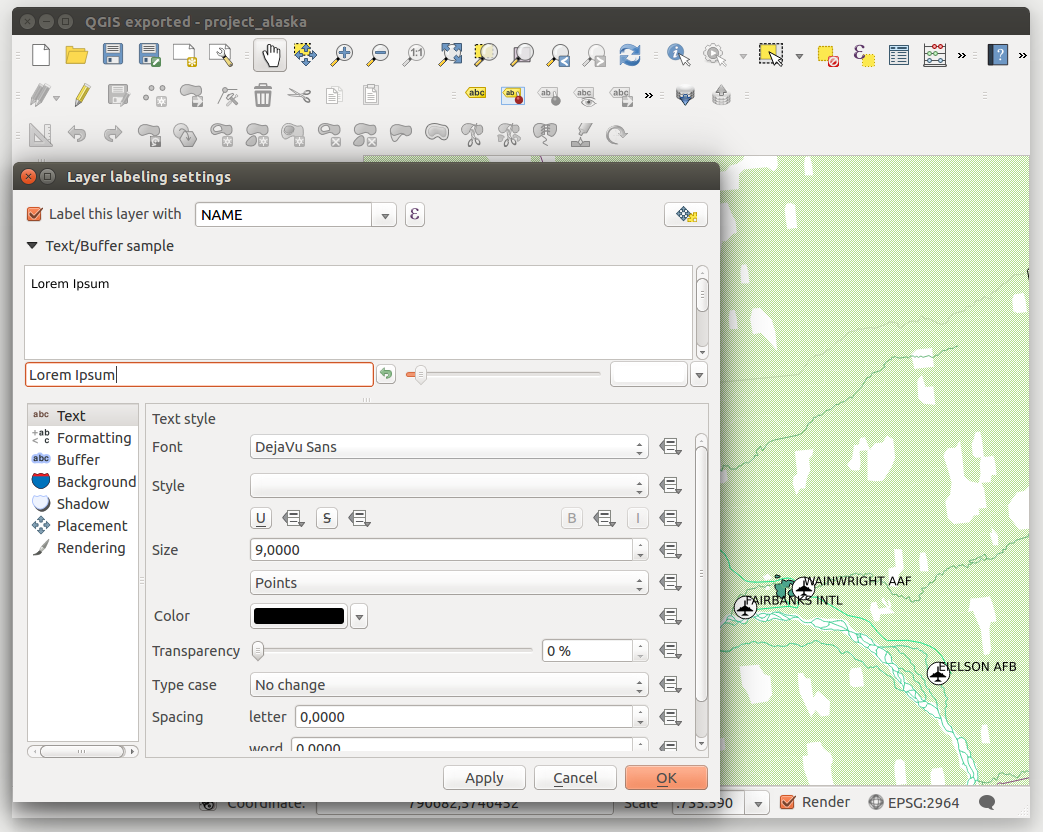
In the Placement menu, you find special settings for line layers. The label can be placed
Parallel,  Curved or Horizontal.
With the Parallel and Curved option, you can define the position Above line, On line
and Below line. It’s possible to select several options at once.
In that case, QGIS will look for the optimal position of the label. Remember that here you can
also use the line orientation for the position of the label.
Additionally, you can define a Maximum angle between curved characters when
selecting the Curved option (see Figure_labels_2 ).
Curved or Horizontal.
With the Parallel and Curved option, you can define the position Above line, On line
and Below line. It’s possible to select several options at once.
In that case, QGIS will look for the optimal position of the label. Remember that here you can
also use the line orientation for the position of the label.
Additionally, you can define a Maximum angle between curved characters when
selecting the Curved option (see Figure_labels_2 ).
You can set up a minimum distance for repeating labels. Distance can be in mm or in map units.
Some Placement setup will display more options, for example, Curved and Parallel Placements will allow the user to set up the position of the label (above, below or on the line), distance from the line and for Curved, the user can also setup inside/outside max angle between curved label. As for point vector layers you have the possibility to define a Priority for the labels.
The Rendering menu has nearly the same entries as for point layers. In the Feature options, you can now Suppress labeling of features smaller than.
Figure Labels 2:
Smart labeling of vector line layers
Labeling polygon layers
The first step is to activate the Label this layer checkbox
and select an attribute column to use for labeling. Click if you
want to define labels based on expressions - See labeling_with_expressions.
In the Text menu, define the text style. The entries are the same as for point and line layers.
The Formatting menu allows you to format multiple lines, also similar to the cases of point and line layers.
As with point and line layers, you can create a text buffer in the Buffer menu.
Use the Background menu to create a complex user-defined background for the polygon layer. You can use the menu also as with the point and line layers.
The entries in the Shadow menu are the same as for point and line layers.
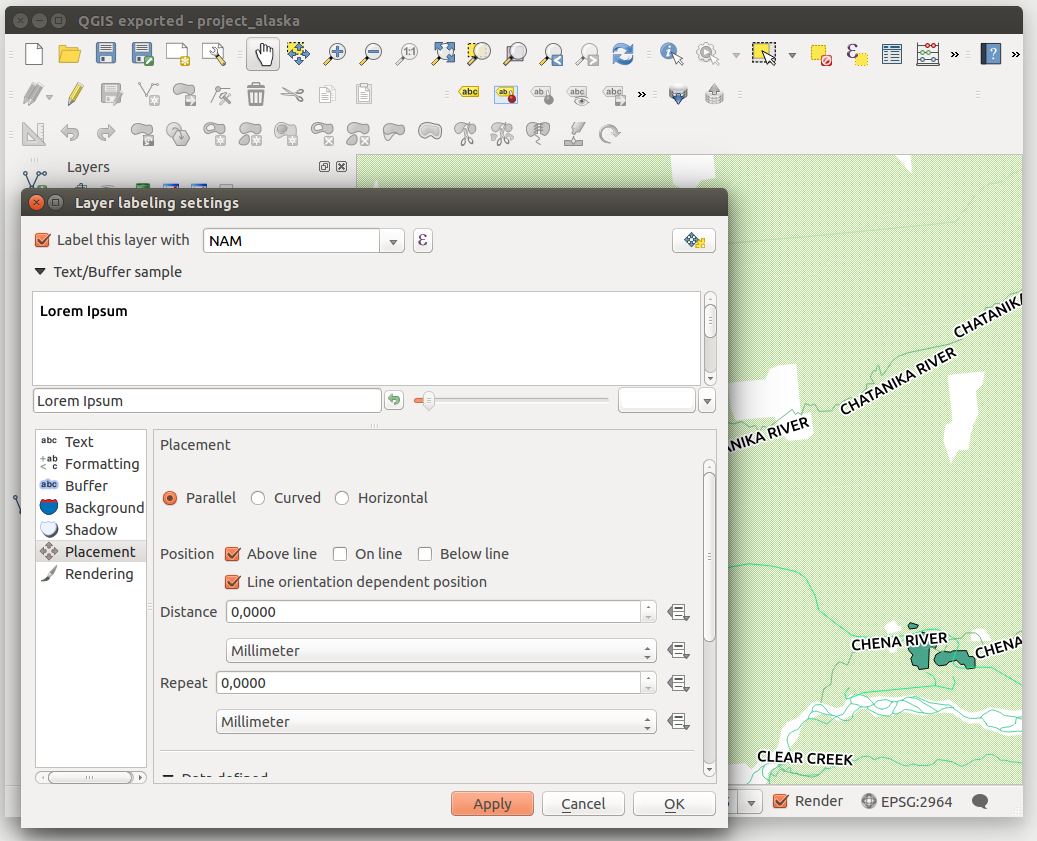
In the Placement menu, you find special settings for polygon layers (see Figure_labels_3).
Offset from centroid, Horizontal (slow),
Around centroid, Free and
Using perimeter are possible.
In the Offset from centroid settings, you can specify if the centroid
is of the visible polygon or whole polygon.
That means that either the centroid is used for the polygon you can see on the map or the centroid is
determined for the whole polygon, no matter if you can see the whole feature on the map.
You can place your label with the quadrants here, and define offset and rotation.
The Around centroid setting makes it possible to place the label
around the centroid with a certain distance. Again, you can define visible polygon
or whole polygon for the centroid.
With the Using perimeter settings, you can define a position and
a distance for the label. For the position, Above line, On line,
Below line and Line orientation dependent position are possible.
Related to the choice of Label Placement, several options will appear. As for Point Placement you can choose the distance for the polygon outline, repeat the label around the polygon perimeter.
As for point and line vector layers you have the possibility to define a Priority for the polygon vector layer.
The entries in the Rendering menu are the same as for line layers. You can also use Suppress labeling of features smaller than in the Feature options.
Figure Labels 3:
Smart labeling of vector polygon layers
Define labels based on expressions
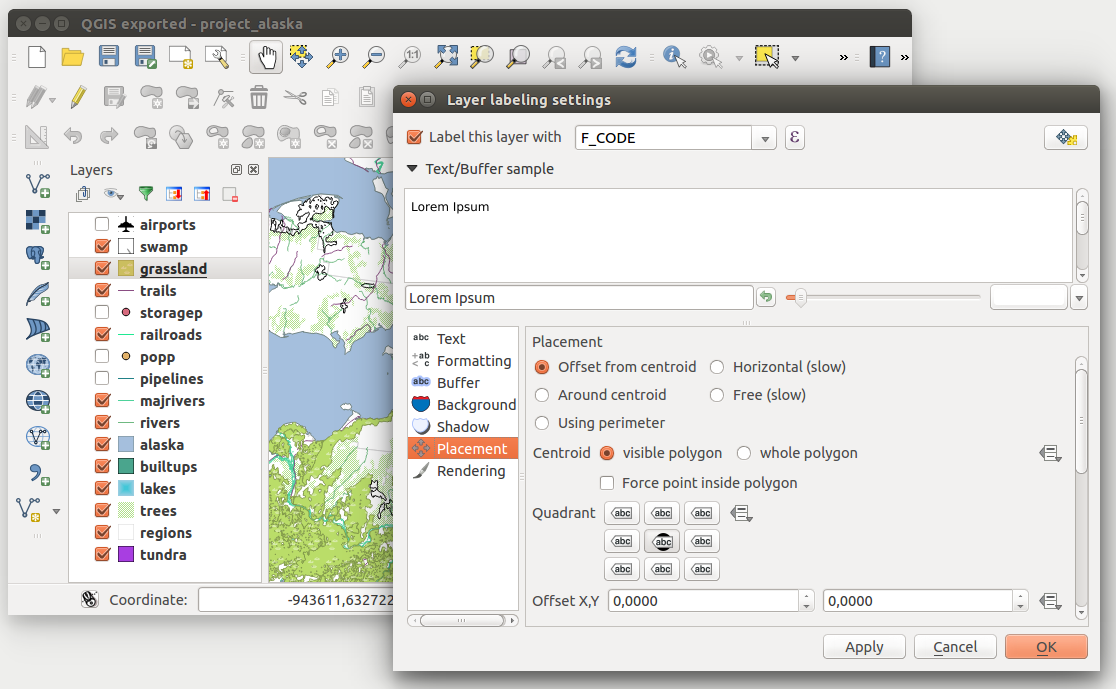
QGIS allows to use expressions to label features. Just click the
icon in the Labels
menu of the properties dialog. In figure_labels_4 you see a sample expression
to label the alaska regions with name and area size, based on the field ‘NAME_2’,
some descriptive text and the function ‘$area()’ in combination with
‘format_number()’ to make it look nicer.
Figure Labels 4:
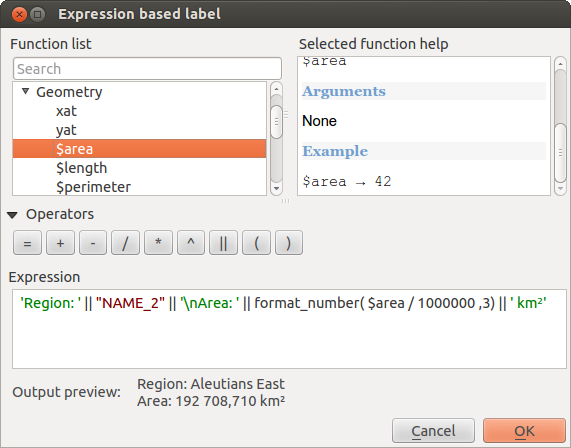
Using expressions for labeling
Expression based labeling is easy to work with. All you have to take care of is, that you need to combine all elements (strings, fields and functions) with a string concatenation sign ‘||’ and that fields a written in “double quotes” and strings in ‘single quotes’. Let’s have a look at some examples:
 # label based on two fields 'name' and 'place' with a comma as separater
 "name" || ', ' || "place"

 -> John Smith, Paris

 # label based on two fields 'name' and 'place' separated by comma
 'My name is ' || "name" || 'and I live in ' || "place"

 -> My name is John Smith and I live in Paris

 # label based on two fields 'name' and 'place' with a descriptive text
 # and a line break (\n)
 'My name is ' || "name" || '\nI live in ' || "place"

 -> My name is John Smith
    I live in Paris

 # create a multi-line label based on a field and the $area function
 # to show the place name and its area size based on unit meter.
 'The area of ' || "place" || 'has a size of ' || $area || 'm²'

 -> The area of Paris has a size of 105000000 m²

 # create a CASE ELSE condition. If the population value in field
 # population is <= 50000 it is a town, otherwise a city.
 'This place is a ' || CASE WHEN "population <= 50000" THEN 'town' ELSE 'city' END

-> This place is a town
As you can see in the expression builder, you have hundreds of functions available to create simple and very complex expressions to label your data in QGIS. See Ausdrücke chapter for more information and examples on expressions.
Using data-defined override for labeling
With the data-defined override functions, the settings for the labeling
are overridden by entries in the attribute table.
You can activate and deactivate the function with the right-mouse button.
Hover over the symbol and you see the information about the data-defined override,
including the current definition field.
We now describe an example using the data-defined override function for the
 Move label function (see figure_labels_5 ).
- Import
lakes.shpfrom the QGIS sample dataset. - Double-click the layer to open the Layer Properties. Click on Labels
and Placement. Select Offset from centroid.
- Look for the Data defined entries. Click the
 icon to
define the field type for the Coordinate. Choose ‘xlabel’ for X and ‘ylabel’
for Y. The icons are now highlighted in yellow.
icon to
define the field type for the Coordinate. Choose ‘xlabel’ for X and ‘ylabel’
for Y. The icons are now highlighted in yellow. Zoomen Sie auf einen See.
- Go to the Label toolbar and click the icon. Now you can shift the label
manually to another position (see figure_labels_6 ). The new position of the label is saved in the ‘xlabel’ and ‘ylabel’ columns of the
attribute table.
Figure Labels 5:
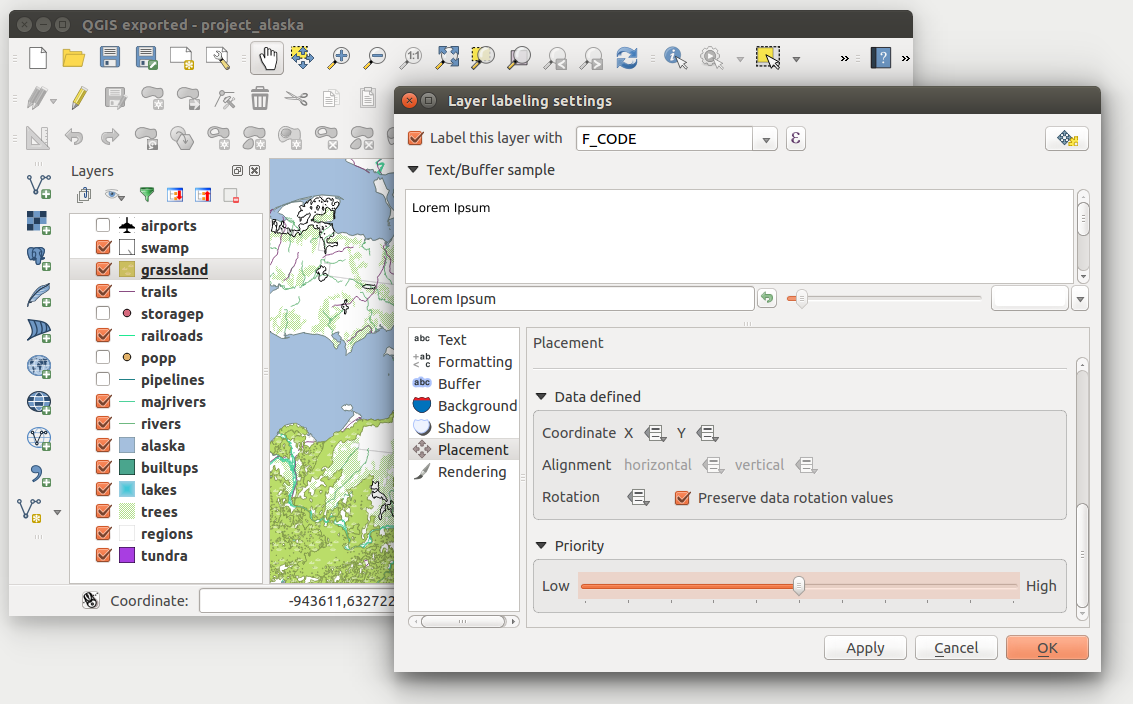
Labeling of vector polygon layers with data-defined override
Figure Labels 6:

Move labels
Menü Felder
 Within the Fields menu, the field attributes of the
selected dataset can be manipulated. The buttons
Within the Fields menu, the field attributes of the
selected dataset can be manipulated. The buttons  New Column and
  Delete Column
can be used when the dataset is in
Delete Column
can be used when the dataset is in  Editing mode.
Bearbeitungselement
Figure Fields 1:
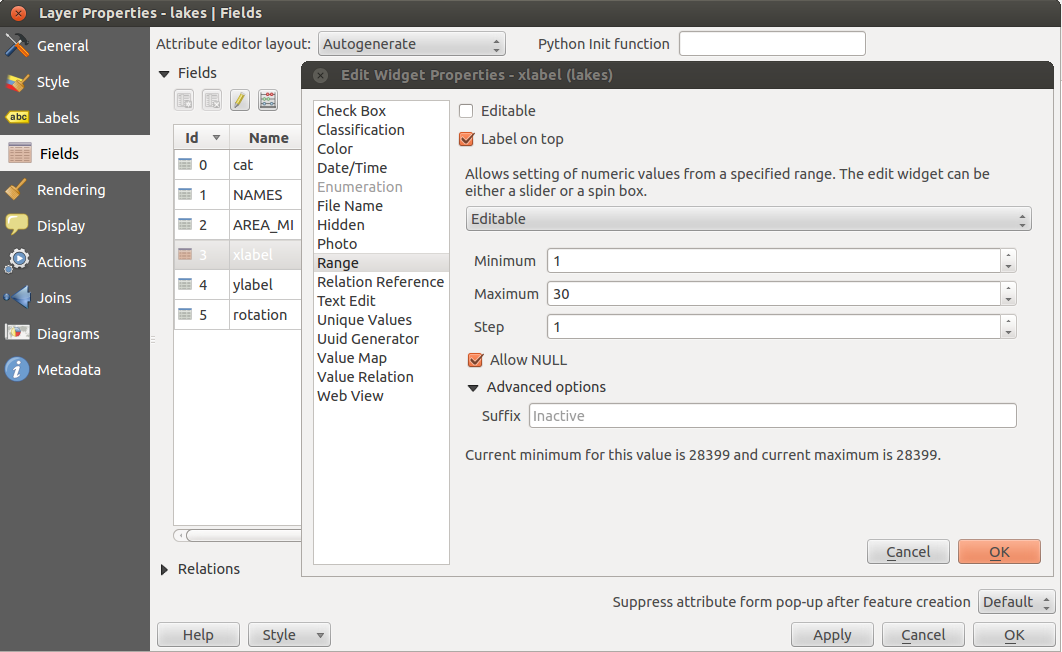
Dialog to select an edit widget for an attribute column
Innerhalb des Menüs Felder finden Sie auch eine Bearbeitungselement Spalte. Diese Spalte kann dazu benutzt werden Werte oder eine Spanne von Werten zu definieren die zu der bestimmten Attributtabellenspalte hinzugefügt werden dürfen. Wenn Sie auf den [Eingabezeile] Knopf klicken öffnet sich ein Dialog indem Sie verschiedene Elemente definieren können. Diese Elemente sind:
Kontrollkästchen: Gibt ein Kontrollkästchen wieder und Sie können definieren welches Attribut der Spalte hinzugefügt wird wenn das Kontrollkästchen aktiviert ist oder nicht.
Klassifikation: Auswahlliste mit den Attributwerten, die im Menü Stil als Legendentyp Eindeutiger Wert für die Klassifikation benutzt werden.
**Farbe*: Stellt einen Farbknopf dar, der es dem Anwender ermöglicht eine Farbe von einem Farbdialogfenster auszuwählen.
- Date/Time: Displays a line field which can open a calendar widget to enter a date, a time or both. Column type must be text. You can select a custom format, pop-up a calendar, etc.
Aufzählung: Öffnet eine Kombobox mit Werten die innerhalb eines Spaltentyps benutzt werden können. Dieses wird aktuell nur vom PostgreSQL Provider untersützt.
Dateiname: Vereinfacht die Dateiauswahl durch einen Dateiauswahldialog.
Versteckt: Ein verstecktes Attribut ist unsichtbar. Der Anwender kann den Inhalt nicht sehen.
Foto: Feld enthält einen Dateinamen für ein Bild. Die Breite und Höhe des Feldes kann definiert werden.
Bereich: Erlaubt Ihnen numerische Werte eines bestimmten Wertebereichs festzulegen. Das Bearbeitungselement kann entweder ein Schieber oder ein Drehfeld sein.
- Relation Reference: This widged lets you embed the feature form of the referenced layer on the feature form of the actual layer. See Creating one to many relations.
Texteditor (voreingestellt): Dies öffnet einen Textbearbeitungsfeld mit dem Sie einfachen Text oder mehrere Zeilen verwenden können. Wenn Sie mehrzeilig gewählt haben können Sie auch HTML wählen.
Eindeutige Werte: Sie können einen der Werte die bereits in der Attributtabelle verwendet werden aussuchen. Wenn ‘Änderbar’ aktiviert ist, wird eine Eingabezeile mit Autovervollständigungsunterstützung gezeigt, andernfalls wird eine Kombobox verwendet.
UUID Generator: Erstellt ein schreibgeschütztes UUID (Universally Unique Identifiers)-Feld wenn es leer ist.
Wertabbildung: Eine Kombobox mit vordefinierten Elementen. Der Wert ist im Attribut gespeichert, die Beschreibung wird in der Kombobox gezeigt. Sie können Werte manuell definieren oder sie aus einem Layer oder einer CSV-Datei laden.
- Value Relation: Offers values from a related table in a combobox. You can select layer, key column and value column.
Webansicht: Feld enthält eine URL. Die Breite und Höhe des Feldes ist variabel.
Bemerkung
QGIS has an advanced ‘hidden’ option to define your own field widget using python and add it to this impressive list of widgets. It is tricky but it is very well explained in following excellent blog that explains how to create a real time validation widget that can be used like described widgets. See http://blog.vitu.ch/10142013-1847/write-your-own-qgis-form-elements
With the Attribute editor layout, you can now define built-in forms (see figure_fields_2). This is usefull for data entry jobs or to identify objects using the option auto open form when you have objects with many attributes. You can create an editor with several tabs and named groups to present the attribute fields.
Choose ‘Drag and drop designer’ and an attribute column. Use the  icon to create
a category to insert a tab or a named group (see figure_fields_3).
When creating a new category, QGIS will insert a new tab or named group for the category in the built-in form.
The next step will be to assign the relevant fields to a selected category
with the
icon to create
a category to insert a tab or a named group (see figure_fields_3).
When creating a new category, QGIS will insert a new tab or named group for the category in the built-in form.
The next step will be to assign the relevant fields to a selected category
with the  icon. You can create more categories and use the
same fields again.
icon. You can create more categories and use the
same fields again.
Other options in the dialog are ‘Autogenerate’ and ‘Provide ui-file’.
- ‘Autogenerate’ just creates editors for all fields and tabulates them.
- The ‘Provide ui-file’ option allows you to use complex dialogs made with the Qt-Designer. Using a UI-file allows a great deal of freedom in creating a dialog. For detailed information, see http://nathanw.net/2011/09/05/qgis-tips-custom-feature-forms-with-python-logic/.
QGIS dialogs can have a Python function that is called when the dialog is opened. Use this function to add extra logic to your dialogs. An example is (in module MyForms.py):
def open(dialog,layer,feature):
geom = feature.geometry()
control = dialog.findChild(QWidged,"My line edit")
Reference in Python Init Function like so: MyForms.open
MyForms.py must live on PYTHONPATH, in .qgis2/python, or inside the project folder.
Figure Fields 2:
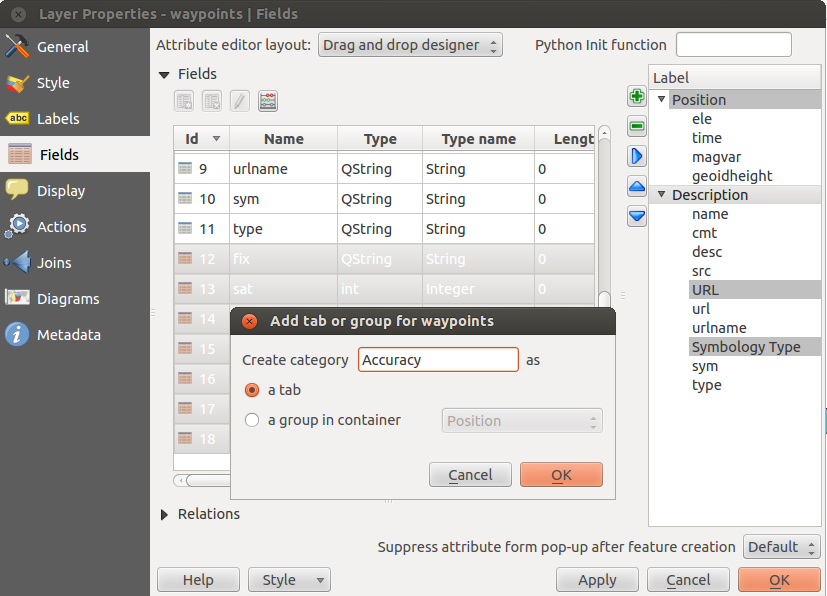
Dialog Attributeditorzusammenstellung um Kategorien zu erstellen
Figure Fields 3:
Resulting built-in form with tabs and named groups
Menü Allgemein
 Verwenden Sie dieses Menü um allgemeine Einstellungen für den Vektorlayer zu machen. Es stehen mehrere Optionen zur Verfügung:
Layerinformation
Ändern Sie den Anzeigenamen des Layers in angezeigt als
Definieren Sie die Layerquelle des Vektorlayers
Definieren Sie Datenquellenkodierung um providerspezifische Optionen zu definieren und um in der Lage zu sein die Datei zu lesen.
Koordinatenbezugssystem
Verwenden Sie Festlegen für das Koordinatensystem. Hier können Sie die Projektion eines bestimmten Vektorlayers ansehen oder verändern.
Erstellen Sie einen Räumlichen Index (nur OGR-unterstützte Formate)
Die Ausmaße aktualisieren für einen Layer
Sehen Sie sich die Projektion eins spezifischen Vektorlayers an oder ändern Sie diese indem Sie auf Festlegen ... klicken.
Scale dependent visibility
- You can set the Maximum (inclusive) and Minimum (exclusive) scale. The scale can also be set by the [Current] buttons.
Feature subset
- With the [Query Builder] button, you can create a subset of the features in the layer that will be visualized (also refer to section Abfrageeditor).
Figure General 1:
General menu in vector layers properties dialog
Menü Darstellung
QGIS 2.2 introduces support for on-the-fly feature generalisation. This can improve rendering times
when drawing many complex features at small scales. This feature can be enabled or disabled in the
layer settings using the Simplify geometry option. There is also a new global
setting that enables generalisation by default for newly added layers (see section Optionen).
Note: Feature generalisation may introduce artefacts into your rendered output in some cases.
These may include slivers between polygons and inaccurate rendering when using offset-based symbol layers.
Menü Darstellung
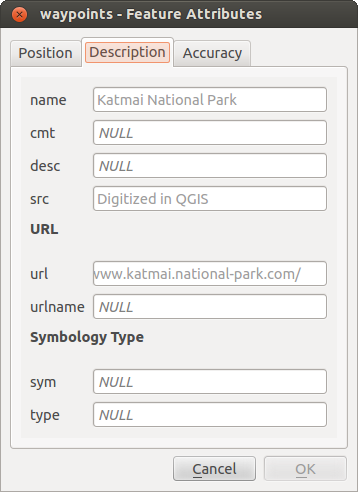
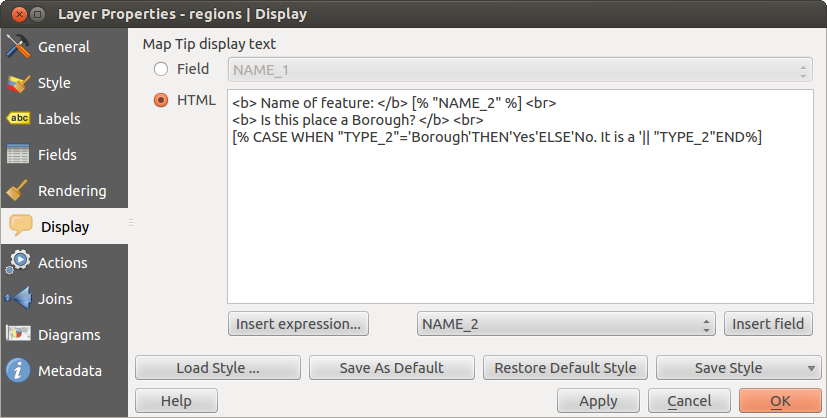
 This menu is specifically created for Map Tips. It includes a new feature:
Map Tip display text in HTML. While you can still choose a Field
to be displayed when hovering over a feature on the map, it is now possible to insert HTML code that creates a complex
display when hovering over a feature. To activate Map Tips, select the menu option View ‣ MapTips. Figure Display 1 shows an example of HTML code.
This menu is specifically created for Map Tips. It includes a new feature:
Map Tip display text in HTML. While you can still choose a Field
to be displayed when hovering over a feature on the map, it is now possible to insert HTML code that creates a complex
display when hovering over a feature. To activate Map Tips, select the menu option View ‣ MapTips. Figure Display 1 shows an example of HTML code.
Figure Display 1:
HTML code for map tip
Figure Display 2:
Map tip made with HTML code
Actions Menu
 QGIS provides the ability to perform an action based on the attributes
of a feature. This can be used to perform any number of actions, for example,
running a program with arguments built from the attributes of a feature or
passing parameters to a web reporting tool.
QGIS provides the ability to perform an action based on the attributes
of a feature. This can be used to perform any number of actions, for example,
running a program with arguments built from the attributes of a feature or
passing parameters to a web reporting tool.
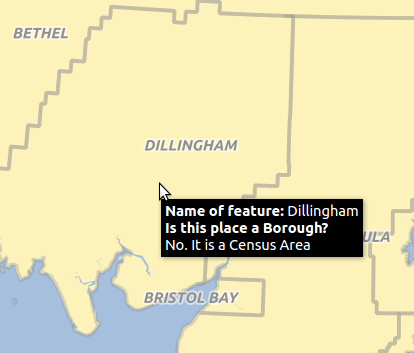
Figure Actions 1:
Overview action dialog with some sample actions
Aktionen auf Basis von Attributen sind sinnvoll wenn sie häufig eine externe Anwendung starten oder eine Internetseite auf Basis von einem oder mehreren Werten in Ihrem Vektorlayer visualisieren wollen. Sie sind in 6 Typen aufgeteilt und können wie folgt verwendet werden:
Allgemein, Mac, Windows und Unix Aktionen starten einen externen Prozess.
Python Aktionen führen einen Python-Ausdruck aus.
Allgemeine und Pythonaktionen sind überall sichtbar.
Mac, Windows und Unix Aktionen sind nur sichtbar auf der entsprechenden Plattform (z.B. können Sie drei ‘Bearbeiten’ Aktionen definieren um einen Editor zu öffnen und die Benutzer können nur die eine ‘Bearbeiten’ Aktion für Ihr Betriebssystem sehen und ausführen um den Editor zu starten).
Es gibt verschiedene Beispiele in diesem Dialog. Sie können Ihn laden indem Sie auf [Voreingestellte Aktion] klicken. In einem Beispiel wird eine Suche auf Basis eines Attributwertes durchgeführt. Dieses Konzept wird in der folgenden Diskussion verwendet.
Defining Actions
Attributaktionen werden im Vektor Layer Eigenschaften Dialog definiert. Um eine Aktion zu definieren öffnen Sie den Vektor Layereigenschaften Dialog und klicken Sie auf das Menü Aktionen. Gehen Sie zu den Aktionseigenschaften. Wählen Sie ‘Allgemein’ als Typ und vergeben Sie einen beschreibenden Namen für die Aktion. Die Aktion selbst muss den Namen der Anwendung, die ausgeführt wird wenn die Aktion zum Einsatz kommt, enhalten. Sie können einen oder mehrere Attributfeldwerte als Argumente der Applikation hinzufügen. Wenn die Aktion aufgerufen wird wird jeder Satz von Buchstaben, der mit einem % beginnt und auf den der Name eines Feldes folgt, durch den Wert des entsprechenden Feldes ersetzt. Die speziellen Buchstaben %% werden durch den Wert des Feldes, das durch das Objekte abfragen Werkzeug oder die Attributtabelle ausgewählt wurde, ersetzt (siehe using_actions unten). Anführungszeichen werden ignoriert wenn Ihnen ein Backslash vorausgeht.
If you have field names that are substrings of other field names (e.g.,
col1 and col10), you should indicate that by surrounding the field name
(and the % character) with square brackets (e.g., [%col10]). This will
prevent the %col10 field name from being mistaken for the %col1 field name
with a 0 on the end. The brackets will be removed by QGIS when it
substitutes in the value of the field. If you want the substituted field to be
surrounded by square brackets, use a second set like this: [[%col10]].
Using the Identify Features tool, you can open the Identify Results
dialog. It includes a (Derived) item that contains information relevant to the
layer type. The values in this item can be accessed in a similar way to the other
fields by preceeding the derived field name with (Derived).. For example,
a point layer has an X and Y field, and the values of these fields can be used in
the action with %(Derived).X and %(Derived).Y. The derived attributes
are only available from the Identify Results dialog box, not the
Attribute Table dialog box.
Nachfolgend werden zwei Beispielaktionen gezeigt:
konqueror http://www.google.com/search?q=%namkonqueror http://www.google.com/search?q=%%
Im ersten Beispiel wird der Webbrowser Konqueror eingebunden und öffnet eine URL. Die URL führt eine Googlesuche für den Wert des nam Feldes unseres Vektorlayers durch. Beachten Sie das die Anwendung oder das Skript das von der Anwendung aufgerufen wird im Pfad sein muss oder den vollen Pfad vermitteln muss. Um sicher zu sein könnten wir das erste Beispiel wie folgt umschreiben: /opt/kde3/bin/konqueror http://www.google.com/search?q=%nam. Dies wird versichern dass die Konqueroranwendung ausgeführt wird wenn die Aktion aufgerufen wird.
Das zweite Beispiel nutzt den Ausdruck %%, welcher unabhängig ist von einem speziellen Feld. Beim Ausführen des Befehls wird der Ausdruck %% durch den Wert des jeweils selektierten Feldes aus Objekte abfragen oder der Attributtabelle ersetzt.
Using Actions
Actions can be invoked from either the Identify Results dialog,
an Attribute Table dialog or from Run Feature Action
(recall that these dialogs can be opened by clicking  Identify Features or
  Open Attribute Table or
 Run Feature Action). To invoke an action, right
click on the record and choose the action from the pop-up menu. Actions are
listed in the popup menu by the name you assigned when defining the action.
Click on the action you wish to invoke.
Run Feature Action). To invoke an action, right
click on the record and choose the action from the pop-up menu. Actions are
listed in the popup menu by the name you assigned when defining the action.
Click on the action you wish to invoke.
Wenn Sie eine Aktion mit %% Notation verwenden, machen Sie einen Rechtsklick auf den Feldwert im Objekte abfragen Dialog oder im Attributtabelle Dialog den Sie der Anwendung oder dem Skript übergeben wollen.
Here is another example that pulls data out of a vector layer and inserts
it into a file using bash and the echo command (so it will only work on
or perhaps  ). The layer in question has fields for a species name
taxon_name, latitude lat and longitude long. We would like to be
able to make a spatial selection of localities and export these field values
to a text file for the selected record (shown in yellow in the QGIS map area).
Here is the action to achieve this:
bash -c "echo \"%taxon_name %lat %long\" >> /tmp/species_localities.txt"
Nachdem ein paar Orte auf dem Bildschirm ausgewählt wurden (diese erscheinen gelb hinterlegt), starten wir die Aktion mit der rechten Maustaste über den Dialog Abfrageergebnisse und können danach in der Textdatei die Ergebnisse ansehen:
Acacia mearnsii -34.0800000000 150.0800000000
Acacia mearnsii -34.9000000000 150.1200000000
Acacia mearnsii -35.2200000000 149.9300000000
Acacia mearnsii -32.2700000000 150.4100000000
Als Übung können wir eine Aktion erstellen die eine Googlesuche auf Basis des lakes Layers durchführt. Zuerst müssen wir die URL, die gebraucht wird um eine Suche nach einem Stichwort durchzuführen, festlegen. Dies lässt sich einfach durchführen indem man einfach Google aufruft und eine einfache Suche durchführt und dann die URL aus der Adressleiste Ihres Browsers entnimmt. Mit diesem kleinen Aufwand können wir sehen dass das Format http://google.com/search?q=qgis ist, wobei QGIS das Suchwort ist. Anhand dieser Informationen können wir fortfahren:
Laden Sie den Layer file:lakes.shp.
Open the Layer Properties dialog by double-clicking on the layer in the legend, or right-click and choose Properties from the pop-up menu.
Klicken Sie auf das Menü Aktionen
Geben Sie einen Namen für die Aktion ein, z.B.
Google Search.Für diese Aktion ist es notwendig den Namen des externen Programms anzugeben. In diesem Fall können wir Firefox verwenden. Wenn das Programm sich nicht im Pfad befindet müssen Sie den vollständigen Pfad angeben.
Hinter dem Namen des Programms geben wir die URL ein, die wir für die Internetsuche benutzen wollen, aber ohne das Schlüsselwort:
http://google.com/search?q=Der Text imm Feld Aktion sollte nun folgendermaßen aussehen:
firefox http://google.com/search?q=Klicken Sie nun auf die Drop–Down Box mit dem Spaltennamen der Attributtabelle des Layers
lakes. Der Knopf ist gleich links neben dem Knopf [Attribut einfügen].From the drop-down box, select ‘NAMES’ and click [Insert Field].
Die Aktion sieht nun so aus:
firefox http://google.com/search?q=%NAMESTo finalize the action, click the [Add to action list] button.
This completes the action, and it is ready to use. The final text of the action should look like this:
firefox http://google.com/search?q=%NAMES
Damit ist die Aktion fertig für den Einsatz. Schließen Sie den Eigenschaften Dialog und zoomen Sie in einen Bereich Ihrer Wahl. Stellen Sie sicher, dass der Layer lakes in der Legende aktiviert ist. Nun identifizieren Sie einen See. In der Ergebnisanzeige sollte nun die Aktion sichtbar sein:
Figure Actions 2:
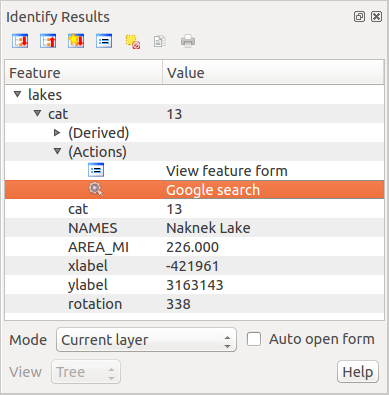
Select feature and choose action
When we click on the action, it brings up Firefox and navigates to the URL
http://www.google.com/search?q=Tustumena. It is also possible to add further
attribute fields to the action. Therefore, you can add a + to the end of
the action text, select another field and click on [Insert Field]. In
this example, there is just no other field available that would make sense
to search for.
You can define multiple actions for a layer, and each will show up in the Identify Results dialog.
Sie sehen, man kann sich eine Vielzahl interessanter Aktionen ausdenken. Wenn Sie z.B. einen Punktlayer mit einzelnen Punkten haben, an denen Photos geschossen wurden, dann können Sie eine Aktion erstellen, über die Sie dann das entsprechende Foto anzeigen lassen können, wenn Sie auf den Punkt in der Karte klicken. Man kann auch zu bestimmten Attributen webbasierte Information ablegen (z.B. in einer HTML-Datei) und diese dann über eine Aktion anzeigen lassen, etwa so wie in dem Google Beispiel.
Wir können auch komplexere Beispiele erstellen, indem wir z.B. Python Aktionen verwenden.
Normalerweise wenn wir beim Erstellen von Aktionen zum Öffnen einer Datei mit einer externen Anwendung absolute Pfade, oder letztendlich relative Pfade verwenden ist im zweiten Fall der Pfad relativ zum Ort der ausführbaren Datei. Was aber wenn wir relative Pfade, die relativ zum ausgewählten Layer (eine dateibasierte, wie ein Shape oder SpatiaLite) sind, benutzen müssen ? Mit dem folgenden Code können wir einen Trick anwenden:
command = "firefox";
imagerelpath = "images_test/test_image.jpg";
layer = qgis.utils.iface.activeLayer();
import os.path;
layerpath = layer.source() if layer.providerType() == 'ogr'
  else (qgis.core.QgsDataSourceURI(layer.source()).database()
  if layer.providerType() == 'spatialite' else None);
path = os.path.dirname(str(layerpath));
image = os.path.join(path,imagerelpath);
import subprocess;
subprocess.Popen( [command, image ] );
Wir müssen uns nur ins Gedächtnis rufen dass es sich um eine Python Aktion handelt und dass das Ändern der command und imagerelpath Variablen auf unsere Bedürfnisse angepasst wird.
Was aber wenn der relative Pfad relativ zur (gespeicherten) Projektdatei sein muss? Der Code der Python Aktion würde wie folgt lauten:
command="firefox";
imagerelpath="images/test_image.jpg";
projectpath=qgis.core.QgsProject.instance().fileName();
import os.path; path=os.path.dirname(str(projectpath)) if projectpath != '' else None;
image=os.path.join(path, imagerelpath);
import subprocess;
subprocess.Popen( [command, image ] );
Ein anderes Python Aktion Beispiel ist das mit wir dem Projekt neue Layer hinzufügen können. Z.B. wird in den folgenden Beispielen dem Projekt ein Vektorlayer beziehungsweise ein Rasterlayer hinzugefügt. Die Namen der Dateien, die dem Projekt hinzugefügt werden sollen, und die Namen, die den Layern gegeben werden, sind datengesteuert (filename und layername sind Spaltennamen der Attributtabelle des Vektorlayers in dem die Aktion erstellt wurde):
qgis.utils.iface.addVectorLayer('/yourpath/[% "filename" %].shp','[% "layername" %]',
  'ogr')
Um eine Rasterdatei hinzuzufügen (ein TIF-Bild in diesem Beispiel) wird daraus:
qgis.utils.iface.addRasterLayer('/yourpath/[% "filename" %].tif','[% "layername" %]
')
Menü Verknüpfungen
 The Joins menu allows you to join a loaded attribute table
to a loaded vector layer. After clicking , the Add vector join dialog appears.
As key columns, you have to define a join layer you want to connect with the target vector layer. Then, you have to specify the join field that is common to both the join layer and the target layer. Now you can also specify a subset of fields from the joined layer based on the checkbox Choose which fields are joined. As a result of the join, all information from the join layer and the target layer are displayed in the attribute table of the target layer as joined information. If you specified a subset of fields only these fields are displayed in the attribute table of the target layer.
The Joins menu allows you to join a loaded attribute table
to a loaded vector layer. After clicking , the Add vector join dialog appears.
As key columns, you have to define a join layer you want to connect with the target vector layer. Then, you have to specify the join field that is common to both the join layer and the target layer. Now you can also specify a subset of fields from the joined layer based on the checkbox Choose which fields are joined. As a result of the join, all information from the join layer and the target layer are displayed in the attribute table of the target layer as joined information. If you specified a subset of fields only these fields are displayed in the attribute table of the target layer.
QGIS currently has support for joining non-spatial table formats supported by OGR (e.g., CSV, DBF and Excel), delimited text and the PostgreSQL provider (see figure_joins_1).
Figure Joins 1:
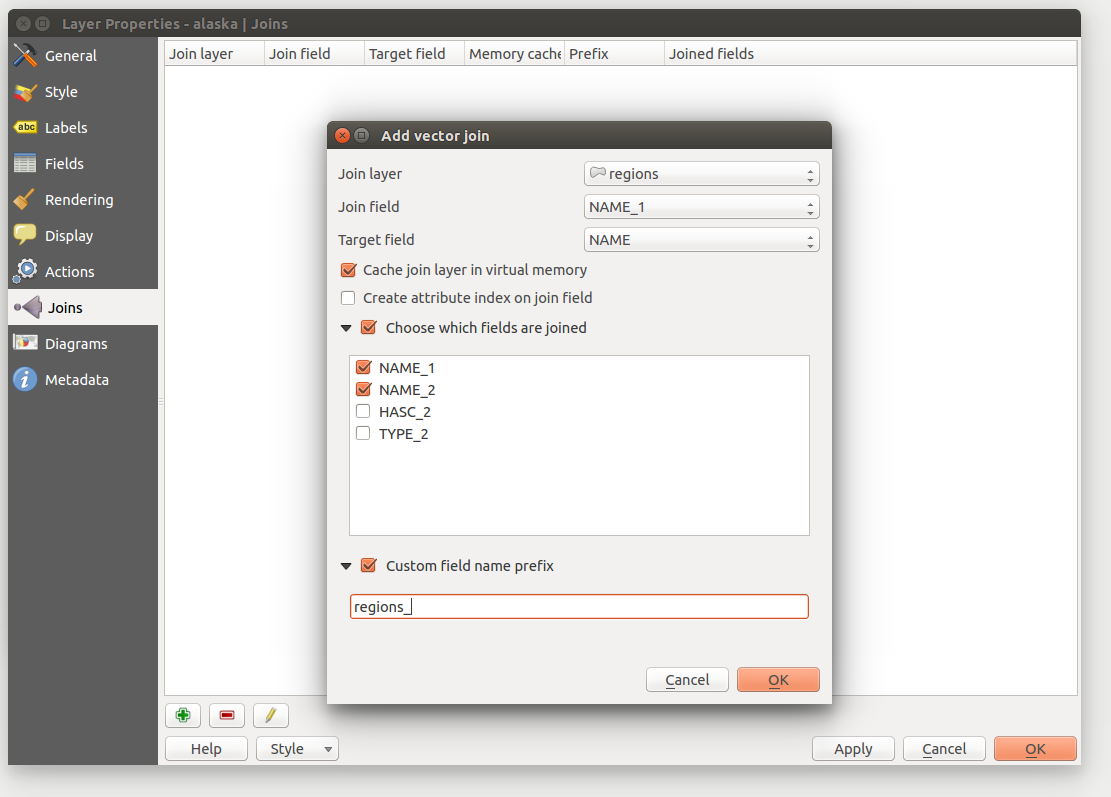
Join an attribute table to an existing vector layer
Zusätzlich können Sie mit dem Vektorverknüpfung hinzufügen Dialog:
- Verknüpfung im Speicher cachen
- Index auf Feld erzeugen
- Choose which fields are joined
- Create a Custom field name prefix
Menü Diagramme
 Das Menü Diagramme ermöglicht es, ein Diagramm als Grafik über einen Vektorlayer zu visualisieren (siehe figure_diagrams_1).
The current core implementation of diagrams provides support for pie charts, text diagrams and histograms.
The menu is divided into four tabs: Appearance, Size, Postion and Options.
In the cases of the text diagram and pie chart, text values of different data columns are displayed one below the other with a circle or a box and dividers. In the Size tab, diagram size is based on a fixed size or on linear scaling according to a classification attribute. The placement of the diagrams, which is done in the Position tab, interacts with the new labeling, so position conflicts between diagrams and labels are detected and solved. In addition, chart positions can be fixed manually.
Figure Diagrams 1:

Vector properties dialog with diagram menu
We will demonstrate an example and overlay on the Alaska boundary layer a text diagram showing temperature data from a climate vector layer. Both vector layers are part of the QGIS sample dataset (see section Beispieldaten).
- First, click on the
 Load Vector icon, browse
to the QGIS sample dataset folder, and load the two vector shape layers
Load Vector icon, browse
to the QGIS sample dataset folder, and load the two vector shape layers
alaska.shpandclimate.shp. Doppelklicken Sie auf den
climateLayer in der Kartenlegende um den Dialog Layereigenschaften zu öffnen.- Click on the Diagrams menu, activate Display diagrams,
and from the Diagram type combo box, select ‘Text diagram’.
Im Darstellung Reiter wählen wir ein Hellblau als Hintergrundfarbe und im Reiter Größe stellen wir eine feste Größe von 18 mm ein.
Im Reiter Position könnte die Platzierung auf ‘Um Punkt’ eingestellt werden.
- In the diagram, we want to display the values of the three columns
T_F_JAN,T_F_JULandT_F_MEAN. First selectT_F_JANas Attributes and click the button, then T_F_JUL, and finallyT_F_MEAN. - Now click [Apply] to display the diagram in the QGIS main window.
- You can adapt the chart size in the Size tab. Deactivate the Fixed size and set
the size of the diagrams on the basis of an attribute with the [Find maximum value] button and the
Size menu. If the diagrams appear too small on the screen, you can activate the Increase
size of small diagrams checkbox and define the minimum size of the diagrams.
- Change the attribute colors by double clicking on the color values in the Assigned attributes field. Figure_diagrams_2 gives an idea of the result.
Klicken Sie schließlich auf [Ok].
Figure Diagrams 2:
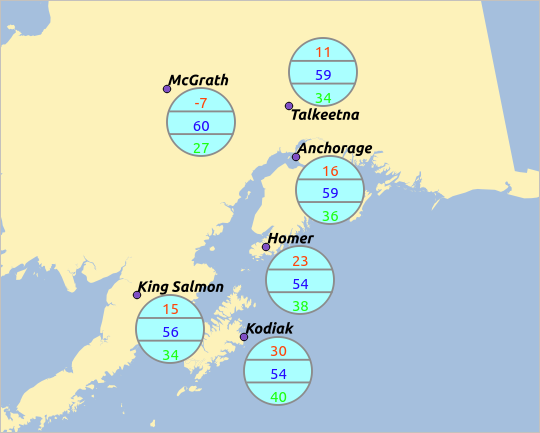
Diagram from temperature data overlayed on a map
Behalten Sie im Hinterkopf dass im Reiter Position eine Datendefinierte Position der Diagramme möglich ist. Sie können hier Attribute verwenden um die Position des Diagramms zu definieren. Sie können auch eine maßstabsabhängige Sichtbarkeit im Darstellung Reiter einstellen.
The size and the attributes can also be an expression. Use the button
to add an expression. See Ausdrücke chapter for more information and example.
Metadata Menu
 The Metadata menu consists of Description,
Attribution, MetadataURL and Properties sections.
The Metadata menu consists of Description,
Attribution, MetadataURL and Properties sections.
In the Properties section, you get general information about the layer, including specifics about the type and location, number of features, feature type, and editing capabilities. The Extents table provides you with layer extent information and the Layer Spatial Reference System, which is information about the CRS of the layer. This is a quick way to get information about the layer.
Additionally, you can add or edit a title and abstract for the layer in the Description section. It’s also possible to define a Keyword list here. These keyword lists can be used in a metadata catalogue. If you want to use a title from an XML metadata file, you have to fill in a link in the DataUrl field. Use Attribution to get attribute data from an XML metadata catalogue. In MetadataUrl, you can define the general path to the XML metadata catalogue. This information will be saved in the QGIS project file for subsequent sessions and will be used for QGIS server.
Figure Metadata 1:
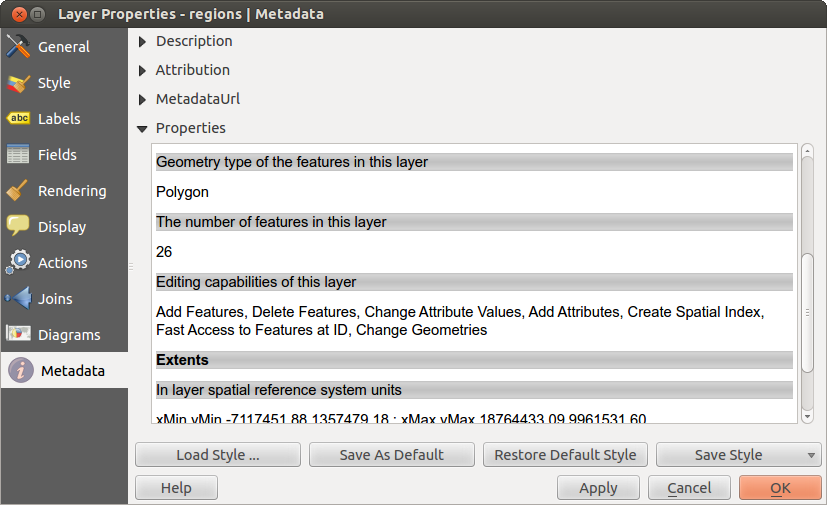
Metadata menu in vector layers properties dialog