.
Allgemeine Werkzeuge
Tastenkürzel
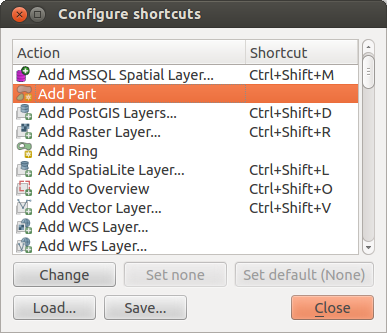
QGIS provides default keyboard shortcuts for many features. You can find them in section Menüleiste. Additionally, the menu option Settings ‣ Configure Shortcuts.. allows you to change the default keyboard shortcuts and to add new keyboard shortcuts to QGIS features.
Figure Shortcuts 1:
Configuration is very simple. Just select a feature from the list and click on [Change], [Set none] or [Set default]. Once you have finished your configuration, you can save it as an XML file and load it to another QGIS installation.
Hilfe
Wenn Sie Hilfe zu bestimmten Themen brauchen erreichen Sie die Kontext-Hilfe über den [Hilfe] Knopf der Ihnen in den meisten Dialogen zur Verfügung steht. Bitte beachten Sie daß Erweiterungen von Drittanbietern zu dementsprechend gewidmeten Internetseiten verweisen.
Layeranzeige kontrollieren
By default, QGIS renders all visible layers whenever the map canvas is refreshed. The events that trigger a refresh of the map canvas include:
Einen Layer hinzufügen
Karten verschieben, hinein- oder herauszoomen
- Resizing the QGIS window
Layer ein- oder ausblenden
QGIS allows you to control the rendering process in a number of ways.
Maßstabsabhängige Layeranzeige
Die maßstabsabhängige Wiedergabe erlaubt es, einen mini- und maximalen Maßstab, in dessen Rahmen ein Layer angezeigt wird, anzugeben. Um die maßstabsabhängige Wiedergabe einzustellen öffnen Sie den Eigenschaften Dialog eines Layers, indem Sie diesen in der Legende doppelt anklicken, im Menü Allgemein die entsprechenden Einstellungen vornehmen und das Kontrollkästchen  Maßstabsabhängige Sichtbarkeit aktivieren.
You can determine the scale values by first zooming to the level you want to use and noting the scale value in the QGIS status bar.
Layeranzeige kontrollieren
Map rendering can be controlled in the various ways, as described below.
Wiedergabe unterdrücken
To suspend rendering, click the  Render checkbox in the
lower right corner of the status bar. When the
  Render
checkbox is not checked, QGIS does not redraw the canvas in response to any of
the events described in section Layeranzeige kontrollieren. Examples of when you
might want to suspend rendering include:
Viele Layer hinzufügen und ihre Symbologie vor der Visualisierung einstellen
Einen oder mehrere große Layer hinzufügen und erst die maßstabsabhängige Wiedergabe einstellen
Einen oder mehrere große Layer hinzufügen und erst in ein bestimmtes Gebiet hineinzoomen
Eine Kombination aus den oben genannten Punkten
Wenn Sie die  Zeichnen aktivieren, findet automatisch eine Erneuerung der Wiedergabe des Kartenfensters statt.
Option für Layer hinzufügen
Sie können für das Hinzuladen neuer Layer eine Einstellung vornehmen, die bewirkt, dass diese beim Laden erst einmal nicht angezeigt werden. Um diese Option zu nutzen deaktivieren Sie in der Menüleiste unter Einstellungen ‣ Optionen im Menü Darstellung das Kontrollkästchen  Normalerweise werden alle neuen Layer im Kartenfenster angezeigt. Dadurch werden alle neu geladenen Layer erstmal nicht angezeigt.
Zeichnen stoppen
Um die Wiedergabe einer Karte zu stoppen drücken Sie die ESC Taste. Dies stoppt die Erneuerung der Wiedergabe und die Karte wird nur zum Teil angezeigt. Es kann sein dass etwas Zeit zwischen dem Drücken der Esc Taste und dem Stoppen der Kartenwiedergabe vergeht.
Bemerkung
Es ist derzeit nicht möglich das Zeichnen zu stoppen - diese Funktion wurde mit der Version qt4 ausgeschaltet da es zu Problemen und Abstürzen der Benutzeroberfläche kam.
Updating the Map Display During Rendering
You can set an option to update the map display as features are drawn. By default, QGIS does not display any features for a layer until the entire layer has been rendered. To update the display as features are read from the datastore, choose menu option Settings ‣ Options and click on the Rendering tab. Set the feature count to an appropriate value to update the display during rendering. Setting a value of 0 disables update during drawing (this is the default). Setting a value too low will result in poor performance, as the map canvas is continually updated during the reading of the features. A suggested value to start with is 500.
Die Qualität der Wiedergabe beeinflussen
To influence the rendering quality of the map, you have two options. Choose menu option Settings ‣ Options, click on the Rendering tab and select or deselect following checkboxes:
Darstellung beschleunigen
There are two settings that allow you to improve rendering speed. Open the QGIS options dialog using Settings ‣ Options, go to the Rendering tab and select or deselect the following checkboxes:
 Enable back buffer. This provides better graphics
performance at the cost of losing the possibility to cancel rendering and
incrementally draw features. If it is unchecked, you can set the
Number of features to draw before updating the display, otherwise
this option is inactive.
 Wo möglich den Darstellungscache benutzen, um das Neuzeichnen zu beschleunigen
Messen
Measuring works within projected coordinate systems (e.g., UTM) and unprojected data. If the loaded map is defined with a geographic coordinate system (latitude/longitude), the results from line or area measurements will be incorrect. To fix this, you need to set an appropriate map coordinate system (see section Arbeiten mit Projektionen). All measuring modules also use the snapping settings from the digitizing module. This is useful, if you want to measure along lines or areas in vector layers.
To select a measuring tool, click on  and select the tool you want
to use.
Measure length, areas and angles
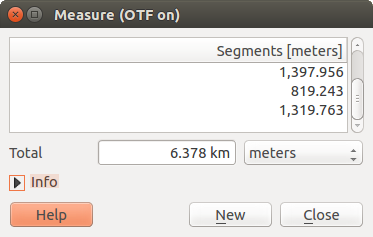
 Measure Line: QGIS is able to measure real distances
between given points according to a defined ellipsoid. To configure this,
choose menu option Settings ‣ Options, click on the
Map tools tab and select the appropriate ellipsoid. There, you can
also define a rubberband color and your preferred measurement units (meters or
feet) and angle units (degrees, radians and gon). The tool then allows you to
click points on the map. Each segment length, as well as the total, shows up in
the measure window. To stop measuring, click your right mouse button.
Note that you can interactively change the measurement units in the measurement
dialog. It overrides the Preferred measurement units in the options.
There is an info section in the dialog that shows which CRS settings are being used
during measurement calculations.
Figure Measure 1:
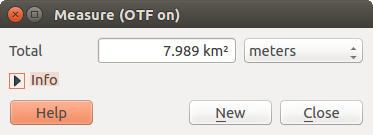
 Measure Area: Areas can also be measured. In the
measure window, the accumulated area size appears. In addition, the measuring
tool will snap to the currently selected layer, provided that layer has its
snapping tolerance set (see section Einstellen der Fangtoleranz und des Suchradius). So, if you want
to measure exactly along a line feature, or around a polygon feature, first set
its snapping tolerance, then select the layer. Now, when using the measuring
tools, each mouse click (within the tolerance setting) will snap to that layer.
Figure Measure 2:
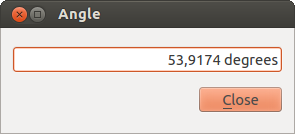
 Measure Angle: You can also measure angles. The
cursor becomes cross-shaped. Click to draw the first segment of the angle you
wish to measure, then move the cursor to draw the desired angle. The measure
is displayed in a pop-up dialog.
Figure Measure 3:
Objekte auswählen und Auswahl aufheben
The QGIS toolbar provides several tools to select features in the map canvas.
To select one or several features, just click on  and select your
tool:
 Select Single Feature
 Select Features by Rectangle
 Select Features by Polygon
 Select Features by Freehand
 Select Features by Radius
To deselect all selected features click on  Deselect
features from all layers.
![]() Select feature using an expression allow user
to select feature using expression dialog. See Ausdrücke
chapter for some example.
Select feature using an expression allow user
to select feature using expression dialog. See Ausdrücke
chapter for some example.
Users can save features selection into a New Memory Vector Layer or a New Vector Layer using Edit ‣ Paste Feature as ... and choose the mode you want.
Objekte abfragen
The Identify tool allows you to interact with the map canvas and get information on features
in a pop-up window. To identify features, use View ‣ Identify
features or press Ctrl + Shift + I, or click on the  Identify features icon in the toolbar.
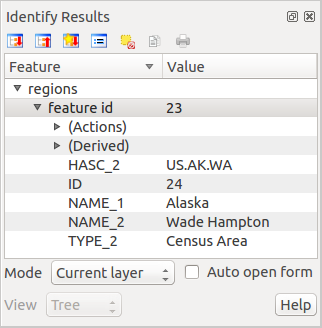
If you click on several features, the Identify results dialog will list information about all the selected features. The first item is the number of the layer in the list of results, followed by the layer name. Then, its first child will be the name of a field with its value. The first field is the one selected in Properties ‣ Display. Finally, all information about the feature is displayed.
Dieses Fenster kann angepasst werden um benutzerdefinierte Felder anzuzeigen, standardmäßig gibt es drei Arten von Informationen wieder:
- Actions: Actions can be added to the identify feature windows. When clicking on the action label, action will be run. By default, only one action is added, to view feature form for editing.
- Derived: This information is calculated or derived from other information. You can find clicked coordinate, X and Y coordinates, area in map units and perimeter in map units for polygons, length in map units for lines and feature ids.
- Data attributes: This is the list of attribute fields from the data.
Figure Identify 1:
At the top of the window, you have five icons:
At the bottom of the window, you have the Mode and View comboboxes. With the Mode combobox you can define the identify mode: ‘Current layer’, ‘Top down, stop at first’, ‘Top down’ and ‘Layer selection’. The View can be set as ‘Tree’, ‘Table’ and ‘Graph’.
The identify tool allows you to auto open a form. In this mode you can change the feautures attributes.
Andere Funktionen können im Kontextmenü des abgefrageten Objekts gefunden werden. Im Kontextmenü können Sie z.B.:
Das Objektformular anzeigen
Zum Objekt zoomen
Objekt kopieren: Kopieren Sie alle Objektgeometrien und -attribute
- Toggle feature selection: adds identified feature to selection
Attributwert kopieren: Kopieren Sie nur den Wert des Attributes auf das Sie klicken
- Copy feature attributes: Copy only attributes
Ergebnisse löschen: Löschen Sie Ergebnisse im Fenster
Hervorhebungen löschen: Entfernen Sie in der Karte hervorgehobene Objekte
Alle hervorheben
Layer hervorheben
Layer aktivieren: Wählen Sie einen Layer der aktiviert werden soll
Layereigenschaften ... : Öffnen Sie das Layereigenschaften Fenster
Alles ausklappen
Alles zusammenfalten
Dekorationen
The Decorations of QGIS include the Grid, the Copyright Label, the North Arrow and the Scale Bar. They are used to ‘decorate’ the map by adding cartographic elements.
Gitter
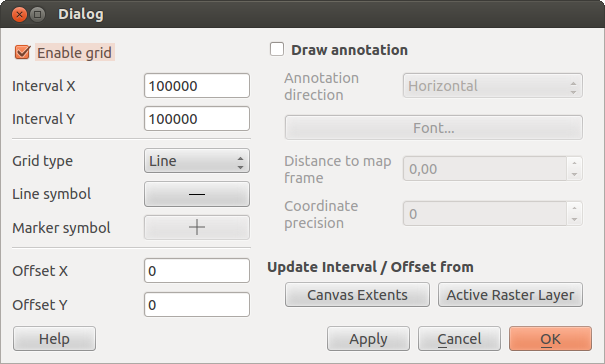
 Gitter ermöglicht es Ihnen ein Koordinatengitter und Koordinatenbeschriftungen der Karte hinzuzufügen.
Figure Decorations 1:
Wählen Sie das Menü Ansicht‣ Dekorationen ‣ Gitter. Der Dialog öffnet sich (siehe figure_decorations_1).
Aktivieren Sie das Kontrollkästchen
 Aktiviere Gitter und machen Sie Definitionen gemäß den Layern die Sie ins Kartenfenster geladen haben.
Aktivieren Sie das Kontrollkästchen
 Beschriftungen zeichnen und machen Sie Beschriftungsdefinitionen gemäß den im Kartenfenster geladenen Layern.
- Click [Apply] to verify that it looks as expected.
- Click [OK] to close the dialog.
Urheberrechtshinweis
 Copyright label adds a copyright label using the text
you prefer to the map.
Figure Decorations 2:
Wählen Sie Ansicht ‣ Dekorationen ‣ Urheberrechtshinweis. Der Dialog öffnet sich (siehe figure_decorations_2)
Geben Sie den Text den Sie auf der Karte platzieren wollen ein. Sie können wie im Beispiel gezeigt HTML benutzen.
- Choose the placement of the label from the Placement
 combo box.
 Versichern Sie sich dass das
 Urheberrechtshinweis aktivieren Kontrollkästchen aktiviert ist.
- Click [OK].
In the example above, which is the default, QGIS places a copyright symbol followed by the date in the lower right-hand corner of the map canvas.
Nordpfeil
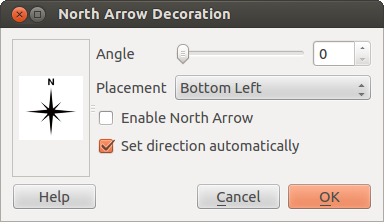
 North Arrow places a simple north arrow on the map canvas.
At present, there is only one style available. You can adjust the angle of the
arrow or let QGIS set the direction automatically. If you choose to let QGIS
determine the direction, it makes its best guess as to how the arrow should be
oriented. For placement of the arrow, you have four options, corresponding to
the four corners of the map canvas.
Figure Decorations 3:
Maßstab
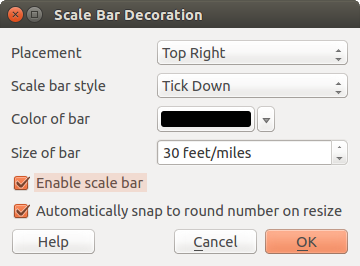
 Scale Bar adds a simple scale bar to the map canvas. You
can control the style and placement, as well as the labeling of the bar.
Figure Decorations 4:
QGIS only supports displaying the scale in the same units as your map frame. So if the units of your layers are in meters, you can’t create a scale bar in feet. Likewise, if you are using decimal degrees, you can’t create a scale bar to display distance in meters.
Das Hinzufügen eines Maßstabbalkens geht folgendermaßen:
Klicken Sie auf Ansicht ‣ Dekorationen ‣ Maßstab. Der Dialog startet (siehe figure_decorations_4).
- Choose the placement from the Placement
 combo box.
 - Choose the style from the Scale bar style
 combo box.
 - Select the color for the bar Color of bar
 or use
the default black color.
 - Set the size of the bar and its label Size of bar
 .
. Versichern Sie sich dass das
 Aktiviere Maßstab Kontrollkästchen aktiviert ist.
- Optionally, check
 Automatically snap to round number
on resize.
 - Click [OK].
Tipp
Einstellungen von Dekorationen
Wenn Sie ein .qgs -Projekt speichern werden alle bezüglich Nordpfeil, Maßstab und Urheberrechtshinweis gemachten Änderungen im Projekt gespeichert und das nächste Mal wenn das Projekt geladen wird wiederhergestellt
Beschriftungstools
The  Text Annotation tool in the attribute
toolbar provides the possibility to place formatted text in a balloon on the
QGIS map canvas. Use the Text Annotation tool and click into the
map canvas.
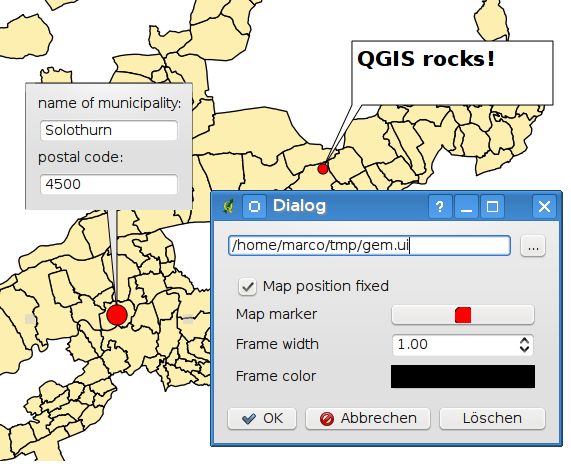
Figure annotation 1:
Ein Doppelklick auf das Element öffnet den Dialog mit verschiedenen Optionen. Im Texteditor können Sie den formatierten Text eingeben und einige Einstellungen vornehmen. Z.B. kann das Objekt an einer bestimmten Stelle positioniert werden, was dann durch ein Markersymbol angezeigt wird. Oder das es unabhängig von dem Objekt im Kartenfenster angezeigt wird. Der Text kann entweder durch Verschieben der Markierung oder der Sprechblase im Kartenfenster verschoben werden.
The  Move Annotation tool allows you to move the
annotation on the map canvas.
HTML-Beschriftung
The  Html Annotation tools in the attribute
toolbar provides the possibility to place the content of an html file in a
balloon on the QGIS map canvas. Using the Html Annotation tool, click
into the map canvas and add the path to the html file into the dialog.
SVG-Anmerkung
The  SVG Annotation tool in the attribute toolbar
provides the possibility to place an SVG symbol in a balloon on the QGIS map
canvas. Using the SVG Annotation tool, click into the map canvas and
add the path to the SVG file into the dialog.
Beschriftungsformular
Additionally, you can also create your own annotation forms. The
 Form Annotation tool is useful to display
attributes of a vector layer in a customized Qt Designer form (see
figure_custom_annotation). This is similar to the designer forms for the
Identify features tool, but displayed in an annotation item.
Also see this video https://www.youtube.com/watch?v=0pDBuSbQ02o from
Tim Sutton for more information.
Figure annotation 2:
Bemerkung
Wenn Sie das Tastenkürzel Ctrl+T drücken während ein Beschriftungswerkzeug aktiv ist ändert sich deren Anzeigestatus zwischen an und aus.
Räumliche Lesezeichen
Spatial Bookmarks allow you to “bookmark” a geographic location and return to it later.
Ein Lesezeichen erstellen
Um ein Lesezeichen zu erstellen:
Zoomen oder verschieben Sie das Kartenfenster in einen Ausschnitt Ihrer Wahl.
- Select the menu option View ‣ New Bookmark or press
Ctrl-B. Geben Sie eine Beschreibung für das Lesezeichen ein (bis zu 255 Zeichen).
- Press
Enterto add the bookmark or [Delete] to remove the bookmark.
Sie können mehrere Lesezeichen mit demselben Namen erstellen.
Arbeiten mit Lesezeichen
To use or manage bookmarks, select the menu option View ‣ Show Bookmarks. The Geospatial Bookmarks dialog allows you to zoom to or delete a bookmark. You cannot edit the bookmark name or coordinates.
Zooming to a Bookmark
From the Geospatial Bookmarks dialog, select the desired bookmark by clicking on it, then click [Zoom To]. You can also zoom to a bookmark by double-clicking on it.
Deleting a Bookmark
To delete a bookmark from the Geospatial Bookmarks dialog, click on it, then click [Delete]. Confirm your choice by clicking [Yes], or cancel the delete by clicking [No].
Import or export a bookmark
To share or transfer your bookmarks between computers you can use the Share pull down menu in the Geospatial Bookmarks dialog.
Layer/Gruppen einbinden
Wenn Sie Inhalte von anderen Projekten in Ihr Projekt einbinden wollen wählen Sie Layer ‣ Eingebettete Layer und Gruppen ....
Layer einbetten
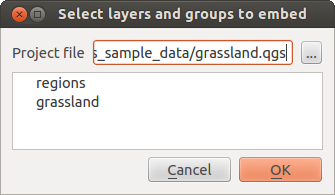
Mit dem folgenden Dialog können Sie Layer von anderen Projekten einbetten. Hier ein kleines Beispiel:
- Press
 to look for another project from the Alaska dataset.
 - Select the project file
grassland. You can see the content of the project (see figure_embed_dialog). - Press
Ctrland click on the layersgrasslandandregions. Press [OK]. The selected layers are embedded in the map legend and the map view now.
Figure Nesting 1:
Währenddessen die Layer editierbar sind können Sie Ihre Eigenschaften wie Darstellung und Beschriftung nicht ändern.
