データを開く
オープンソース・ソフトウェアのエコシステムの一環として、QGISは、独自のプロバイダーと組み合わせて、提供機能が読み込まれ、多くの場合、フォーマットの多くを書くための異なるライブラリーに基づいて構築されています。
Vector data formats include ESRI formats (Shapefile, Geodatabase...), MapInfo and MicroStation file formats, AutoCAD DWG/DXF, GeoPackage, GeoJSON, GRASS, GPX, KML, Comma Separated Values, and many more... Read the complete list of OGR vector supported formats.
Raster data formats include ArcInfo Binary Grid, ArcInfo ASCII Grid, JPEG, GeoTIFF, ERDAS IMAGINE, MBTiles, R or Idrisi rasters, ASCII Gridded XYZ, GDAL Virtual, SRTM, Sentinel Data, and many more... Read the complete list of raster supported formats.
Database formats include PostgreSQL/PostGIS, SQLite/SpatiaLite, Oracle, DB2 or MSSQL Spatial, MySQL...
Support of web data services (WM(T)S, WFS, WCS, CSW, ArcGIS Servers...) is also handled by QGIS providers (see OGCデータクライアントとしてのQGIS).
また、アーカイブフォルダからサポートされたファイルを読み込むと、このような仮想およびメモリレイヤーとしてQGISのネイティブフォーマットを使用できます。
As of the date of this document, more than 80 vector and 140 raster formats are supported by the GDAL/OGR and QGIS native providers.
注釈
Not all of the listed formats may work in QGIS for various reasons. For
example, some require external proprietary libraries, or the GDAL/OGR
installation of your OS may not have been built to support the format you
want to use. To see the list of available formats, run the command line
ogrinfo --formats (for vector) and gdalinfo --formats (for raster),
or check menu (for raster)
in QGIS.
In QGIS, depending on the data format, there are different tools to open it,
mainly available in the menu
or from the Manage Layers toolbar (enabled through menu).
However, all these tools point to a unique dialog, the Data Source
Manager dialog that you can directly open with the  Open Data Source Manager button available on the Data Source
Manager Toolbar or by pressing Ctrl+L. Indeed, the Data Source
Manager dialog offers a unified interface to open vector or raster file-based
data as well as databases or web services supported by QGIS. It can be set
modal or not with the
  Modeless data source manager dialog
in menu.
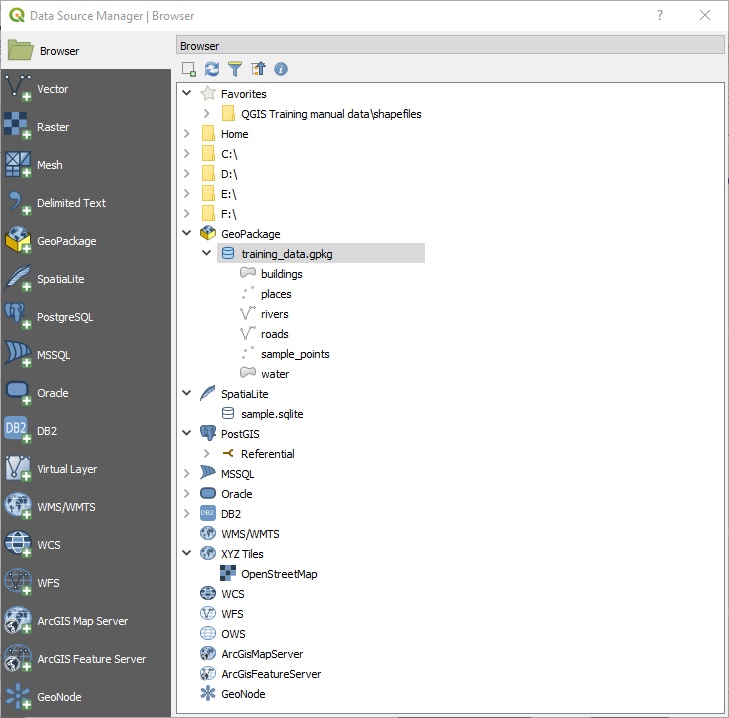
QGIS Data Source Manager dialog
Beside this main entry point, you also have the  DB Manager
plugin that offers advanced capabilities to analyze and manipulate connected
databases. More information on DB Manager capabilities are exposed in DB Manager Plugin.
There are also many other tools, native or third-party plugins, that help you open dedicated data formats.
This chapter will describe only the tools provided by default in QGIS to load data. It will mainly focus on the Data Source Manager dialog but more than describing each tab, it will also explore the tools based on the data provider or format specificities.
ブラウザパネル
The Browser is one of the main ways to quickly and easily add your data to projects. It's available as:
a Data Source Manager tab, enabled pressing the
 Open Data Source Manager button (Ctrl+L);
as a QGIS panel you can open from the menu (or
 ) or by pressing Ctrl+2.
In both cases, the Browser helps you navigate in your file system and manage geodata, regardless the type of layer (raster, vector, table), or the datasource format (plain or compressed files, database, web services).
The context menu for an element in the Browser panel is opened by right-clicking on it.
For file system directory entries, the context menu offers the following:
Add as a Favorite
Properties...
Hide from Browser
Fast Scan this Directory
New Directory...
Open Directory
Favourites, can also be removed and renamed:
Rename favourite...
Remove favourite
For leaf entries that can act as layers in the project, the context menu will have a selection of entries. For example, for non-database, non-service-based vector, raster and mesh data sources:
Add Selected Layer(s) to Canvas
Properties...
Delete File "<name of file>"...
In the Layer properties entry, you will find (similar to what you will find in the vector and raster layer properties once the layers have been added to the project):
Metadata for the layer. Metadata groups: Information from provider (if possible, Path will be a hyperlink to the source), Identification, Extent, Access, Fields (for vector layers), Bands (for raster layers), Contacts, Links (for vector layers), References (for raster layers), History.
A Preview panel
The attribute table for vector sources (in the Attributes panel).
To add a layer to the project using the Browser:
Enable the Browser as described above. A browser tree with your file system, databases and web services is displayed. You may need to connect databases and web services before they appear (see dedicated sections).
Find the layer in the list.
Use the context menu, double-click its name, or drag-and-drop it into the map canvas. Your layer is now added to the Layers panel and can be viewed on the map canvas.
ちなみに
Open a QGIS project directly from the browser
You can also open a QGIS project directly from the Browser panel by double-clicking its name or by drag-and-drop into the map canvas.
ファイルがロードされたら、地図のナビゲーションツールを使用して、それを中心にズームできます。レイヤーのスタイルを変更するには、レイヤー名上ダブルクリックするか、または凡例の名前を右クリックしてコンテキストメニューから を選択することで、 レイヤープロパティ ダイアログを開きます。ベクターレイヤーのシンボルの設定の詳細は、 Symbology Properties セクションを参照。
パネルの上部には幾つかのアイコンがあり、あなたの助けになります:
 選択レイヤーを追加 項目:また、レイヤーのコンテキストメニューから 選択したレイヤー(複数可)を追加 を選択することで、地図キャンバスにデータを追加できます。
 フィルタブラウザ 特定のデータを検索します。検索ワードまたはワイルドカードを入力して、ブラウザがDBテーブル、ファイル名やフォルダをマッチングするだけショーのパスにツリーをフィルタリングします - 他のデータやフォルダは表示されません。 figure_browser_panels 上のブラウザパネル(2)の例を参照してください。比較では、大文字と小文字は区別であってもなくてもよいです。また、に設定できます。
通常 :検索テキストを含む任意の項目を返します
ワイルドカード(複数可) を使用:
?および/または*文字を使用して検索を微調整し、検索テキストの位置を指定します正規表現 を使用して
 Enable/disable properties widget: when toggled on,
a new widget is added at the bottom of the panel showing, if applicable,
metadatas of the selected item.
ブラウザツリー内の項目を右クリックし、次のことに役立ちます。
ファイルまたはテーブルの場合には、そのメタデータを表示したり、プロジェクトで開きます。テーブルは、名前変更、削除または切り捨てもできます;
フォルダの場合は、お気に入りにそれをブックマークし、ブラウザツリーからそれを隠します。隠しフォルダは タブから管理できます:
データベースやWebサーバーへの接続を作成します。
スキーマを更新し、名前の変更または削除。
簡単なドラッグアンドドロップで、データベースにファイルをインポートしたり、あるスキーマ/データベースから別のものにテーブルをコピーしたりもできます。ドラッグ中に長いスクロールをしなくてよいよう、利用可能な2番目のブラウザパネルがあります。ファイルを選択し、あるパネルから他へドラッグアンドドロップするだけです。
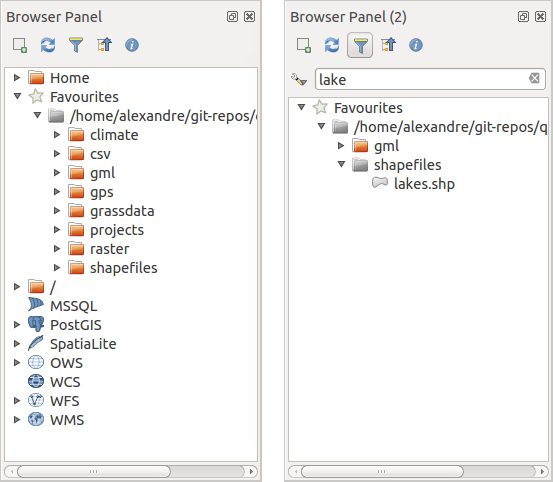
横並びのQGISブラウザパネル
ちなみに
お使いのOSのファイルブラウザからの簡単なドラッグ&ドロップでQGISにレイヤーを追加します
ファイルをプロジェクトに追加するには、オペレーティングシステムのファイルブラウザから レイヤーパネル または地図キャンバスにファイルをドラッグアンドドロップします。
DBマネージャ
DBマネージャ プラグインは、QGIS(PostGIS、SpatiaLite、GeoPackage、Oracle Spatial、MSSQL、DB2、Virtual layers)でサポートされている空間データベースフォーマットを1つのユーザーインターフェイスで統合して管理するための主要なツールです。 メニューから起動できます。
データベースに接続し、その構造と内容を表示します。
データベースのプレビューテーブル。
いずれかをダブルクリックするか、ドラッグ・アンド・ドロップで、地図キャンバスにレイヤーを追加します。
QGISのブラウザから、または別のデータベースからデータベースにレイヤーを追加します。
地図キャンバスにSQLクエリの出力を作成し追加します。
virtual layers を作成します。
DBマネージャの機能の詳細については、 DB Manager Plugin で公開されています。
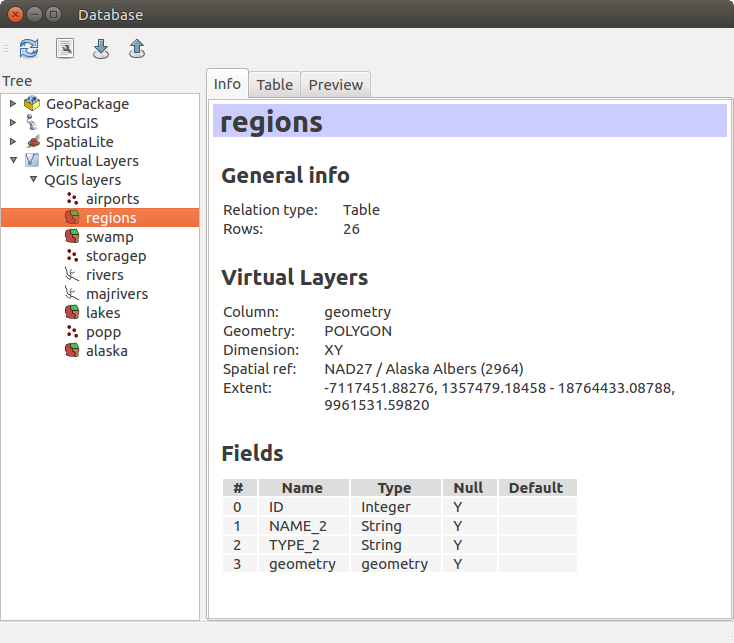
[DBマネージャ]ダイアログ
プロバイダーベースのロードツール
QGISがフォーマットに関係なくレイヤーを追加するために提供する主なツールであるブラウザパネルとDBマネージャのほかに、データプロバイダー固有のツールもあります。
注釈
外部プラグイン にはQGISで特定のフォーマットファイルを開くためのツールも提案するものがあります。
ファイルからレイヤーを読み込む
ファイルからレイヤーを読み込むには:
for vector data (like Shapefile, Mapinfo or dxf layer), click on
 Add Vector Layer toolbar button, select the
 Add Vector
Layer menu option or press Ctrl+Shift+V.
This will bring up a new window (see figure_vector_add) from which you can
check
  File and click on Browse. You can
also specify the encoding for the file if desired.
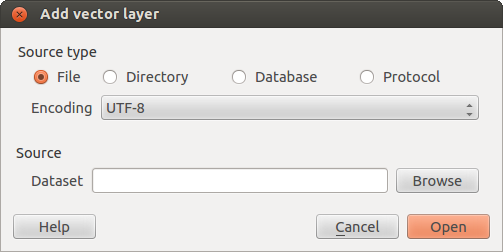
ベクターレイヤーダイアログを追加
ラスターレイヤーの場合は、
 ラスターレイヤーを追加 アイコンをクリックし、
  ラスターレイヤーを追加 メニューオプションを選択するか、または Ctrlキー+Shiftキー+R をキーボード入力します。
これにより、ファイルシステムをナビゲートし、シェープファイル、geotiff、またはその他のサポートされているデータソースを読み込むことができる標準の[ファイルを開く]ダイアログ( figure_vector_open 参照)が表示されます。選択ボックス フィルタ  サポートされているファイル形式をあらかじめ選択できます。十分テストされている形式だけがリストに表示されます。
 すべてのファイル(*.*) を選択することで、未テストの他のフォーマットを読み込むことができます。
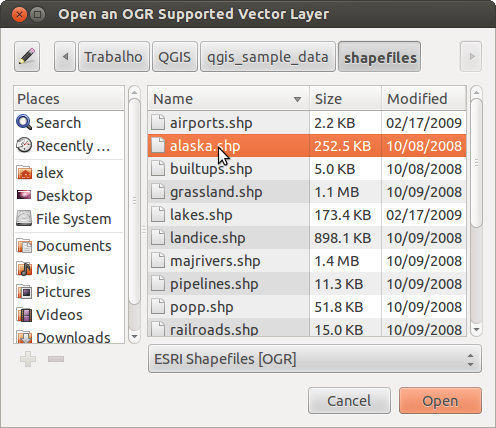
OGRサポートベクタレイヤーダイアログを開きます。
Selecting a file from the list and clicking Open loads it into QGIS.
More than one layer can be loaded at the same time by holding down the
Ctrl or Shift key and clicking on multiple items in the dialog.
Figure_vector_loaded shows QGIS after loading the alaska.shp file.
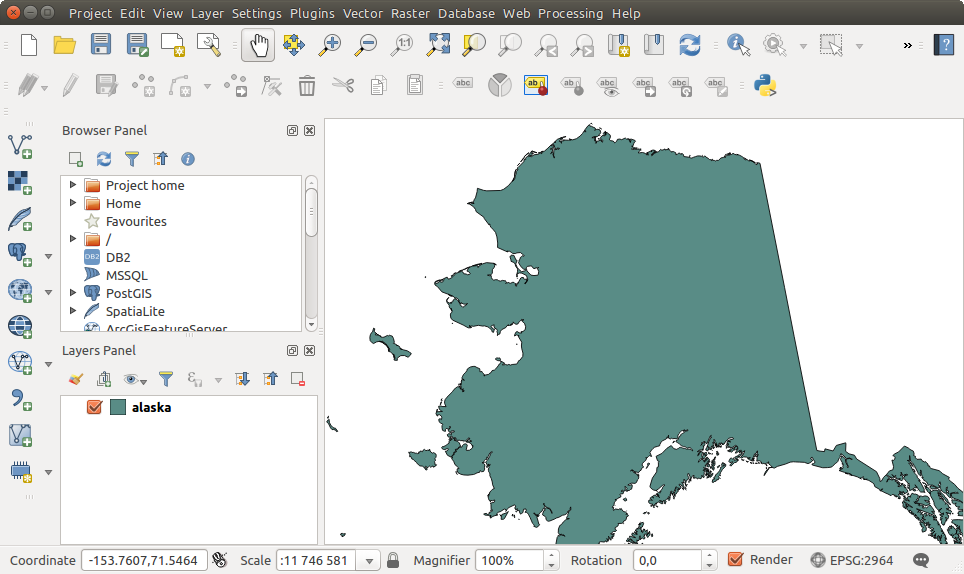
アラスカのシェープファイルがロードされたQGIS
注釈
MapInfo(例えば、 .tab )やAutocad( .dxf )のようないくつかのフォーマットは、1つのファイルに異なるタイプのジオメトリを混在させることができるので、QGISでそのようなフォーマットをロードすると、レイヤーあたり1つのジオメトリとするために使用するダイアログが開きます。
Using the  Add Vector Layer tool:
You can also load specific formats like
ArcInfo Binary Coverage,UK. National Transfer Format, as well as the raw TIGER format of theUS Census BureauorOpenfileGDB. To do that, you'd need to select Directory as Source type. In this case
a directory can be selected in the dialog after pressing Browse.
Directory as Source type. In this case
a directory can be selected in the dialog after pressing Browse.With the
 Database source type you can select an
existing database connection or create one to the selected database type.
Available database types are
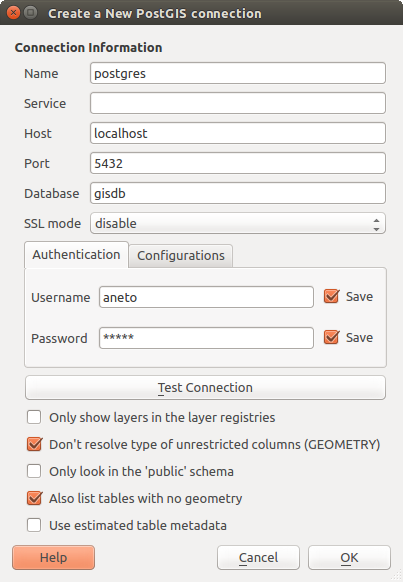
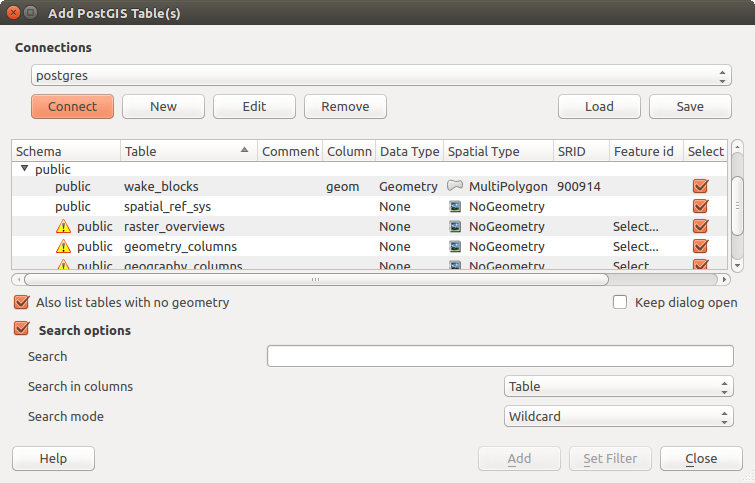
 ODBC,OGDI Vectors,Esri Personal Geodatabase,MySQLas well asPostgreSQLorMSSQL.Pressing the New button opens the Create a New OGR Database Connection dialog whose parameters are among the ones you can find in ストアドコネクションを作成する. Pressing Open you can select from the available tables for example of the PostGIS enabled database.
The last source type,
 Protocol, enables to open
data from the web using for example
 GeoJSONorCouchDBformat. After selecting the type you have to fill URI of the source.
ちなみに
macOSで外部ドライブからレイヤーとプロジェクトをロードする
On macOS, portable drives that are mounted beside the primary hard drive
do not show up as expected under .
We are working on a more macOS-native open/save dialog to fix this.
As a workaround, you can type /Volumes in the File name box
and press Enter. Then you can navigate to external drives and network
mounts.
区切りテキストファイルをインポートする
Delimited text file (e.g. .csv, .txt) can be loaded in QGIS
using the tools described above. However, loaded this way, it'll show up like a
simple table data. Sometimes, delimited text files can contain geometric data
you'd want to visualize; this is what the  Add
Delimited Text Layer is designed for.
Click the  Open Data Source Manager icon to open the
Data Source Manager dialog and enable the
  Delimited Text tab, as shown in figure_delimited_text.
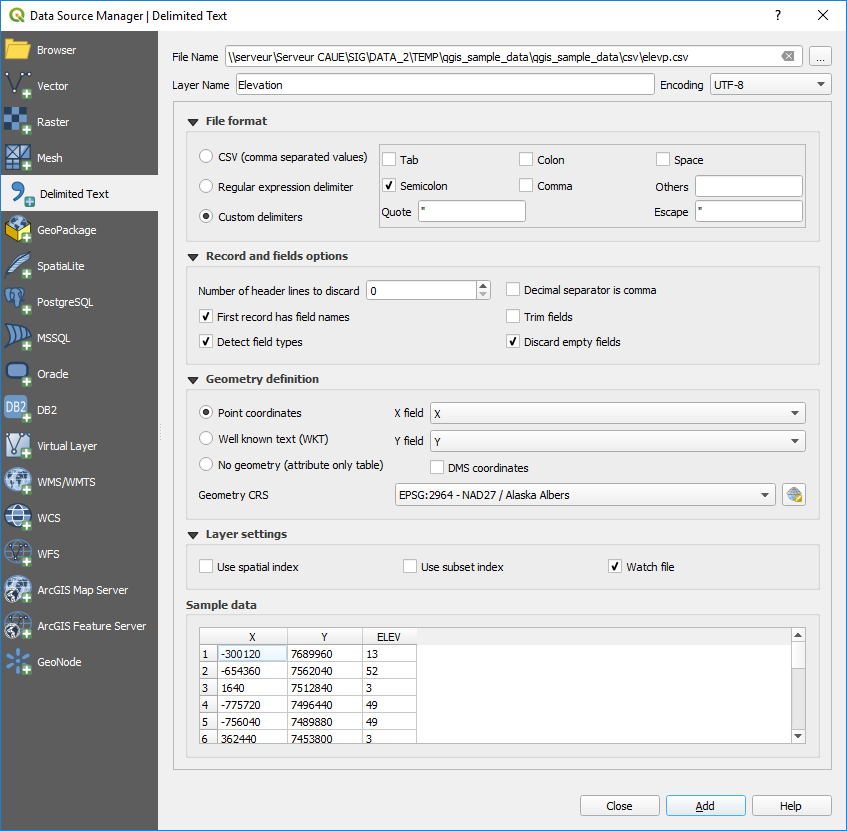
区切りテキストダイアログ
First, select the file to import (e.g., qgis_sample_data/csv/elevp.csv)
by clicking on the Browse button. In the Layer name field,
provide the name to use for the layer in the project (e.g., Elevation).
File format
Once the file is selected, QGIS attempts to parse the file with the most recently used delimiter, trying to identify fields and rows. To enable QGIS to properly parse the file, it is important to select the correct delimiter. You can specify a delimiter by activating:
Records and fields
Other than settings to identify rows and fields in the data, some convenient options can be used to tweak the data recognition:
Number of header lines to discard: convenient when you want to avoid some lines to show in the import, either because those are blank lines or with another formatting.
 First records has field names: values in the first row
of data are used as field names, otherwise QGIS adds a fields row of a type
field_1,field_2... Detect field types: automatically recognizes the field
type. If unchecked then all attributes are treated as text fields.
 Decimal separator is comma: if necessary, you can force
a comma to be the decimal separator.
 Trim fields: allows you to trim leading and trailing
spaces from fields.
As you set the parser properties, a sample data preview updates at the bottom of the dialog.
Geometry definition
Once the file is parsed, set Geometry definition to
 Point coordinates and provide the X
field and Y field if the layer is of point geometry type and
contain such coordinate fields. If the coordinates are defined as
degrees/minutes/seconds, activate the
  DMS coordinates
checkbox;
 Well known text (WKT) option if the spatial
information is represented by WKT: select the Geometry field
containing the WKT definition and choose the approriate Geometry
field or let QGIS auto-detect it;
Well known text (WKT) option if the spatial
information is represented by WKT: select the Geometry field
containing the WKT definition and choose the approriate Geometry
field or let QGIS auto-detect it;If the file contains non-spatial data, activate
 No
geometry (attribute only table) and it will be loaded as an ordinary table.
Besides the features geometry information, you can also set the layer's
Geometry CRS using the  Select CRS widget.
Layer settings
また、以下を有効にできます:
 Use spatial index to improve the performance of
displaying and spatially selecting features;
 Use subset index to improve performance of subset
filters (when defined in the layer properties);
 Watch file to watch for changes to the file by other
applications while QGIS is running.
At the end, click OK to add the layer to the map. In our example, a
point layer named Elevation is added to the project and behaves like any
other map layer in QGIS. However, this layer is the result of a query on the
.csv source layer (hence, linked to it) and would require to be
saved in order to get a spatial layer on disk.
DXFまたはDWGファイルをインポートする
DXF and DWG files can be added to QGIS by simple drag-and-drop
from the common
Browser Panel. You'll be prompted to select the sublayers you'd like to add
to the project. Layers are added with random style properties.
注釈
いくつかのジオメトリタイプ(ポイント、ライン、および/またはポリゴン)を含むDXFファイルは、レイヤーの名前は <filename.dxf>エンティティ <geometry type> から作られます。
To keep the dxf/dwg file structure and its symbology in QGIS, you may want to use the dedicated tool which allows you to:
import elements from the drawing file into a GeoPackage database.
and add to the project any of the imported elements.
In the DWG/DXF Import dialog, to first import the drawing file contents:
Input the location of the Target package, i.e. the new GeoPackage file that will store the data. If an existing file is provided, then it will be overwritten.
Specify the coordinate reference system of the data in the drawing file.
Check
 Expand block references to import the
blocks in the drawing file as normal elements.
Expand block references to import the
blocks in the drawing file as normal elements.Check
 Use curves to promote the imported layers
to a
 curvedgeometry type.Use the Import button to select the DWG/DXF file to use (one per geopackage). The GeoPackage database will be automatically populated with the drawing file content. Depending on the size of the *CAD file, this could take some time.
After the .dwg or .dxf data is imported into the GeoPackage
database the frame in the lower half of the dialog is populated with the list of
layers from the imported file. There you can select which layers to add to the
QGIS project:
At the top, set a Group name to group the drawing files in the project.
Check layers to show: Each selected layer is added to an ad hoc group which contains vector layers for the point, line, label and area features of the drawing layer. The style of each layer is setup so that it resembles the look it originally had in *CAD.
Check whether layer should be visible at opening.
Alternatively using the
 Merge layers option places all
layers in a single group.
Merge layers option places all
layers in a single group.Press OK to open the layers in QGIS.
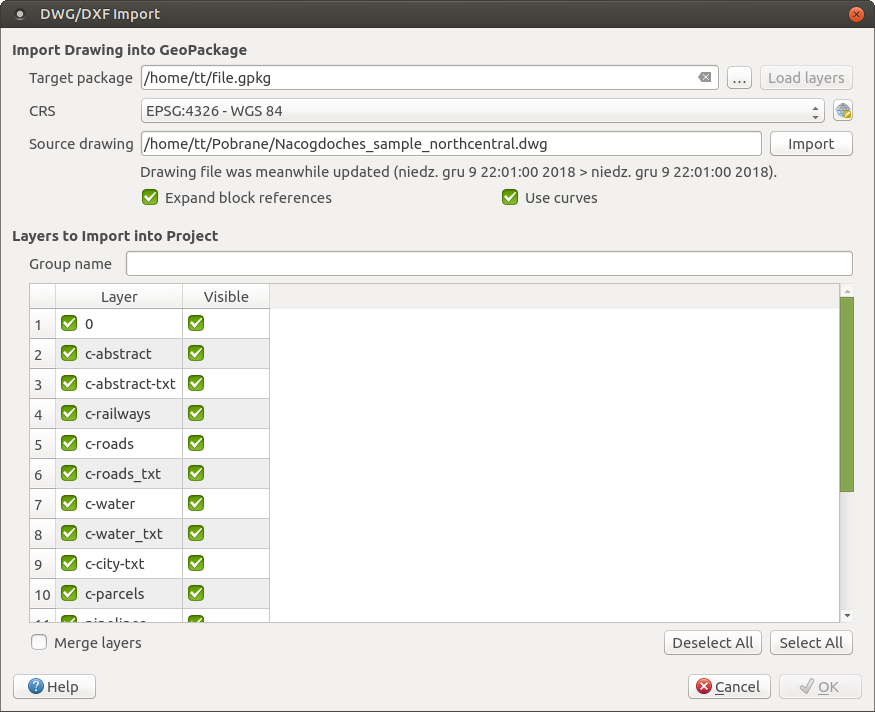
Import dialog for DWG/DXF files
OpenStreetMapベクターをインポートする
多くの国で、このようなデジタル道路地図などの無料の地理データが利用できないため、近年では、OpenStreetMapのプロジェクトが人気を博しています。OSMプロジェクトの目的は、GPSデータ、航空写真や地元の知識から、世界の自由な編集可能な地図を作成することです。この目的をサポートするために、QGISはOSMデータのサポートを提供します。
ブラウザパネル を使用して .osm ファイルを地図キャンバスにロードできます。この場合、ジオメトリタイプに基づいてサブレイヤを選択するダイアログが表示されます。ロードされたレイヤーには、ファイル内にそのジオメトリタイプのすべてのデータが格納され、 osm ファイルのデータ構造が保持されます。
SpatiaLite レイヤー
 初めてSpatiaLiteデータベースからデータをロードするときは、以下で始めます:
This will bring up a window that will allow you either to connect to a
SpatiaLite database already known to QGIS, which you can choose from the
drop-down menu, or to define a new connection to a new database. To define a
new connection, click on New and use the file browser to point to
your SpatiaLite database, which is a file with a .sqlite extension.
QGISもSpatiaLiteで編集可能なビューをサポートしています。
GRASS
GRASSベクターデータでの作業は、 GRASS GIS の統合 セクションに記載されています。
QGISカスタムフォーマット
QGISでは、独自のロードツールを使用してアプリケーションにロードできる2つのカスタムフォーマットを提案しています:
一時的な落書きレイヤー:開いているプロジェクトにバインドされているメモリレイヤー(詳細は 新しい一時的な落書きレイヤーを作成する を参照)
仮想レイヤー:他のレイヤーに対するクエリの結果として得られるレイヤー(詳細は Creating virtual layers を参照)
QLR - QGIS Layer Definition File
Layer definitions can be saved as a
Layer Definition File (QLR -
.qlr) using
in the layer
context menu.
The QLR format makes it possible to share "complete" QGIS layers with other QGIS users. QLR files contain links to the data sources and all the QGIS style information necessary to style the layer.
QLR files are shown in the Browser Panel and can be used to add layers (with their saved styles) to the Layers Panel. You can also drag and drop QLR files from the system file manager into the map canvas.
ウェブサービスへ接続する
QGISを使用すると、さまざまな種類のOGC Webサービス (WM(T)S, WFS(-T), CSW ...)にアクセスできます。 QGIS サーバーのおかげで、これらのサービスを公開することもできます。これらの機能と使用方法については、 OGCデータの操作 の章で説明しています。


