.
Die Werkzeugkiste
Die Verarbeitunswerkzeuge sind das Hauptelement der Verarbeitung GUI und das was Sie eher bei Ihrer täglichen Arbeit benutzen werden. Es zeigt die Liste von verfügbaren Algorithmen in verschiedenen Blöcken gruppiert und ist der Anknüpfungspunkt um Sie auszuführen, entweder als einfachen Prozess oder als Batchprozess mit mehreren Ausführungen des gleichen Algorithmus auf verschiedene Inputdatensätze.
Figure Processing 5:
The toolbox contains all the available algorithms, divided into predefined groups. All these groups are found under a single tree entry named Geoalgorithms.
Additionally, two more entries are found, namely Models and Scripts. These include user-created algorithms, and they allow you to define your own workflows and processing tasks. We will devote a full section to them a bit later.
Im oberen Teil der Werkzeugkiste finden Sie ein Textfeld. Um die Anzahl der Algorithmen die in der Werkzeugkiste gezeigt werden zu verringern und um es Ihnen zu erleichtern den den Sie brauchen zu finden, können Sie jedes beliebige Wort oder Satz in das Textfeld eingeben. Stellen Sie fest, dass während der Eingabe die Anzahl von Algorithmen in der Werkzeugkiste auf genau die, die den Text, den Sie eingegeben haben enthalten, verringert ist.
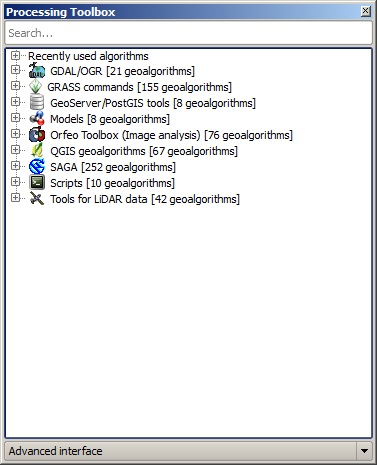
In the lower part, you will find a box that allows you to switch between the simplified algorithm list (the one explained above) and the advanced list. If you change to the advanced mode, the toolbox will look like this:
Figure Processing 6:
In the advanced view, each group represents a so-called ‘algorithm provider’, which is a set of algorithms coming from the same source, for instance, from a third-party application with geoprocessing capabilities. Some of these groups represent algorithms from third-party applications like SAGA, GRASS or R, while others contain algorithms directly coded as part of the processing plugin, not relying on any additional software.
This view is recommended to those users who have a certain knowledge of the applications that are backing the algorithms, since they will be shown with their original names and groups.
Also, some additional algorithms are available only in the advanced view, such as LiDAR tools and scripts based on the R statistical computing software, among others. Independent QGIS plugins that add new algorithms to the toolbox will only be shown in the advanced view.
In particular, the simplified view contains algorithms from the following providers:
- GRASS
- SAGA
- OTB
- Native QGIS algorithms
In the case of running QGIS under Windows, these algorithms are fully-functional in a fresh installation of QGIS, and they can be run without requiring any additional installation. Also, running them requires no prior knowledge of the external applications they use, making them more accesible for first-time users.
If you want to use an algorithm not provided by any of the above providers, switch to the advanced mode by selecting the corresponding option at the bottom of the toolbox.
Um einen Algorithmus zu starten, klicken Sie einfach doppelt auf den Namen in der Toolbox.
Der Algorithmus Dialog
Once you double-click on the name of the algorithm that you want to execute, a dialog similar to that in the figure below is shown (in this case, the dialog corresponds to the SAGA ‘Convergence index’ algorithm).
Figure Processing 7:
This dialog is used to set the input values that the algorithm needs to be executed. It shows a table where input values and configuration parameters are to be set. It of course has a different content, depending on the requirements of the algorithm to be executed, and is created automatically based on those requirements. On the left side, the name of the parameter is shown. On the right side, the value of the parameter can be set.
Obwohl die Anzahl und Art der Parameter von den Eigenschaften des Algorithmus abhängt, ist die Struktur für alle ähnlich. Die Parameter die Sie in der Tabelle finden können können folgende Typen sein.
A raster layer, to select from a list of all such layers available (currently opened) in QGIS. The selector contains as well a button on its right-hand side, to let you select filenames that represent layers currently not loaded in QGIS.
A vector layer, to select from a list of all vector layers available in QGIS. Layers not loaded in QGIS can be selected as well, as in the case of raster layers, but only if the algorithm does not require a table field selected from the attributes table of the layer. In that case, only opened layers can be selected, since they need to be open so as to retrieve the list of field names available.
Sie werden einen Knopf bei jeder Vektorlayerauswahl sehen, wie in der Abbildung unten gezeigt.
Figure Processing 8:
Wenn der Algorithmus mehrere davon enthält können Sie auch nur einen von Ihnen umschalten. Wenn der zu einer Vektoreingabe gehörende Knopf umgeschaltet ist wird der Algorithmus iterativ mit jedem seiner Objekte ausgeführt anstatt nur einmal für den ganzen Layer und erstellt so viele Ausgaben wie der Algorithmus ausgeführt wurde. Dies ermöglicht es den Ablauf zu automatisieren wenn alle Objekte in einem Layer separat verarbeitet werden müssen.
- A table, to select from a list of all available in QGIS. Non-spatial tables are loaded into QGIS like vector layers, and in fact they are treated as such by the program. Currently, the list of available tables that you will see when executing an algorithm that needs one of them is restricted to tables coming from files in dBase (.dbf) or Comma-Separated Values (.csv) formats.
Eine Option, um mögliche Parameter aus einer Auswahlliste zu wählen.
- A numerical value, to be introduced in a text box. You will find a button by its side. Clicking on it, you will see a dialog that allows you to enter a mathematical expression, so you can use it as a handy calculator. Some useful variables related to data loaded into QGIS can be added to your expression, so you can select a value derived from any of these variables, such as the cell size of a layer or the northernmost coordinate of another one.
Figure Processing 9:
Ein Wertebereich mit Minimum und Maxmum, der über zwei Textfelder angegeben wird.
Ein Text, der in ein Textfeld eingegeben wird.
Eine Spalte, die aus einer Attributtabelle ausgewählt wird oder eine einzelne Tabelle.
Ein Koordinatenbezugssystem. Sie können einen EPSG Code direkt ins Textfenster eingeben oder es direkt aus der Koordinatenbezugssystem-Auswahl, die erscheint wenn Sie auf den Knopf auf der rechten Seite klicken, auswählen.
Vier Zahlen, die eingegeben werden, um die xmin, xmax, ymin, ymax Grenzen festzulegen. Mit einem Klick auf den Knopf auf der rechten Seite erscheint ein Pop-up-Menü mit zwei Optionen: um den Wert aus einem Layer zu übernehmen oder um das aktuelle Ausmaß über das Kartenfensters zu wählen, indem Sie durch Aufziehen eines Rechtecks im Kartenfenster die Ausdehnung definieren.
Figure Processing 10
Wenn Sie die erste Option wählen, sehen Sie einen Dialog wie den nächsten.
Figure Processing 11
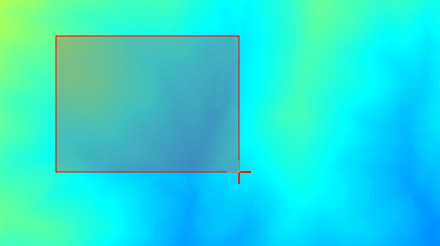
Wenn Sie den zweiten wählen, wird das Parameter-Fenster verschwinden, damit Sie durch Klicken und Ziehen im Kartenfenster einen Bereich definieren können. Wenn das Rechteck definiert ist, wird der Dialog mit den Werten wieder auftauchen.
Figure Processing 12:
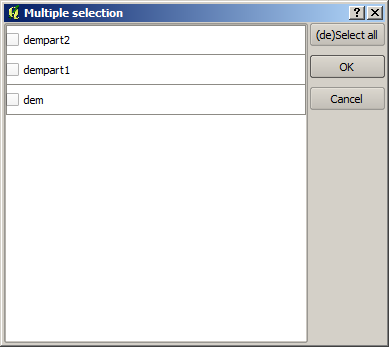
A list of elements (whether raster layers, vector layers or tables), to select from the list of such layers available in QGIS. To make the selection, click on the small button on the left side of the corresponding row to see a dialog like the following one.
Figure Processing 13:
Eine kleine Tabelle, um vom Benutzer editiert werden kann. Diese wird verwendet, um Parameter wie Lookup-Tabellen oder Convolution Filter zu definieren.
Klicken Sie auf den Knopf auf der rechten Seite, um die Tabelle zu sehen und zu editieren.
Figure Processing 14:
In Abhängigkeit vom Algorithmus kann die Anzahl der Zeilen verändert werden oder auch nicht, indem Sie auf den Knopf rechts neben dem Fenster klicken.
You will find a [Help] tab in the the parameters dialog. If a help file is available, it will be shown, giving you more information about the algorithm and detailed descriptions of what each parameter does. Unfortunately, most algorithms lack good documentation, but if you feel like contributing to the project, this would be a good place to start.
Bemerkung zum Thema Projektionen
Algorithms run from the processing framework — this is also true of most of the external applications whose algorithms are exposed through it. Do not perform any reprojection on input layers and assume that all of them are already in a common coordinate system and ready to be analized. Whenever you use more than one layer as input to an algorithm, whether vector or raster, it is up to you to make sure that they are all in the same coordinate system.
Note that, due to QGIS‘s on-the-fly reprojecting capabilities, although two layers might seem to overlap and match, that might not be true if their original coordinates are used without reprojecting them onto a common coordinate system. That reprojection should be done manually, and then the resulting files should be used as input to the algorithm. Also, note that the reprojection process can be performed with the algorithms that are available in the processing framework itself.
By default, the parameters dialog will show a description of the CRS of each layer along with its name, making it easy to select layers that share the same CRS to be used as input layers. If you do not want to see this additional information, you can disable this functionality in the processing configuration dialog, unchecking the Show CRS option.
Wenn Sie versuchen einen Algorithmus auszuführen indem Sie als Eingabe zwei oder mehr Layer mit nicht zutreffenden KBSs verwenden, wird ein Warndialog gezeigt.
Sie können den Algorithmus immer noch ausführen, seien Sie sich aber dessen bewusst dass dies in den meisten Fällen zu falschen Ergebnissen führt, so z.B. leere Layer aufgrunddessen dass Eingabelayer nicht überlappen.
Von Algorithmen erstellte Datenobjekte
Von Algorithmen erstellte Datenobjekte können jeder der folgenden Typen sein:
Rasterlayer
Vektorlayer
Tabelle
HTML-Datei (wird für Text und grafische Ausgabe verwendet)
These are all saved to disk, and the parameters table will contain a text box corresponding to each one of these outputs, where you can type the output channel to use for saving it. An output channel contains the information needed to save the resulting object somewhere. In the most usual case, you will save it to a file, but the architecture allows for any other way of storing it. For instance, a vector layer can be stored in a database or even uploaded to a remote server using a WFS-T service. Although solutions like these are not yet implemented, the processing framework is prepared to handle them, and we expect to add new kinds of output channels in a near feature.
To select an output channel, just click on the button on the right side of the text box. That will open a save file dialog, where you can select the desired file path. Supported file extensions are shown in the file format selector of the dialog, depending on the kind of output and the algorithm.
The format of the output is defined by the filename extension. The supported formats depend on what is supported by the algorithm itself. To select a format, just select the corresponding file extension (or add it, if you are directly typing the file path instead). If the extension of the file path you entered does not match any of the supported formats, a default extension (usually .dbf` for tables, .tif for raster layers and .shp for vector layers) will be appended to the file path, and the file format corresponding to that extension will be used to save the layer or table.
If you do not enter any filename, the result will be saved as a temporary file in the corresponding default file format, and it will be deleted once you exit QGIS (take care with that, in case you save your project and it contains temporary layers).
You can set a default folder for output data objects. Go to the configuration dialog (you can open it from the Processing menu), and in the General group, you will find a parameter named Output folder. This output folder is used as the default path in case you type just a filename with no path (i.e., myfile.shp) when executing an algorithm.
Wenn Sie einen Algorithmus ausführen, der einen Vektorlayer im iterativen Modus verwendet, wird der eingegebene Dateipfad als Basispfad für alle erstellten Dateien, die mit Hilfe des Basisnamens benannt werden und an die eine Nummer, die den Index der Iteration darstellt, angehängt wird, verwendet. Die Dateierweiterung (und das Format) wird für alle so erstellten Dateien benutzt.
Apart from raster layers and tables, algorithms also generate graphics and text as HTML files. These results are shown at the end of the algorithm execution in a new dialog. This dialog will keep the results produced by any algorithm during the current session, and can be shown at any time by selecting Processing ‣ Results viewer from the QGIS main menu.
Some external applications might have files (with no particular extension restrictions) as output, but they do not belong to any of the categories above. Those output files will not be processed by QGIS (opened or included into the current QGIS project), since most of the time they correspond to file formats or elements not supported by QGIS. This is, for instance, the case with LAS files used for LiDAR data. The files get created, but you won’t see anything new in your QGIS working session.
Für alle anderen Arten von Ausgaben finden Sie ein Kontrollkästchen, mit dem sie festlegen können, ob die Datei in QGIS geladen werden soll oder nicht, wenn sie durch den Algorithmus erzeugt wurde. Standardmäßig werden alle Dateien angezeigt.
Optional outputs are not supported. That is, all outputs are created. However, you can uncheck the corresponding checkbox if you are not interested in a given output, which essentially makes it behave like an optional output (in other words, the layer is created anyway, but if you leave the text box empty, it will be saved to a temporary file and deleted once you exit QGIS).
Die Verarbeiten Umgebung konfigurieren
Wie bereits erwähnt wurde, gibt das Konfigurationsmenü Zugang zu einem neuen Dialog, in dem Sie festlegen, wie Algorithmen funktionieren. Die Konfigurationsparameter sind in separate Blöcke strukturiert und können auf der linken Seite des Dialogs ausgewählt werden.
Along with the aforementioned Output folder entry, the General block contains parameters for setting the default rendering style for output layers (that is, layers generated by using algorithms from any of the framework GUI components). Just create the style you want using QGIS, save it to a file, and then enter the path to that file in the settings so the algorithms can use it. Whenever a layer is loaded by SEXTANTE and added to the QGIS canvas, it will be rendered with that style.
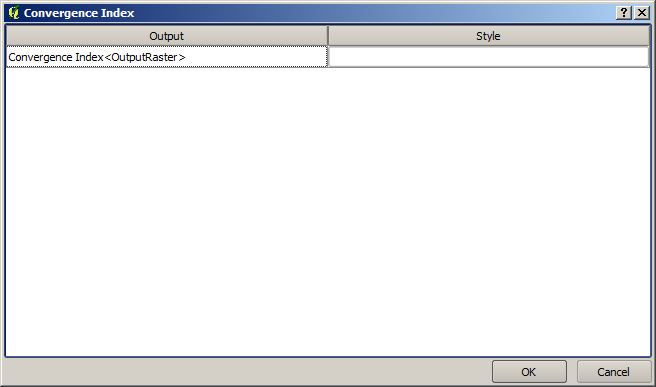
Die Darstellungsstile können individuell für jeden Algorithmus und jeden seiner Ausgaben kofiguriert werden. Machen Sie einfach einen Rechtsklick auf den Namen des Algorithmus in der Werkzeugkiste und wählen Sie Darstellungsstile zur Ausgabe bereiten. Sie werden einen Dialog wie unten gezeigt sehen.
Figure Processing 15:
Wählen Sie die Stildatei (.qml) für jede Ausgabedatei und klicken Sie dann [OK].
Andere Konfigurationsparameter in der General Gruppe sind unten aufgeführt:
Use filename as layer name. Der Name jedes resultierenden Layers, der von einem Algorithmus erstellt wurde, wird durch den Algorithmus selber definiert. In einigen Fällen kann ein fester Name verwendet werden, was heißt dass der selbe Ausgabename benutzt wird, egal welcher Inputlayer verwendet wird. In anderen Fällen, kann der Name von dem Eingabelayer oder einigen Parametern, die verwendet werden um den Algorithmus auszuführen, abhängen. Wenn dieses Kontrollkästchen aktiviert ist wird anstelle dessen der Name dem Ausgabedateinamen entnommen. Beachten Sie dass wenn die Ausgabe in eine temporäre Datei gespeichert wird, der Name dieser temporären Datei für gewöhnlich lang und bedeutungslos ist und damit Kollisionen mit bereits existierenden Dateinamen vermieden werden sollen.
Use only selected features. Wenn diese Option ausgewählt ist, werden nur ausgewählte Objekte verwendet wenn ein Vektorlayer als Eingabe für einen Algorithmus benutzt wird. Wenn der Layer keine ausgewählten Objekte hat, werden alle Objekte benutzt.
Pre-execution script und Post-execution script. Diese Paramter beziehen sich auf Scripts, die anhand der Verarbeitung Scipting Funktionaliät geschrieben worden sind und werden in dem Abschnitt, der Scripting und Konsole abdeckt erklärt.
Abgesehen vom Bereich General im Menü Optionen und Konfiguration, finden Sie auch einen für jeden Algorithmus-Provider. Sie enthalten ein aktivieren Element, das Sie verwenden können, um festzulegen, ob Algorithmen dieses Providers in der Toolbox erscheinen oder nicht. Auch haben einige Provider ihre eigene Algorithmus-Konfiguration, die wir später noch genauer erklären wenn bestimmte Algorithmus Provider abgedeckt werden.


