.
QGIS GUI
When QGIS starts, you are presented with the GUI as shown in the figure (the numbers 1 through 5 in yellow circles are discussed below).
Figure QGIS GUI 1:
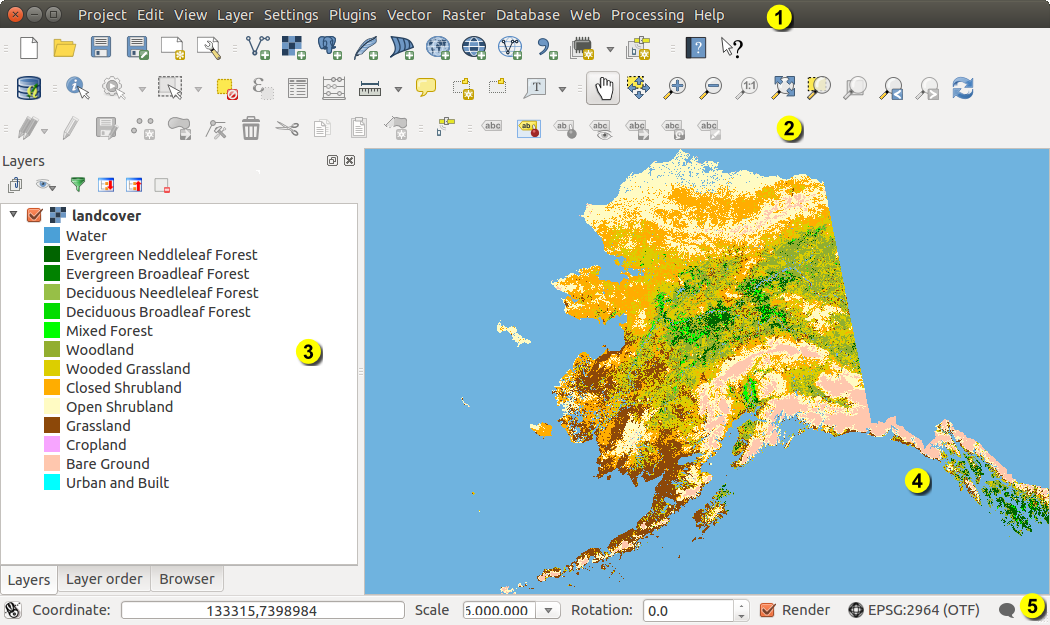
QGIS GUI with Alaska sample data 
Bemerkung
Das Aussehen einzelner Bereiche (Titelleiste, etc.) kann in Abhängigkeit vom Betriebssystem und dem Fenstermanager abweichen.
The QGIS GUI is divided into five areas:
Menüleiste
- Tool Bar
- Map Legend
Kartenfenster
Statusleiste
These five components of the QGIS interface are described in more detail in the following sections. Two more sections present keyboard shortcuts and context help.
Menüleiste
The menu bar provides access to various QGIS features using a standard hierarchical menu. The top-level menus and a summary of some of the menu options are listed below, together with the associated icons as they appear on the toolbar, and keyboard shortcuts. The shortcuts presented in this section are the defaults; however, keyboard shortcuts can also be configured manually using the Configure shortcuts dialog, opened from Settings ‣ Configure Shortcuts....
Obwohl fast jede Anwendung der Menüleiste ein entsprechendes Icon in der Werkzeugleiste besitzt, ist die Anordnung unterschiedlich. Die Werkzeugleiste mit der entsprechenden Anwendung ist hinter jedem Menüeintrag als Kontrollkästchen angegeben. Weitere Informationen über die Werkzeuge in der Werkzeugleiste finden Sie in Abschnitt Werkzeugleiste.
Projekt
Menüleiste |
Tastenkürzel |
Referenz |
Werkzeugleiste |
|---|---|---|---|
 New New |
Ctrl+N | siehe QGIS Projekte |
Projekt |
 Open Open |
Strg+O |
siehe QGIS Projekte |
Projekt |
Neu aus Vorlage ‣ |
siehe QGIS Projekte |
Projekt |
|
| Open Recent ‣ | siehe QGIS Projekte |
||
 Save Save |
Strg+S |
siehe QGIS Projekte |
Projekt |
 Save As... Save As... |
Strg+Shift+S |
siehe QGIS Projekte |
Projekt |
 Save as Image... Save as Image... |
siehe Ausgabe |
||
| DXF Export ... | siehe Ausgabe |
||
 New Print Composer New Print Composer |
Strg+P |
siehe Druckzusammenstellung |
Projekt |
 Composer manager ... Composer manager ... |
siehe Druckzusammenstellung |
Projekt |
|
Druckzusammenstellungen ‣ |
siehe Druckzusammenstellung |
||
 Exit QGIS Exit QGIS |
Strg+Q |
Bearbeiten
Menüleiste |
Tastenkürzel |
Referenz |
Werkzeugleiste |
|---|---|---|---|
 Undo Undo |
Strg+Z |
Erweiterte Digitalisierung |
|
 Redo Redo |
Strg+Shift+Z |
Erweiterte Digitalisierung |
|
 Cut Features Cut Features |
Strg+X |
Digitalisierung |
|
 Copy Features Copy Features |
Strg+C |
Digitalisierung |
|
 Paste Features Paste Features |
Strg+V |
Digitalisierung |
|
Objekte einfügen als ‣ |
|||
 Add Feature Add Feature |
Strg+. |
Digitalisierung |
|
 Move Feature(s) Move Feature(s) |
Digitalisierung |
||
 Delete Selected Delete Selected |
Digitalisierung |
||
 Rotate Feature(s) Rotate Feature(s) |
Erweiterte Digitalisierung |
||
 Simplify Feature Simplify Feature |
Erweiterte Digitalisierung |
||
 Add Ring Add Ring |
Erweiterte Digitalisierung |
||
 Add Part Add Part |
Erweiterte Digitalisierung |
||
 Fill Ring Fill Ring |
Erweiterte Digitalisierung |
||
 Delete Ring Delete Ring |
Erweiterte Digitalisierung |
||
 Delete Part Delete Part |
Erweiterte Digitalisierung |
||
 Reshape Features Reshape Features |
Erweiterte Digitalisierung |
||
 Offset Curve Offset Curve |
Erweiterte Digitalisierung |
||
 Split Features Split Features |
Erweiterte Digitalisierung |
||
 Split Parts Split Parts |
Erweiterte Digitalisierung |
||
 Merge Selected Features Merge Selected Features |
Erweiterte Digitalisierung |
||
| Merge Attr. of Selected Features |
Erweiterte Digitalisierung |
||
 Node Tool Node Tool |
Digitalisierung |
||
| Rotate Point Symbols |
Erweiterte Digitalisierung |
After activating  Toggle editing mode for a layer,
you will find the Add Feature icon in the Edit menu
depending on the layer type (point, line or polygon).
Toggle editing mode for a layer,
you will find the Add Feature icon in the Edit menu
depending on the layer type (point, line or polygon).
Bearbeiten (extra)
Menüleiste |
Tastenkürzel |
Referenz |
Werkzeugleiste |
|---|---|---|---|
| Add Feature |
Digitalisierung |
||
 Add Feature Add Feature |
Digitalisierung |
||
 Add Feature Add Feature |
Digitalisierung |
Ansicht
Menüleiste |
Tastenkürzel |
Referenz |
Werkzeugleiste |
|---|---|---|---|
 Pan Map Pan Map |
Kartennavigation |
||
 Pan Map to Selection Pan Map to Selection |
Kartennavigation |
||
 Zoom In Zoom In |
Strg++ |
Kartennavigation |
|
 Zoom Out Zoom Out |
Strg+- |
Kartennavigation |
|
Auswahl ‣ |
Attribute |
||
 Identify Features Identify Features |
Strg+Shift+I |
Attribute |
|
Messen ‣ |
siehe sec_measure |
Attribute |
|
 Zoom Full Zoom Full |
Strg+Shift+F |
Kartennavigation |
|
 Zoom To Layer Zoom To Layer |
Kartennavigation |
||
 Zoom To Selection Zoom To Selection |
Strg+J |
Kartennavigation |
|
 Zoom Last Zoom Last |
Kartennavigation |
||
 Zoom Next Zoom Next |
Kartennavigation |
||
 Zoom Actual Size Zoom Actual Size |
Kartennavigation |
||
Dekorationen ‣ |
siehe Dekorationen |
||
| Preview mode ‣ | |||
 Map Tips Map Tips |
Attribute |
||
 New Bookmark New Bookmark |
Strg+B |
siehe Räumliche Lesezeichen |
Attribute |
 Show Bookmarks Show Bookmarks |
Strg+Shift+B |
siehe Räumliche Lesezeichen |
Attribute |
 Refresh Refresh |
F5 | Kartennavigation |
Layer
Menüleiste |
Tastenkürzel |
Referenz |
Werkzeugleiste |
|---|---|---|---|
| Create Layer ‣ | Layer verwalten |
||
| Add Layer ‣ | Layer verwalten |
||
| Embed Layers and Groups ... | siehe Layer/Gruppen einbinden |
||
| Add from Layer Definition File ... | |||
| Copy style |
see Menü Stil | ||
| Paste style |
see Menü Stil | ||
 Open Attribute Table Open Attribute Table |
Attribute |
||
| Toggle Editing |
Digitalisierung |
||
| Save Layer Edits |
Digitalisierung |
||
 Current Edits ‣ Current Edits ‣ |
Digitalisierung |
||
| Save as... | |||
| Save as layer definition file... | |||
 Remove Layer/Group Remove Layer/Group |
Strg+D |
||
 Duplicate Layers (s) Duplicate Layers (s) |
|||
| Set Scale Visibility of Layers | |||
| Set CRS of Layer(s) | Strg+Shift+C |
||
| Set project CRS from Layer | |||
| Properties ... | |||
| Query... | |||
 Labeling Labeling |
|||
 Add to Overview Add to Overview |
Strg+Shift+O |
Layer verwalten |
|
 Add All To Overview Add All To Overview |
|||
 Remove All From Overview Remove All From Overview |
|||
 Show All Layers Show All Layers |
Strg+Shift+U |
Layer verwalten |
|
 Hide All Layers Hide All Layers |
Strg+Shift+H |
Layer verwalten |
|
| Show selected Layers |
|||
| Hide selected Layers |
Einstellungen
Menüleiste |
Tastenkürzel |
Referenz |
Werkzeugleiste |
|---|---|---|---|
Bedienfelder ‣ |
siehe Panels and Toolbars |
||
Werkzeugkästen ‣ |
siehe Panels and Toolbars |
||
| Toggle Full Screen Mode | F 11 | ||
 Project Properties ... Project Properties ... |
Strg+Shift+P |
siehe QGIS Projekte |
|
 Custom CRS ... Custom CRS ... |
|||
Stilmanager... |
siehe Presentation |
||
 Configure shortcuts ... Configure shortcuts ... |
|||
| Customization ... |
siehe Anpassung |
||
| Options ... |
siehe Optionen |
||
| Snapping Options ... |
Erweiterungen
Menüleiste |
Tastenkürzel |
Referenz |
Werkzeugleiste |
|---|---|---|---|
 Manage and Install Plugins ... Manage and Install Plugins ... |
siehe Der Erweiterungen Dialog |
||
| Python Console | Ctrl+Alt+P |
When starting QGIS for the first time not all core plugins are loaded.
Vektor
Menüleiste |
Tastenkürzel |
Referenz |
Werkzeugleiste |
|---|---|---|---|
OpenStreetMap ‣ |
|||
|
siehe fTools Plugin |
||
|
siehe fTools Plugin |
||
|
siehe fTools Plugin |
||
|
siehe fTools Plugin |
||
|
siehe fTools Plugin |


When starting QGIS for the first time not all core plugins are loaded.
Raster
Menüleiste |
Tastenkürzel |
Referenz |
Werkzeugleiste |
|---|---|---|---|
| Raster calculator ... | see Rasterrechner |
When starting QGIS for the first time not all core plugins are loaded.
Database
Menüleiste |
Tastenkürzel |
Referenz |
Werkzeugleiste |
|---|---|---|---|
| Database ‣ | see DB Manager Plugin | Database |
When starting QGIS for the first time not all core plugins are loaded.
Web
Menüleiste |
Tastenkürzel |
Referenz |
Werkzeugleiste |
|---|---|---|---|
| Metasearch | see MetaSearch Katalog Client | Web |
When starting QGIS for the first time not all core plugins are loaded.
Verarbeitung
Menüleiste |
Tastenkürzel |
Referenz |
Werkzeugleiste |
|---|---|---|---|
 Toolbox Toolbox |
siehe Die Werkzeugkiste |
||
 Graphical Modeler ... Graphical Modeler ... |
|||
 History and log ... History and log ... |
siehe Das Protokoll |
||
 Options ... Options ... |
|||
 Results viewer ... Results viewer ... |
|||
 Commander Commander |
Strg+Alt+M |
siehe The QGIS Commander |
When starting QGIS for the first time not all core plugins are loaded.
Hilfe
Menüleiste |
Tastenkürzel |
Referenz |
Werkzeugleiste |
|---|---|---|---|
 Help Contents Help Contents |
F1 | Direkthilfe |
|
 What’s This? What’s This? |
Shift+F1 | Direkthilfe |
|
| API Documentation | |||
| Need commercial support? | |||
 QGIS Home Page QGIS Home Page |
Strg+H |
||
 Check QGIS Version Check QGIS Version |
|||
 About About |
|||
 QGIS Sponsors QGIS Sponsors |
Please note that for Linux , the menu bar items listed above are the
default ones in the KDE window manager. In GNOME, the Settings menu
has different content and its items have to be found here:
| Custom CRS |
Edit |
| Style Manager | Edit |
| Configure Shortcuts |
Edit |
| Customization |
Edit |
| Options |
Edit |
| Snapping Options ... | Edit |
Werkzeugleiste
Die Werkzeugleiste bietet mit Hilfe von Icons Zugriff auf alle Funktionen aus der Menüleiste sowie ein paar zusätzliche Tools, um mit der Karte zu interagieren. Jedes Icon der Werkzeugleiste bietet eine kurze Beschreibung ihrer Funktion. Indem Sie mit der Maus über das Icon fahren, erscheint es.
Every menu bar can be moved around according to your needs. Additionally, every menu bar can be switched off using your right mouse button context menu, holding the mouse over the toolbars (read also Panels and Toolbars).
Tipp
Werkzeugleiste wiederherstellen
If you have accidentally hidden all your toolbars, you can get them back by choosing menu option Settings ‣ Toolbars ‣. If a toolbar disappears under Windows, which seems to be a problem in QGIS from time to time, you have to remove key \HKEY_CURRENT_USER\Software\QGIS\qgis\UI\state in the registry. When you restart QGIS, the key is written again with the default state, and all toolbars are visible again.
Map Legend
The map legend area lists all the layers in the project. The checkbox in each legend entry can be used to show or hide the layer. The Legend toolbar in the map legend are list allow you to Add group, Manage Layer Visibility of all layers or manage preset layers combination, Filter Legend by Map Content, Expand All or Collapse All and Remove Layer or Group.
Figure Layer tools Bar:
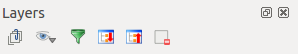
Layer Tool Bar in Map Legend
The button  allows you to add Presets views in the legend. It means that you can choose to display some layer with specific categorization and add this view to the Presets list. To add a preset view just click on , choose Add Preset... from the drop down menu and give a name to the preset. After that you will see a list with all the presets that you can recall pressing on the button.
Alle hinzugefügten Voreinstellungen liegen auch in der Druckzusammenstellung vor um es Ihnen zu ermöglichen eine Karte auf Basis Ihrer bestimmten Views zu erstellen (siehe Haupteigenschaften).
Die Z-Anordnung der Kartenlayer kann mit der ‘drag and drop’ Funktion der Maus festgelegt werden. Z-Anordnung bedeutet, dass ein weiter oben in der Legende angeordneter Layer über einem weiter unten angeordneten Layer im Kartenfenster angezeigt wird.
Bemerkung
This behaviour can be overridden by the ‘Layer order’ panel.
Layers in the legend window can be organised into groups. There are two ways to do this:
- Press the
 icon to add a new group. Type in a name for
the group and press Enter. Now click on an existing layer and
drag it onto the group.
icon to add a new group. Type in a name for
the group and press Enter. Now click on an existing layer and
drag it onto the group. Wählen Sie einige Layer aus, machen Sie einen Rechtsklick in die Legende und wählen Sie Gewählte gruppieren. Die ausgewählten Layer werden automatisch in eine neue Gruppe gesetzt.
Um einen Layer aus einer Gruppe zu bringen, können Sie ihn herausschieben oder einen Rechtsklick darauf machen und In oberste Ebene bringen wählen. Gruppen können auch in andere Gruppen verschachtelt werden.
Das Kontrollkästchen für eine Gruppe zeigt oder verbirgt alle Layer einer Gruppe mit einem Klick.
The content of the right mouse button context menu depends on whether the
selected legend item is a raster or a vector layer. For GRASS vector layers,
Toggle editing is not available. See section
Digitalisieren und Editieren eines GRASS Vektorlayers for information on editing GRASS vector layers.
Right mouse button menu for raster layers
- Zoom to Layer
- Show in overview
- Zoom to Best Scale (100%)
- Remove
- Duplicate
Maßstabsabhängige Sichtbarkeit des/der Layer setzen
- Set Layer CRS
Layer-KBS dem Projekt zuweisen
- Styles ‣
- Save as ...
- Save As Layer Definition File ...
Eigenschaften ...
Umbenennen
Additionally, according to layer position and selection
- Move to Top-level
Gewählte gruppieren
Right mouse button menu for vector layers
- Zoom to Layer
- Show in overview
- Remove
- Duplicate
Maßstabsabhängige Sichtbarkeit des/der Layer setzen
- Set Layer CRS
Layer-KBS dem Projekt zuweisen
- Styles ‣
- Open Attribute Table
- Toggle Editing (not available for GRASS layers)
- Save As ...
- Save As Layer Definition Style
Filter ...
- Show Feature Count
Eigenschaften ...
Umbenennen
Additionally, according to layer position and selection
- Move to Top-level
Gewählte gruppieren
Right mouse button menu for layer groups
- Zoom to Group
- Remove
- Set Group CRS
Umbenennen
- Add Group
Es ist möglich mehr als einen Layer oder Gruppe zur gleichen Zeit auszuwählen indem man die Strg Taste gedrückt hält und die Layer mit der linken Maustaste auswählt. Sie können dann alle ausgewählten Layer gleichzeitig zu einer neuen Gruppe verschieben.
You may also delete more than one layer or group at once by selecting several layers with the Ctrl key and pressing Ctrl+D afterwards. This way, all selected layers or groups will be removed from the layers list.
Mit der legendenunabhängigen Layerreihenfolge arbeiten
There is a panel that allows you to define an independent drawing order for the map legend.
You can activate it in the menu Settings ‣ Panels ‣ Layer
order. This feature allows you to, for instance, order your layers in order of importance,
but still display them in the correct order (see figure_layer_order).
Checking the  Control rendering order box underneath the
list of layers will cause a revert to default behavior.
Control rendering order box underneath the
list of layers will cause a revert to default behavior.
Figure Layer Order:

Define a legend independent layer order
Kartenfenster
This is the “business end” of QGIS — maps are displayed in this area! The map displayed in this window will depend on the vector and raster layers you have chosen to load (see sections that follow for more information on how to load layers). The map view can be panned, shifting the focus of the map display to another region, and it can be zoomed in and out. Various other operations can be performed on the map as described in the toolbar description above. The map view and the legend are tightly bound to each other — the maps in view reflect changes you make in the legend area.
Tipp
Mit dem Mausrad in der Karte zoomen
Sie können das Mausrad benutzen, um im Kartenfenster in Layer hinein- bzw. hinauszuzoomen. Platzieren Sie dazu den Mauszeiger im Kartenfenster und drehen Sie das Mausrad nach vorne (Hinauszoomen) oder nach hinten zum Hineinzoomen. Der Mauszeiger bildet dabei das Zentrum. Sie können das Verhalten des Mausrades in der Menüleiste Einstellungen ‣Optionen unter dem Menü Kartenwerkzeuge einstellen.
Tipp
Den Kartenausschnitt mit den Pfeiltasten und der Leertaste verschieben
Sie können die Pfeiltasten verwenden, um den Layer zu verschieben. Platzieren Sie dazu den Mauszeiger im Kartenfenster und drücken Sie auf die rechte Pfeiltaste um nach Osten zu verschieben, die linke Pfeiltasten für Westen, die Hoch-Pfeiltasten für Norden und die Unten-Pfeiltasten für Süden. Sie können einen Layer auch mit der Space-Taste verschieben. Bewegen Sie dazu einfach die Maus während Sie die Space-Taste gedrückt halten.
Statusleiste
The status bar shows you your current position in map coordinates (e.g., meters or decimal degrees) as the mouse pointer is moved across the map view. To the left of the coordinate display in the status bar is a small button that will toggle between showing coordinate position or the view extents of the map view as you pan and zoom in and out.
Next to the coordinate display you will find the scale display. It shows the scale of the map view. If you zoom in or out, QGIS shows you the current scale. There is a scale selector, which allows you to choose between predefined scales from 1:500 to 1:1000000.
To the right of the scale display you can define a current clockwise rotation for your map view in degrees.
A progress bar in the status bar shows the progress of rendering as each layer is drawn to the map view. In some cases, such as the gathering of statistics in raster layers, the progress bar will be used to show the status of lengthy operations.
If a new plugin or a plugin update is available, you will see a message at the
far left of the status bar. On the right side of the status bar, there is a small
checkbox which can be used to temporarily prevent layers being rendered to the
map view (see section Layeranzeige kontrollieren below). The icon  immediately stops the current map rendering process.
To the right of the render functions, you find the EPSG code of the current project CRS and a projector icon. Clicking on this opens the projection properties for the current project.
Tipp
Die richtige Maßstabseinheit im Kartenfenster einstellen
When you start QGIS, the default units are degrees, and this means that QGIS will interpret any
coordinate in your layer as specified in degrees. To get correct scale values, you can
either change this setting to meters manually in the General tab
under Settings ‣ Project Properties, or you can select a
project CRS clicking on the  Current CRS: icon in the
lower right-hand corner of the status bar. In the last case, the units are set to what the
project projection specifies (e.g., ‘+units=m’).
Current CRS: icon in the
lower right-hand corner of the status bar. In the last case, the units are set to what the
project projection specifies (e.g., ‘+units=m’).