.
Dialogul Proprietăților Rasterului
Pentru a vizualiza și seta proprietățile pentru un strat raster, faceți dublu clic pe numele stratului din harta legendei, sau faceți clic dreapta pe numele stratului și alegeți Properties din meniul contextual. Acest lucru va deschide dialogul Raster Layer Properties (v. figure_raster_1).
Există câteva meniuri în dialog:
- General
Stil
Transparență
Piramide
Histogramă
Metadate
Figure Raster 1:
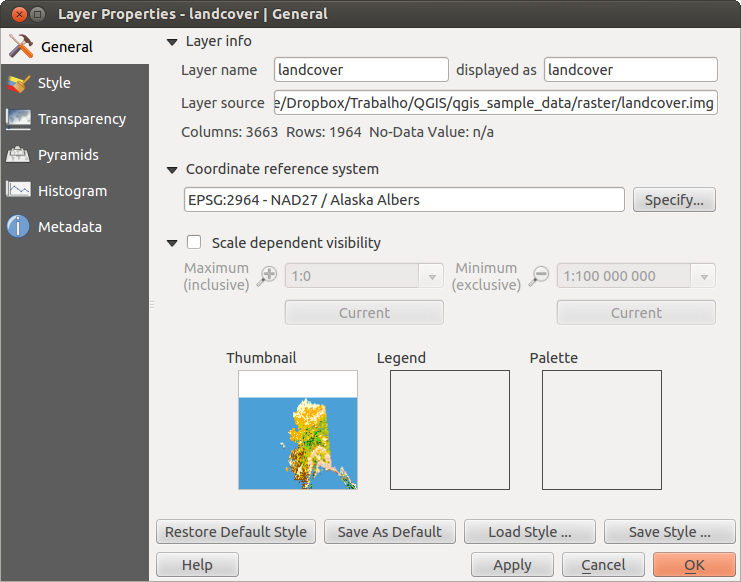
Raster Layers Properties Dialog 
Meniul Stilului
Randare bandă
QGIS offers four different Render types. The renderer chosen is dependent on the data type.
Culoare multibandă - Dacă fișierul vine ca o multibandă compusă din diferite benzi (de exemplu, utilizând o imagine prin satelit cu mai multe benzi)
Paletă de culori - în cazul în care un singur fișier bandă vine cu o paletă indexată (de exemplu, utilizată cu o hartă topografică digitală)
- Singleband gray - (one band of) the image will be rendered as gray; QGIS will choose this renderer if the file has neither multibands nor an indexed palette nor a continous palette (e.g., used with a shaded relief map)
Pseudoculoare simpla bandă - acest render este posibil pentru fișierele cu o paleta continuă, sau o harta de culoare (ex: folosită cu o hartă de elevații)
Culoare multibandă
Cu renderul de culoare multibandă, trei benzi selectate din imagine vor fi randate, fiecare bandă reprezentând componenta de culoare roșie, verde sau albastră, care vor fi folosite pentru a crea o imagine color. Puteți alege mai multe metode de Îmbunătățire a Contrastului: ‘Fără Îmbunătățire’, ‘Întindere la MinMax’, ‘Întindere și decupare la MinMax’ și ‘Decupare la min max’.
Figure Raster 2:
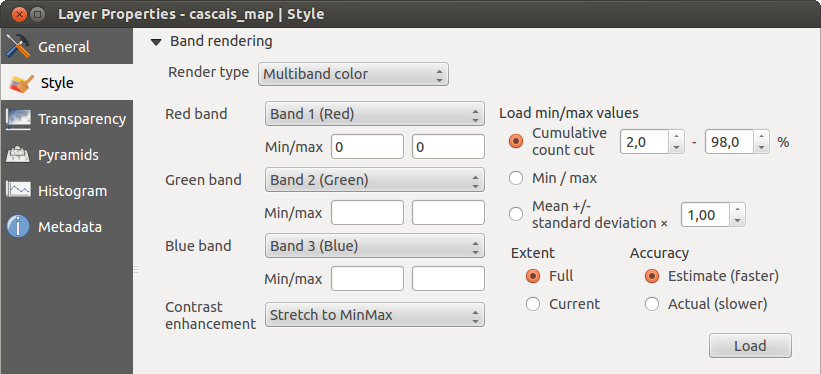
Raster Renderer - Multiband color
This selection offers you a wide range of options to modify the appearance
of your raster layer. First of all, you have to get the data range from your
image. This can be done by choosing the Extent and pressing
[Load]. QGIS can  Estimate (faster) the
Min and Max values of the bands or use the
Estimate (faster) the
Min and Max values of the bands or use the
 Actual (slower) Accuracy.
Now you can scale the colors with the help of the Load min/max values section.
A lot of images have a few very low and high data. These outliers can be eliminated
using the Cumulative count cut setting. The standard data range is set
from 2% to 98% of the data values and can be adapted manually. With this
setting, the gray character of the image can disappear.
With the scaling option Min/max, QGIS creates a color table with all of
the data included in the original image (e.g., QGIS creates a color table
with 256 values, given the fact that you have 8 bit bands).
You can also calculate your color table using the Mean +/- standard deviation x  .
Then, only the values within the standard deviation or within multiple standard deviations
are considered for the color table. This is useful when you have one or two cells
with abnormally high values in a raster grid that are having a negative impact on
the rendering of the raster.
.
Then, only the values within the standard deviation or within multiple standard deviations
are considered for the color table. This is useful when you have one or two cells
with abnormally high values in a raster grid that are having a negative impact on
the rendering of the raster.
All calculations can also be made for the Current extent.
Tip
Vizualizarea unei singure benzi dintr-un Raster Multibandă
Dacă doriți să vizualizați o singură bandă a unei imagini multibandă (de exemplu, Roșie), ați putea crede că ați setat benzile Verde și Albastră pe “nespecificat”. Dar acest lucru nu este modul corect. Pentru a afișa banda Roșie, setați tipul de imagine la ‘Singleband gri’, apoi selectați Roșu ca bandă de utilizat pentru Gri.
Paletă
This is the standard render option for singleband files that already include a color table, where each pixel value is assigned to a certain color. In that case, the palette is rendered automatically. If you want to change colors assigned to certain values, just double-click on the color and the Select color dialog appears. Also, in QGIS 2.2. it’s now possible to assign a label to the color values. The label appears in the legend of the raster layer then.
Figure Raster 3:
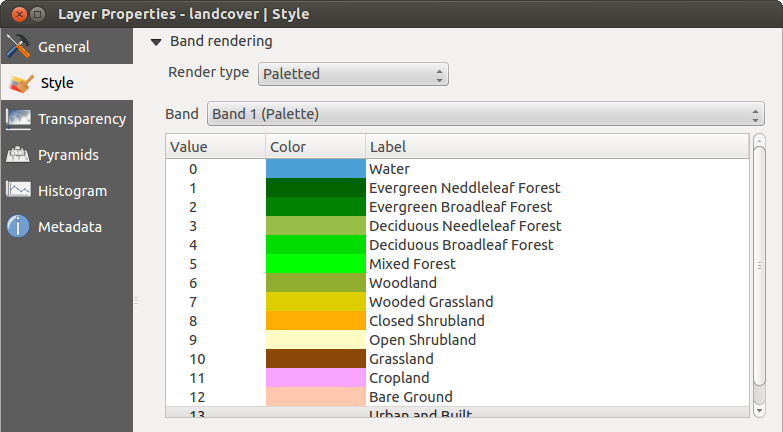
Raster Renderer - Paletted
Îmbunătăţirea contrastului
Note
When adding GRASS rasters, the option Contrast enhancement will always be set automatically to stretch to min max, regardless of if this is set to another value in the QGIS general options.
O singură bandă gri
This renderer allows you to render a single band layer with a Color gradient:
‘Black to white’ or ‘White to black’. You can define a Min
and a Max value by choosing the Extent first and
then pressing [Load]. QGIS can Estimate (faster) the
Min and Max values of the bands or use the
Actual (slower) Accuracy.
Figure Raster 4:
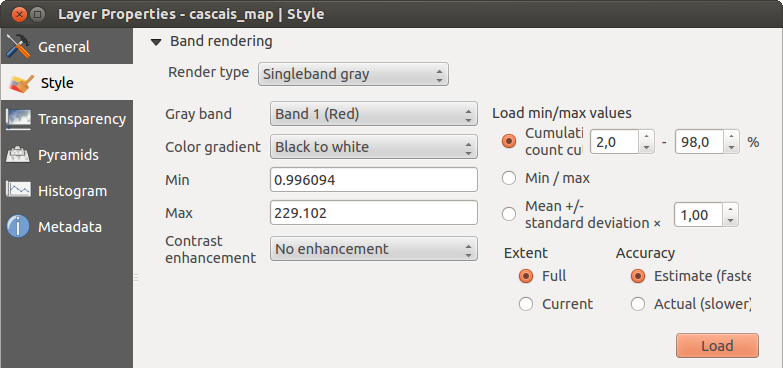
Raster Renderer - Singleband gray
With the Load min/max values section, scaling of the color table
is possible. Outliers can be eliminated using the Cumulative count cut setting.
The standard data range is set from 2% to 98% of the data values and can
be adapted manually. With this setting, the gray character of the image can disappear.
Further settings can be made with Min/max and
Mean +/- standard deviation x .
While the first one creates a color table with all of the data included in the
original image, the second creates a color table that only considers values
within the standard deviation or within multiple standard deviations.
This is useful when you have one or two cells with abnormally high values in
a raster grid that are having a negative impact on the rendering of the raster.
Pseudoculoare cu bandă unică
This is a render option for single-band files, including a continous palette. You can also create individual color maps for the single bands here.
Figure Raster 5:
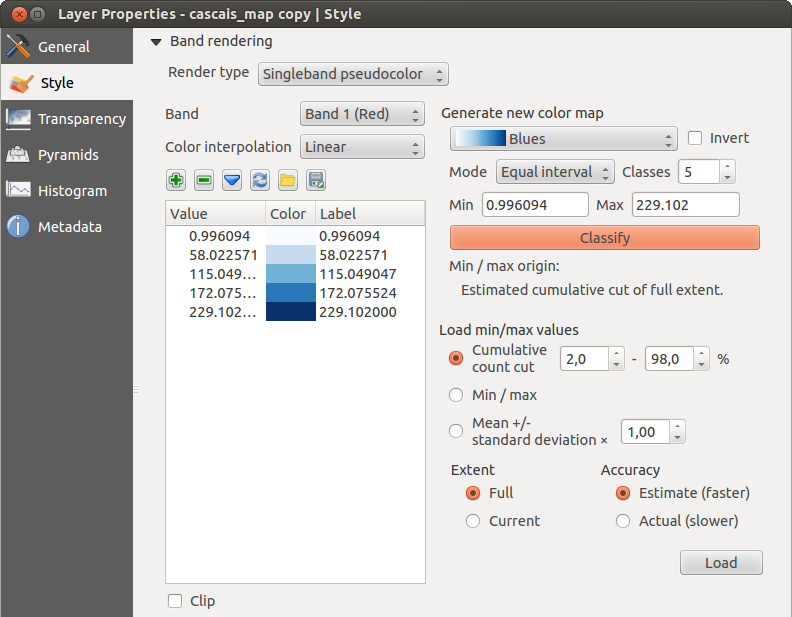
Raster Renderer - Singleband pseudocolor
Sunt disponibile trei tipuri de interpolare de culoare:
Discret
Liniar
- Exact
In the left block, the button  Add values manually adds a value to the
individual color table. The button
Add values manually adds a value to the
individual color table. The button  Remove selected row
deletes a value from the individual color table, and the
Remove selected row
deletes a value from the individual color table, and the
 Sort colormap items button sorts the color table according
to the pixel values in the value column. Double clicking on the value column lets
you insert a specific value. Double clicking on the color column opens the dialog
Change color, where you can select a color to apply on that value. Further,
you can also add labels for each color, but this value won’t be displayed when you use the identify
feature tool.
You can also click on the button
Sort colormap items button sorts the color table according
to the pixel values in the value column. Double clicking on the value column lets
you insert a specific value. Double clicking on the color column opens the dialog
Change color, where you can select a color to apply on that value. Further,
you can also add labels for each color, but this value won’t be displayed when you use the identify
feature tool.
You can also click on the button  Load color map from band,
which tries to load the table from the band (if it has any). And you can use the
buttons
Load color map from band,
which tries to load the table from the band (if it has any). And you can use the
buttons  Load color map from file or
  Export color map to file to load an existing color table or to save the
defined color table for other sessions.
Export color map to file to load an existing color table or to save the
defined color table for other sessions.
In the right block, Generate new color map allows you to create newly
categorized color maps. For the Classification mode  ‘Equal interval’,
you only need to select the number of classes
and press the button Classify. You can invert the colors
of the color map by clicking the
‘Equal interval’,
you only need to select the number of classes
and press the button Classify. You can invert the colors
of the color map by clicking the  Invert
checkbox. In the case of the Mode ‘Continous’, QGIS creates
classes automatically depending on the Min and Max.
Defining Min/Max values can be done with the help of the Load min/max values section.
A lot of images have a few very low and high data. These outliers can be eliminated
using the Cumulative count cut setting. The standard data range is set
from 2% to 98% of the data values and can be adapted manually. With this
setting, the gray character of the image can disappear.
With the scaling option Min/max, QGIS creates a color table with all of
the data included in the original image (e.g., QGIS creates a color table
with 256 values, given the fact that you have 8 bit bands).
You can also calculate your color table using the Mean +/- standard deviation x .
Then, only the values within the standard deviation or within multiple standard deviations
are considered for the color table.
Invert
checkbox. In the case of the Mode ‘Continous’, QGIS creates
classes automatically depending on the Min and Max.
Defining Min/Max values can be done with the help of the Load min/max values section.
A lot of images have a few very low and high data. These outliers can be eliminated
using the Cumulative count cut setting. The standard data range is set
from 2% to 98% of the data values and can be adapted manually. With this
setting, the gray character of the image can disappear.
With the scaling option Min/max, QGIS creates a color table with all of
the data included in the original image (e.g., QGIS creates a color table
with 256 values, given the fact that you have 8 bit bands).
You can also calculate your color table using the Mean +/- standard deviation x .
Then, only the values within the standard deviation or within multiple standard deviations
are considered for the color table.
Randarea culorii
Pentru fiecare Randare de bandă, este posibilă o Randare de culoare.
Puteți obține, de asemenea, efecte speciale de rendare pentru fișier(ele) raster, folosind unul din modurile de amestecare (v. Dialogul Proprietăților Vectoriale).
Further settings can be made in modifiying the Brightness, the Saturation and the Contrast. You can also use a Grayscale option, where you can choose between ‘By lightness’, ‘By luminosity’ and ‘By average’. For one hue in the color table, you can modify the ‘Strength’.
Reeşantionare
Opțiunea Reeșantionare își face apariția atunci când măriți și micșorați o imagine. Modurile de reeșantionare pot optimiza aspectul hărții. Eie calculează o nouă matrice cu valori de gri, printr-o transformare geometrică.
Figure Raster 6:
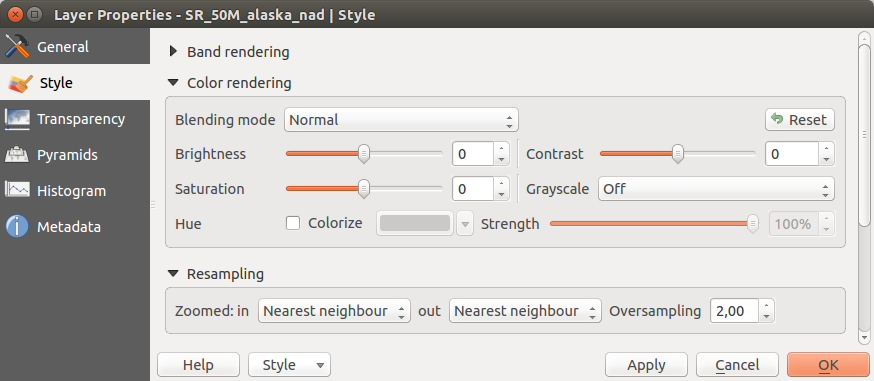
Raster Rendering - Resampling
Atunci când se aplică metoda ‘Celui mai apropiat vecin ‘, harta poate avea o structură pixelată, la efectuarea unei transfocări. Aceasta aspect poate fi îmbunătățit prin utilizarea metodei ‘Biliniară’ sau ‘Cubică’, care poate determina ca entitățile ascuțite să fie neclare. Efectul constă într-o imagine mai fină. Această metodă poate fi aplicată, de exemplu, pentru hărți raster, topografice, digitale.
Meniul de Transparenţă
QGIS has the ability to display each raster layer at a different transparency level.
Use the transparency slider  to indicate to what extent the underlying layers
(if any) should be visible though the current raster layer. This is very useful
if you like to overlay more than one raster layer (e.g., a shaded relief map
overlayed by a classified raster map). This will make the look of the map more
three dimensional.
to indicate to what extent the underlying layers
(if any) should be visible though the current raster layer. This is very useful
if you like to overlay more than one raster layer (e.g., a shaded relief map
overlayed by a classified raster map). This will make the look of the map more
three dimensional.
În plus, puteți introduce o valoare raster care ar trebui să fie tratată ca FĂRĂDATE în meniul Additional no data value.
Un mod chiar mai flexibil de a personaliza transparența este disponibil în secțiunea Custom transparency options. Transparența fiecărui pixel poate fi setată aici.
As an example, we want to set the water of our example raster file landcover.tif
to a transparency of 20%. The following steps are neccessary:
Încărcați fișierul raster
landcover.tif.Deschideți dialogul Proprietăților printr-un dublu-clic pe numele rasterului din legendă, sau printr-un clic-dreapta urmat de selectarea Proprietăților din meniul care se deschide.
Selectați meniul Transparență.
Pentru Banda de transparență alegeți ‘None’.
- Click the Add values manually
button. A new row will appear in the pixel list.
Introduceți valoarea raster în coloanele ‘From’ și ‘To’ (vom folosi 0 aici), și vom ajusta transparența la 20.
Clic pe butonul [Apply], apoi aruncați o privire hărții.
Puteți repeta pașii 5 și 6 pentru a stabili mai multe valori cu transparență personalizate.
As you can see, it is quite easy to set custom transparency, but it can be
quite a lot of work. Therefore, you can use the button  Export to file to save your transparency list to a file. The button
Import from file loads your transparency settings and
applies them to the current raster layer.
Export to file to save your transparency list to a file. The button
Import from file loads your transparency settings and
applies them to the current raster layer.
Meniul Piramidelor
Large resolution raster layers can slow navigation in QGIS. By creating lower resolution copies of the data (pyramids), performance can be considerably improved, as QGIS selects the most suitable resolution to use depending on the level of zoom.
Trebuie să aveți acces de scriere în directorul în care sunt stocate datele originale, pentru a construi piramide.
Mai multe metode de reproiectare pot dfi folosite pentru a calcula piramidele:
cel mai apropiat vecin
Medie
- Gauss
- Cubic
Mod
Niciuna
If you choose ‘Internal (if possible)’ from the Overview format menu, QGIS tries to build pyramids internally. You can also choose ‘External’ and ‘External (Erdas Imagine)’.
Figure Raster 7:
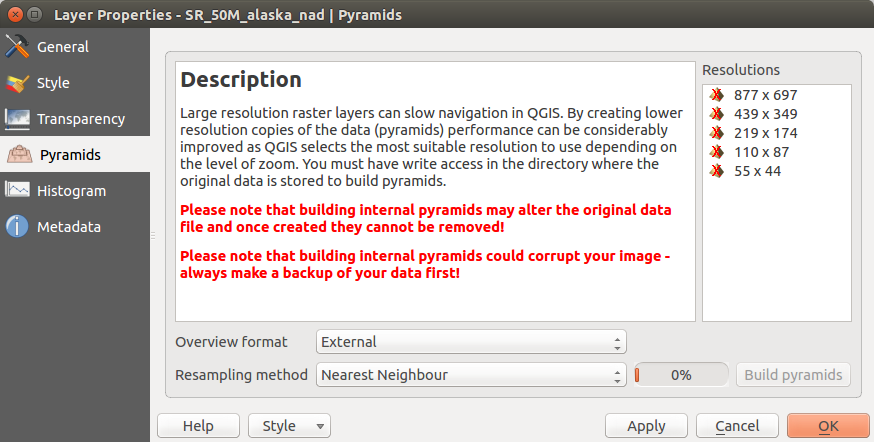
The Pyramids Menu
Rețineți că realizarea piramidelor interne poate modifica fișierul de date original, iar o dată create ele nu mai pot fi eliminate! Dacă doriți să păstrați o versiune ‘fără-piramide’ a rasterului dvs., faceți o copie de rezervă înainte de construirea piramidelor.
Meniul Histogramei
The Histogram menu allows you to view the distribution of the bands
or colors in your raster. The histogram is generated automatically when you open the
Histogram menu. All existing bands will be displayed together. You can
save the histogram as an image with the button.
With the Visibility option in the  Prefs/Actions menu,
you can display histograms of the individual bands. You will need to select the option
Show selected band.
The Min/max options allow you to ‘Always show min/max markers’, to ‘Zoom
to min/max’ and to ‘Update style to min/max’.
With the Actions option, you can ‘Reset’ and ‘Recompute histogram’ after
you have chosen the Min/max options.
Prefs/Actions menu,
you can display histograms of the individual bands. You will need to select the option
Show selected band.
The Min/max options allow you to ‘Always show min/max markers’, to ‘Zoom
to min/max’ and to ‘Update style to min/max’.
With the Actions option, you can ‘Reset’ and ‘Recompute histogram’ after
you have chosen the Min/max options.
Figure Raster 8:
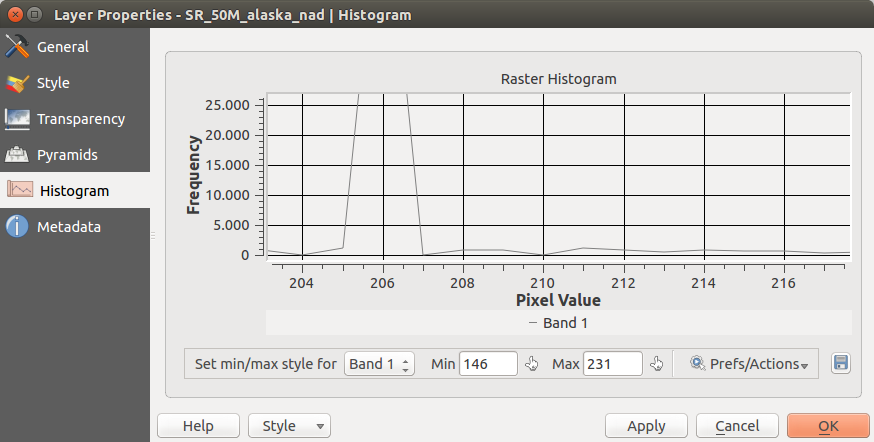
Raster Histogram
Meniu Metadate
Meniul Metadate afişează o multitudine de informaţii despre stratul raster, inclusiv statistici despre fiecare bandă din stratul raster curent. Prin intermediul acestui meniu, se pot accesa Descriere, Atribuire, guilabel: ‘MetadataUrl’ şi Proprietăți. În Proprietăți, statisticile sunt colectate pe tipicul ‘bine de știut’, astfel încât este posibil ca pentru un anumit strat statisticile să nu fie colectate încă.
Figure Raster 9:
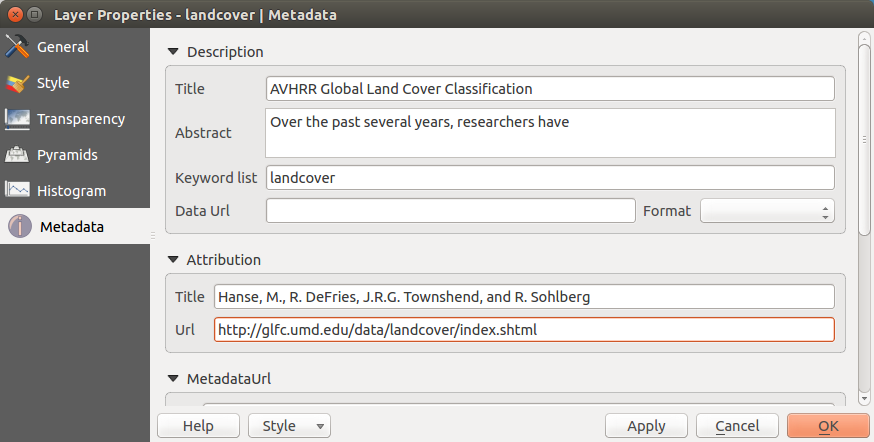
Raster Metadata