.
A caixa de ferramentas
A Caixa de ferramenta é o elemento principal da GUI de processamento, e o que você mais usará provável em seu trabalho diário. Ele mostra a lista de todos os algoritmos disponíveis agrupados em diferentes blocos, e é o ponto de acesso para executá-los, seja como um processamento único ou em lote que envolve várias execuções do mesmo algoritmo em diferentes conjuntos de entradas.
Figure Processing 5:
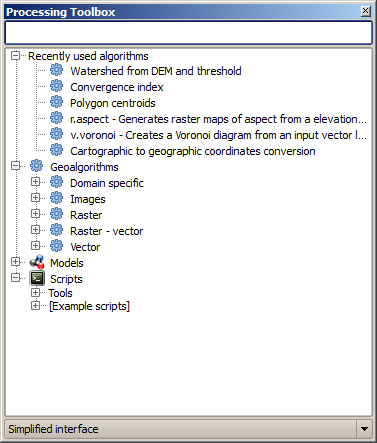
Processing Toolbox 
The toolbox contains all the available algorithms, divided into predefined groups. All these groups are found under a single tree entry named Geoalgorithms.
Additionally, two more entries are found, namely Models and Scripts. These include user-created algorithms, and they allow you to define your own workflows and processing tasks. We will devote a full section to them a bit later.
Na parte superior da caixa de ferramentas, você vai encontrar uma caixa de texto. Para reduzir o número de algoritmos mostrados na caixa de ferramentas e tornar mais fácil de encontrar o que você precisa, você pode digitar qualquer palavra ou frase na caixa de texto. Observe que, enquanto você digita, o número de algoritmos na caixa de ferramentas é reduzido para apenas aqueles que contêm o texto que introduziu o nome.
In the lower part, you will find a box that allows you to switch between the simplified algorithm list (the one explained above) and the advanced list. If you change to the advanced mode, the toolbox will look like this:
Figure Processing 6:
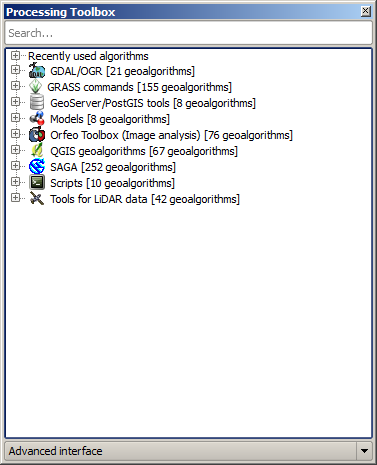
Processing Toolbox (advanced mode)
In the advanced view, each group represents a so-called ‘algorithm provider’, which is a set of algorithms coming from the same source, for instance, from a third-party application with geoprocessing capabilities. Some of these groups represent algorithms from third-party applications like SAGA, GRASS or R, while others contain algorithms directly coded as part of the processing plugin, not relying on any additional software.
This view is recommended to those users who have a certain knowledge of the applications that are backing the algorithms, since they will be shown with their original names and groups.
Also, some additional algorithms are available only in the advanced view, such as LiDAR tools and scripts based on the R statistical computing software, among others. Independent QGIS plugins that add new algorithms to the toolbox will only be shown in the advanced view.
In particular, the simplified view contains algorithms from the following providers:
- GRASS
- SAGA
- OTB
- Native QGIS algorithms
In the case of running QGIS under Windows, these algorithms are fully-functional in a fresh installation of QGIS, and they can be run without requiring any additional installation. Also, running them requires no prior knowledge of the external applications they use, making them more accesible for first-time users.
If you want to use an algorithm not provided by any of the above providers, switch to the advanced mode by selecting the corresponding option at the bottom of the toolbox.
Para executar um algoritmo, de duplo clique no seu nome na caixa de ferramentas.
O diálogo do algoritmo
Once you double-click on the name of the algorithm that you want to execute, a dialog similar to that in the figure below is shown (in this case, the dialog corresponds to the SAGA ‘Convergence index’ algorithm).
Figure Processing 7:
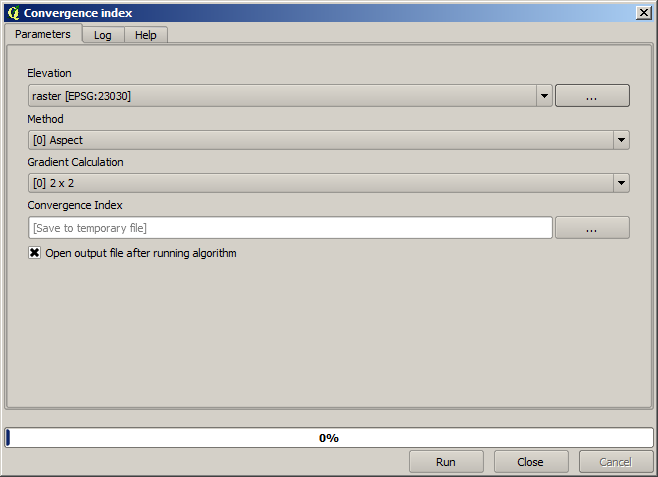
Parameters Dialog
This dialog is used to set the input values that the algorithm needs to be executed. It shows a table where input values and configuration parameters are to be set. It of course has a different content, depending on the requirements of the algorithm to be executed, and is created automatically based on those requirements. On the left side, the name of the parameter is shown. On the right side, the value of the parameter can be set.
Embora o número e tipo de parâmetros dependerem das características do algoritmo, a estrutura é semelhante para todos eles. Os parâmetros encontrados na tabela podem ser de um dos seguintes tipos.
A raster layer, to select from a list of all such layers available (currently opened) in QGIS. The selector contains as well a button on its right-hand side, to let you select filenames that represent layers currently not loaded in QGIS.
A vector layer, to select from a list of all vector layers available in QGIS. Layers not loaded in QGIS can be selected as well, as in the case of raster layers, but only if the algorithm does not require a table field selected from the attributes table of the layer. In that case, only opened layers can be selected, since they need to be open so as to retrieve the list of field names available.
Irá ver um botão por cada selecionador de camada vetorial, como é exibido na figura em baixo.
Figure Processing 8:
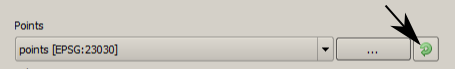
Vector iterator button
Se o algoritmo contém vários deles, você será capaz de alternar apenas um deles. Se o botão que corresponde a um vetor de entrada é alternado, o algoritmo será executado de forma iterativa em cada uma de suas características, em vez de apenas uma vez para toda a camada, produzindo o maior número de saídas em vezes do algoritmo ser executado. Isto permite a automatização do processo quando todas as características de uma camada ter que ser tratada separadamente.
- A table, to select from a list of all available in QGIS. Non-spatial tables are loaded into QGIS like vector layers, and in fact they are treated as such by the program. Currently, the list of available tables that you will see when executing an algorithm that needs one of them is restricted to tables coming from files in dBase (.dbf) or Comma-Separated Values (.csv) formats.
Uma opção, para escolher de uma lista de seleção de uma lista de opções possíveis.
- A numerical value, to be introduced in a text box. You will find a button by its side. Clicking on it, you will see a dialog that allows you to enter a mathematical expression, so you can use it as a handy calculator. Some useful variables related to data loaded into QGIS can be added to your expression, so you can select a value derived from any of these variables, such as the cell size of a layer or the northernmost coordinate of another one.
Figure Processing 9:
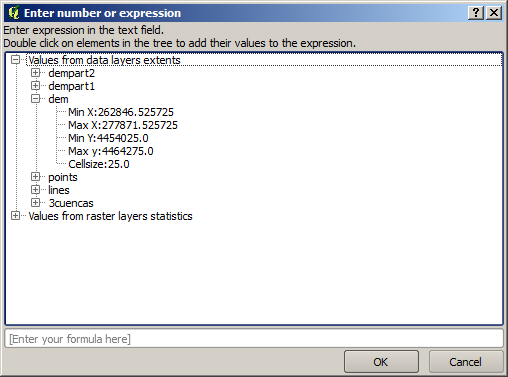
Number Selector
Um intervalo, com valores min e máx para serem introduzidos em duas caixas de texto.
Uma cadeia de texto, para ser introduzida na caixa de texto.
Um campo, para escolher a partir de uma tabela de atributos de uma camada vetorial ou uma tabela única de outro parâmetro.
Um sistema de coordenadas de referência. Você pode digitar o código EPSG diretamente na caixa de texto, ou selecione-o na janela de seleção de SRC que aparece quando você clica com o botão do lado direito.
Uma medida, a ser celebrada por quatro números que representam os seus limites xmin, xmax, ymin, ymax. Clicando no botão no lado direito do seletor de valor, um menu pop-up será exibido, dando-lhe duas opções: para selecionar o valor de uma camada ou a extensão da tela atual, ou defini-la arrastando diretamente na mapa de lona.
Figure Processing 10
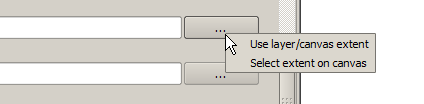
Extent selector
Se selecione a primeira opção, irá ver uma janela igual a próxima.
Figure Processing 11

Extent List
Se selecionar o segundo, os parâmetros da janela irão esconder-se, para que possa clicar e arrastar para o enquadramento. Uma vez definido o retângulo selecionado, o diálogo irá reaparecer, contendo os valores na caixa de texto da extensão.
Figure Processing 12:
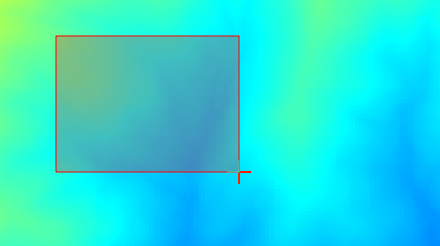
Extent Drag
A list of elements (whether raster layers, vector layers or tables), to select from the list of such layers available in QGIS. To make the selection, click on the small button on the left side of the corresponding row to see a dialog like the following one.
Figure Processing 13:
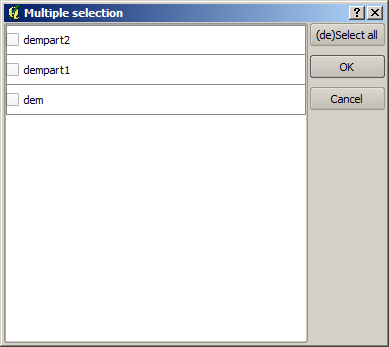
Multiple Selection
Uma pequena tabela para ser editada pelo utilizador. Estes são usados para definir os parâmetros como tabelas lookup ou kernels de convolução, entre outros.
Clique no botão do lado direito para ver a tabela e editar os seus valores.
Figure Processing 14:

Fixed Table
Dependendo do algoritmo, o número de linhas pode ser modificado ou não, utilizando os botões do lado direito da janela.
You will find a [Help] tab in the the parameters dialog. If a help file is available, it will be shown, giving you more information about the algorithm and detailed descriptions of what each parameter does. Unfortunately, most algorithms lack good documentation, but if you feel like contributing to the project, this would be a good place to start.
Uma nota nas projeções
Algorithms run from the processing framework — this is also true of most of the external applications whose algorithms are exposed through it. Do not perform any reprojection on input layers and assume that all of them are already in a common coordinate system and ready to be analized. Whenever you use more than one layer as input to an algorithm, whether vector or raster, it is up to you to make sure that they are all in the same coordinate system.
Note that, due to QGIS‘s on-the-fly reprojecting capabilities, although two layers might seem to overlap and match, that might not be true if their original coordinates are used without reprojecting them onto a common coordinate system. That reprojection should be done manually, and then the resulting files should be used as input to the algorithm. Also, note that the reprojection process can be performed with the algorithms that are available in the processing framework itself.
By default, the parameters dialog will show a description of the CRS of each layer along with its name, making it easy to select layers that share the same CRS to be used as input layers. If you do not want to see this additional information, you can disable this functionality in the processing configuration dialog, unchecking the Show CRS option.
Se você tentar executar um algoritmo utilizando como entrada duas ou mais camadas com sem correspondência de SRC, um diálogo de aviso será exibido.
Pode continuar a executar o algoritmo, mas tenha atenção que na maioria dos casos irá produzir resultados errados, tais como, camadas vazias devido à falta de sobreposição das camadas usadas como arquivos de entrada.
Objetos de dados gerados por algoritmos
Objetos de dados gerado por um algoritmo podem ser dos seguintes tipos:
Uma camada raster
Uma camada vetorial
Uma tabela
Um arquivo HTML (usado para arquivo de saída de texto e gráficos)
These are all saved to disk, and the parameters table will contain a text box corresponding to each one of these outputs, where you can type the output channel to use for saving it. An output channel contains the information needed to save the resulting object somewhere. In the most usual case, you will save it to a file, but the architecture allows for any other way of storing it. For instance, a vector layer can be stored in a database or even uploaded to a remote server using a WFS-T service. Although solutions like these are not yet implemented, the processing framework is prepared to handle them, and we expect to add new kinds of output channels in a near feature.
To select an output channel, just click on the button on the right side of the text box. That will open a save file dialog, where you can select the desired file path. Supported file extensions are shown in the file format selector of the dialog, depending on the kind of output and the algorithm.
The format of the output is defined by the filename extension. The supported formats depend on what is supported by the algorithm itself. To select a format, just select the corresponding file extension (or add it, if you are directly typing the file path instead). If the extension of the file path you entered does not match any of the supported formats, a default extension (usually .dbf` for tables, .tif for raster layers and .shp for vector layers) will be appended to the file path, and the file format corresponding to that extension will be used to save the layer or table.
If you do not enter any filename, the result will be saved as a temporary file in the corresponding default file format, and it will be deleted once you exit QGIS (take care with that, in case you save your project and it contains temporary layers).
You can set a default folder for output data objects. Go to the configuration dialog (you can open it from the Processing menu), and in the General group, you will find a parameter named Output folder. This output folder is used as the default path in case you type just a filename with no path (i.e., myfile.shp) when executing an algorithm.
Ao executar um algoritmo que usa uma camada de vetor no modo interativo, o caminho do arquivo digitado é utilizado como o caminho de base para todos os arquivos gerados, que são nomeados com o nome de base e acrescentando-se um número que representa o índice da iteração. A extensão do arquivo (e formato) é usado para todos esses arquivos gerados.
Apart from raster layers and tables, algorithms also generate graphics and text as HTML files. These results are shown at the end of the algorithm execution in a new dialog. This dialog will keep the results produced by any algorithm during the current session, and can be shown at any time by selecting Processing ‣ Results viewer from the QGIS main menu.
Some external applications might have files (with no particular extension restrictions) as output, but they do not belong to any of the categories above. Those output files will not be processed by QGIS (opened or included into the current QGIS project), since most of the time they correspond to file formats or elements not supported by QGIS. This is, for instance, the case with LAS files used for LiDAR data. The files get created, but you won’t see anything new in your QGIS working session.
Para todos os outros tipos de saída, você encontrará uma caixa de verificação que você pode usar para dizer o algoritmo para saber se carregará o arquivo, uma vez que é gerado pelo algoritmo ou não. Por padrão, todos os arquivos são abertos.
Optional outputs are not supported. That is, all outputs are created. However, you can uncheck the corresponding checkbox if you are not interested in a given output, which essentially makes it behave like an optional output (in other words, the layer is created anyway, but if you leave the text box empty, it will be saved to a temporary file and deleted once you exit QGIS).
Configurando a infraestrutura do processamento
Como foi mencionado, o menu de configuração dá acesso a um novo diálogo onde pode configurar a forma como o algoritmo trabalha. Os parâmetros de configuração são estruturados em blocos separados que podem ser seleccionados no lado esquerdo do diálogo.
Along with the aforementioned Output folder entry, the General block contains parameters for setting the default rendering style for output layers (that is, layers generated by using algorithms from any of the framework GUI components). Just create the style you want using QGIS, save it to a file, and then enter the path to that file in the settings so the algorithms can use it. Whenever a layer is loaded by SEXTANTE and added to the QGIS canvas, it will be rendered with that style.
Os estilos de renderização podem ser configurados individualmente para cada algoritmo e cada um para os seus arquivos de saída. Apenas clique com o direito do mouse no nome do algoritmo na caixa de ferramentas e selecione Editar estilos de renderização. Irá ver um diálogo como o que é exibido a seguir.
Figure Processing 15:
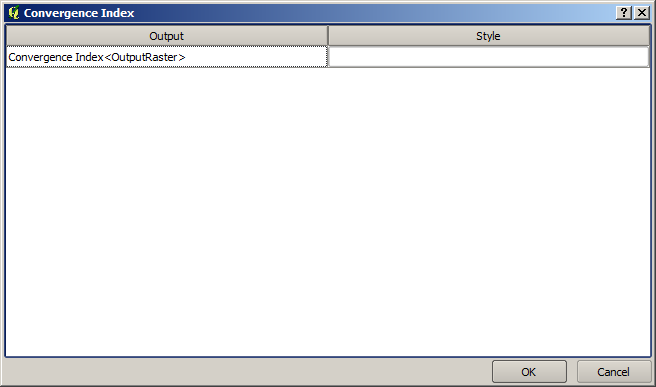
Rendering Styles
Selecione o arquivo de estilo (.qml) que quer para cada arquivo de saída e pressione [OK].
Os outros parâmetros de configuração no grupo Geral estão em baixo referidos:
Use nome da camada como nome do arquivo. O nome de cada camada resultante criada por um algoritmo é definido pelo próprio algoritmo. Em alguns casos, um nome fixo pode ser utilizado, o que significa que o mesmo nome de saída vai ser usado, não importa qual a camada de entrada é usada. Em outros casos, o nome pode depender do nome da camada de entrada ou de alguns dos parâmetros usados para executar o algoritmo. Se esta opção for assinalada, o nome será retirado o nome do arquivo de saída em seu lugar. Observe que, se a saída é salvo em um arquivo temporário, o nome deste arquivo temporário é geralmente uma longo e sem sentido que se destina a evitar a conflito com outros nomes de arquivos já existentes.
Use somente recursos selecionados. Se essa opção for selecionada, sempre que uma camada de vetor é usada como entrada para um algoritmo, apenas suas feições selecionadas serão usadas. Se a camada não tiver feições selecionadas, todas as feições serão utilizadas.
arquivo de pré-execução do script e arquivo de script pós-execução. Estes parâmetros se referem aos scripts escritos usando a funcionalidade de script de processamento e são explicados na seção cobertura scripting e do terminal.
Além de o bloco Geral na caixa de diálogo de configurações, você também vai encontrar um bloco para provedores de algoritmo. Cada entrada neste bloco contém um ítem Ativar que você pode usar para fazer algoritmos aparecer ou não na caixa de ferramentas. Além disso, alguns provedores de algoritmo têm seus próprios itens de configuração, que explicaremos mais tarde, quando cobrindo determinados provedores de algoritmo.