.
QGIS GUI
When QGIS starts, you are presented with the GUI as shown in the figure (the numbers 1 through 5 in yellow circles are discussed below).
Figure QGIS GUI 1:
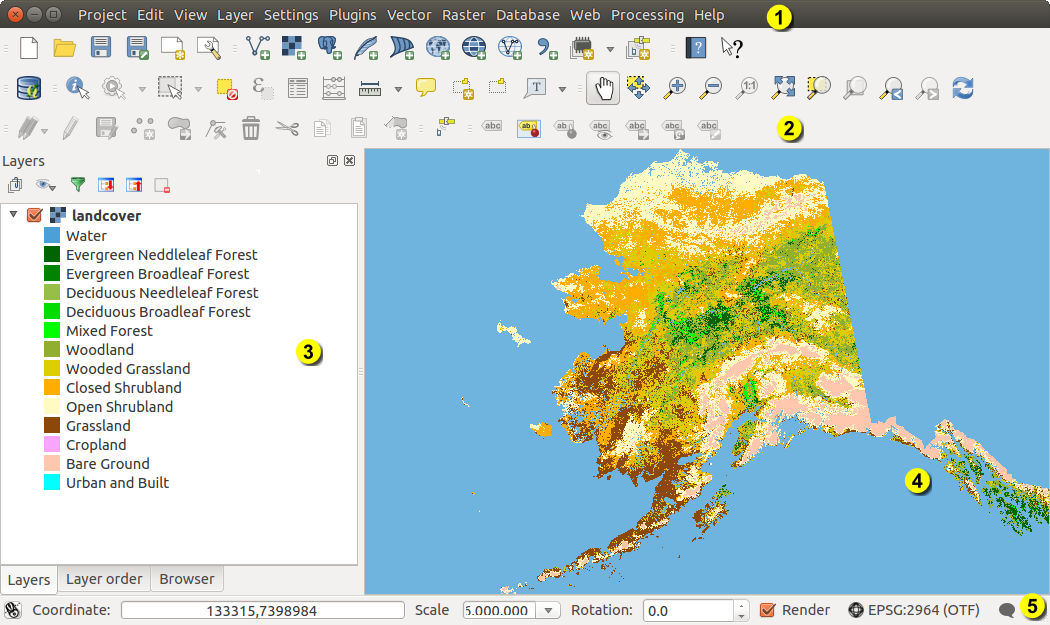
QGIS GUI with Alaska sample data 
Informacja
Wygląd twojego okna (paska tytułu itd.) może być nieco inny w zależności od tego, jakiego systemu operacyjnego i menadżera okien używasz.
The QGIS GUI is divided into five areas:
Pasek menu
- Tool Bar
- Map Legend
Widok mapy
Pasek statusu
These five components of the QGIS interface are described in more detail in the following sections. Two more sections present keyboard shortcuts and context help.
Pasek menu
The menu bar provides access to various QGIS features using a standard hierarchical menu. The top-level menus and a summary of some of the menu options are listed below, together with the associated icons as they appear on the toolbar, and keyboard shortcuts. The shortcuts presented in this section are the defaults; however, keyboard shortcuts can also be configured manually using the Configure shortcuts dialog, opened from Settings ‣ Configure Shortcuts....
Mimo, że wiele poleceń menu ma odpowiadające im przyciski na paskach narzędzi i na odwrót, porządek menu jest inny od układu pasków narzędziowych. Jeśli polecenie menu znajduje się również na jakimś pasku narzędzi, to obok polecenia podana jest nazwa tego paska. Niektóre z poleceń menu pojawiają się na paskach jedynie wówczas, gdy załadowana jest odpowiednia wtyczka. Więcej informacji o paskach i przyciskach narzędzi znajdziesz w rozdziale Pasek narzędzi.
Projekt
Polecenie menu |
Skrót |
Odnośnik |
Pasek narzędzi |
|---|---|---|---|
 New New |
Ctrl+N |
see Projekty | Projekt |
 Open Open |
Ctrl+O |
see Projekty | Projekt |
Nowy z szablonu ‣ |
see Projekty | Projekt |
|
| Open Recent ‣ | see Projekty | ||
 Save Save |
Ctrl+S |
see Projekty | Projekt |
 Save As... Save As... |
Ctrl+Shift+S |
see Projekty | Projekt |
 Save as Image... Save as Image... |
see Zapisywanie | ||
| DXF Export ... | see Zapisywanie | ||
 New Print Composer New Print Composer |
Ctrl+P |
zobacz Print Composer |
Projekt |
 Composer manager ... Composer manager ... |
zobacz Print Composer |
Projekt |
|
Wydruki ‣ |
zobacz Print Composer |
||
 Exit QGIS Exit QGIS |
Ctrl+Q |
Edycja
Polecenie menu |
Skrót |
Odnośnik |
Pasek narzędzi |
|---|---|---|---|
 Undo Undo |
Ctrl+Z |
zobacz Advanced digitizing |
Zaawansowana digitalizacja |
 Redo Redo |
Ctrl+Shift+Z |
zobacz Advanced digitizing |
Zaawansowana digitalizacja |
 Cut Features Cut Features |
Ctrl+X |
zobacz Digitizing an existing layer |
Digitalizacja |
 Copy Features Copy Features |
Ctrl+C |
zobacz Digitizing an existing layer |
Digitalizacja |
 Paste Features Paste Features |
Ctrl+V |
zobacz Digitizing an existing layer |
Digitalizacja |
Wklej obiekty jako ‣ |
|||
 Add Feature Add Feature |
Ctrl+. |
zobacz Digitizing an existing layer |
Digitalizacja |
 Move Feature(s) Move Feature(s) |
zobacz Digitizing an existing layer |
Digitalizacja |
|
 Delete Selected Delete Selected |
zobacz Digitizing an existing layer |
Digitalizacja |
|
 Rotate Feature(s) Rotate Feature(s) |
zobacz Advanced digitizing |
Zaawansowana digitalizacja |
|
 Simplify Feature Simplify Feature |
zobacz Advanced digitizing |
Zaawansowana digitalizacja |
|
 Add Ring Add Ring |
zobacz Advanced digitizing |
Zaawansowana digitalizacja |
|
 Add Part Add Part |
zobacz Advanced digitizing |
Zaawansowana digitalizacja |
|
 Fill Ring Fill Ring |
zobacz Advanced digitizing |
Zaawansowana digitalizacja |
|
 Delete Ring Delete Ring |
zobacz Advanced digitizing |
Zaawansowana digitalizacja |
|
 Delete Part Delete Part |
zobacz Advanced digitizing |
Zaawansowana digitalizacja |
|
 Reshape Features Reshape Features |
zobacz Advanced digitizing |
Zaawansowana digitalizacja |
|
 Offset Curve Offset Curve |
zobacz Advanced digitizing |
Zaawansowana digitalizacja |
|
 Split Features Split Features |
zobacz Advanced digitizing |
Zaawansowana digitalizacja |
|
 Split Parts Split Parts |
zobacz Advanced digitizing |
Zaawansowana digitalizacja |
|
 Merge Selected Features Merge Selected Features |
zobacz Advanced digitizing |
Zaawansowana digitalizacja |
|
| Merge Attr. of Selected Features |
zobacz Advanced digitizing |
Zaawansowana digitalizacja |
|
 Node Tool Node Tool |
zobacz Digitizing an existing layer |
Digitalizacja |
|
| Rotate Point Symbols |
zobacz Advanced digitizing |
Zaawansowana digitalizacja |
After activating  Toggle editing mode for a layer,
you will find the
Toggle editing mode for a layer,
you will find the Add Feature icon in the Edit menu
depending on the layer type (point, line or polygon).
Edycja (extra)
Polecenie menu |
Skrót |
Odnośnik |
Pasek narzędzi |
|---|---|---|---|
| Add Feature |
zobacz Digitizing an existing layer |
Digitalizacja |
|
 Add Feature Add Feature |
zobacz Digitizing an existing layer |
Digitalizacja |
|
 Add Feature Add Feature |
zobacz Digitizing an existing layer |
Digitalizacja |
Widok
Polecenie menu |
Skrót |
Odnośnik |
Pasek narzędzi |
|---|---|---|---|
 Pan Map Pan Map |
Nawigacja mapy |
||
 Pan Map to Selection Pan Map to Selection |
Nawigacja mapy |
||
 Zoom In Zoom In |
Ctrl++ |
Nawigacja mapy |
|
 Zoom Out Zoom Out |
Ctrl+- |
Nawigacja mapy |
|
Wybierz ‣ |
Atrybuty |
||
 Identify Features Identify Features |
Ctrl+Shift+I |
Atrybuty |
|
Pomiar ‣ |
zobacz Mierzenie |
Atrybuty |
|
 Zoom Full Zoom Full |
Ctrl+Shift+F |
Nawigacja mapy |
|
 Zoom To Layer Zoom To Layer |
Nawigacja mapy |
||
 Zoom To Selection Zoom To Selection |
Ctrl+J |
Nawigacja mapy |
|
 Zoom Last Zoom Last |
Nawigacja mapy |
||
 Zoom Next Zoom Next |
Nawigacja mapy |
||
 Zoom Actual Size Zoom Actual Size |
Nawigacja mapy |
||
Dekoracje ‣ |
zobacz Dekoracje |
||
| Preview mode ‣ | |||
 Map Tips Map Tips |
Atrybuty |
||
 New Bookmark New Bookmark |
Ctrl+B |
zobacz Zakładki przestrzenne |
Atrybuty |
 Show Bookmarks Show Bookmarks |
Ctrl+Shift+B |
zobacz Zakładki przestrzenne |
Atrybuty |
 Refresh Refresh |
F5 |
Nawigacja mapy |
Warstwa
Polecenie menu |
Skrót |
Odnośnik |
Pasek narzędzi |
|---|---|---|---|
| Create Layer ‣ | Zarządzaj warstwami |
||
| Add Layer ‣ | Zarządzaj warstwami |
||
| Embed Layers and Groups ... | zobacz Zagnieżdżanie projektów |
||
| Add from Layer Definition File ... | |||
| Copy style |
see Style Menu | ||
| Paste style |
see Style Menu | ||
 Open Attribute Table Open Attribute Table |
Atrybuty |
||
| Toggle Editing |
zobacz Digitizing an existing layer |
Digitalizacja |
|
| Save Layer Edits |
zobacz Digitizing an existing layer |
Digitalizacja |
|
 Current Edits ‣ Current Edits ‣ |
zobacz Digitizing an existing layer |
Digitalizacja |
|
| Save as... | |||
| Save as layer definition file... | |||
 Remove Layer/Group Remove Layer/Group |
Ctrl+D |
||
 Duplicate Layers (s) Duplicate Layers (s) |
|||
| Set Scale Visibility of Layers | |||
| Set CRS of Layer(s) | Ctrl+Shift+C |
||
| Set project CRS from Layer | |||
| Properties ... | |||
| Query... | |||
 Labeling Labeling |
|||
 Add to Overview Add to Overview |
Ctrl+Shift+O |
Zarządzaj warstwami |
|
 Add All To Overview Add All To Overview |
|||
 Remove All From Overview Remove All From Overview |
|||
 Show All Layers Show All Layers |
Ctrl+Shift+U |
Zarządzaj warstwami |
|
 Hide All Layers Hide All Layers |
Ctrl+Shift+H |
Zarządzaj warstwami |
|
| Show selected Layers |
|||
| Hide selected Layers |
Ustawienia
Polecenie menu |
Skrót |
Odnośnik |
Pasek narzędzi |
|---|---|---|---|
Panele ‣ |
zob. Panels and Toolbars |
||
Paski narzędzi ‣ |
zob. Panels and Toolbars |
||
| Toggle Full Screen Mode | F 11 |
||
 Project Properties ... Project Properties ... |
Ctrl+Shift+P |
see Projekty | |
 Custom CRS ... Custom CRS ... |
|||
Zarządzanie stylem... |
zob. Presentation |
||
 Configure shortcuts ... Configure shortcuts ... |
|||
| Customization ... |
zob. Personalizacja |
||
| Options ... |
zob. Opcje |
||
| Snapping Options ... |
Wtyczki
Polecenie menu |
Skrót |
Odnośnik |
Pasek narzędzi |
|---|---|---|---|
 Manage and Install Plugins ... Manage and Install Plugins ... |
zob. The Plugins Dialog |
||
| Python Console | Ctrl+Alt+P |
When starting QGIS for the first time not all core plugins are loaded.
Wektor
Polecenie menu |
Skrót |
Odnośnik |
Pasek narzędzi |
|---|---|---|---|
| Open Street Map ‣ | |||
|
zob. fTools Plugin |
||
|
zob. fTools Plugin |
||
|
zob. fTools Plugin |
||
|
zob. fTools Plugin |
||
|
zob. fTools Plugin |


When starting QGIS for the first time not all core plugins are loaded.
Raster
Polecenie menu |
Skrót |
Odnośnik |
Pasek narzędzi |
|---|---|---|---|
| Raster calculator ... | see Raster Calculator |
When starting QGIS for the first time not all core plugins are loaded.
Database
Polecenie menu |
Skrót |
Odnośnik |
Pasek narzędzi |
|---|---|---|---|
| Database ‣ | see DB Manager Plugin | Database |
When starting QGIS for the first time not all core plugins are loaded.
Web
Polecenie menu |
Skrót |
Odnośnik |
Pasek narzędzi |
|---|---|---|---|
| Metasearch | see MetaSearch Catalogue Client | Web |
When starting QGIS for the first time not all core plugins are loaded.
Geoprocesing
Polecenie menu |
Skrót |
Odnośnik |
Pasek narzędzi |
|---|---|---|---|
 Toolbox Toolbox |
zob. The toolbox |
||
 Graphical Modeler ... Graphical Modeler ... |
|||
 History and log ... History and log ... |
zob. The history manager |
||
 Options ... Options ... |
|||
 Results viewer ... Results viewer ... |
|||
 Commander Commander |
Ctrl+Alt+M |
zob. The QGIS Commander |
When starting QGIS for the first time not all core plugins are loaded.
Pomoc
Polecenie menu |
Skrót |
Odnośnik |
Pasek narzędzi |
|---|---|---|---|
 Help Contents Help Contents |
F1 |
Pomoc |
|
 What’s This? What’s This? |
Shift+F1 |
Pomoc |
|
| API Documentation | |||
| Need commercial support? | |||
 QGIS Home Page QGIS Home Page |
Ctrl+H |
||
 Check QGIS Version Check QGIS Version |
|||
 About About |
|||
 QGIS Sponsors QGIS Sponsors |
Please note that for Linux , the menu bar items listed above are the
default ones in the KDE window manager. In GNOME, the Settings menu
has different content and its items have to be found here:
| Custom CRS |
Edit |
| Style Manager | Edit |
| Configure Shortcuts |
Edit |
| Customization |
Edit |
| Options |
Edit |
| Snapping Options ... | Edit |
Pasek narzędzi
Ten pasek narzędziowy umożliwia dostęp do większości funkcji obecnych w menu, a dodatkowo do narzędzi interakcji z mapą. Każda pozycja paska posiada wyskakujący opis pomocy. Gdy przytrzymasz przez chwilę kursor myszy nad przyciskiem, wyświetli się jego krótki opis jego działania.
Every menu bar can be moved around according to your needs. Additionally, every menu bar can be switched off using your right mouse button context menu, holding the mouse over the toolbars (read also Panels and Toolbars).
Wskazówka
Przywracanie pasków
If you have accidentally hidden all your toolbars, you can get them
back by choosing menu option Settings ‣ Toolbars ‣.
If a toolbar disappears under Windows, which seems to be a problem in
QGIS from time to time, you have to remove key
\HKEY_CURRENT_USER\Software\QGIS\qgis\UI\state in the registry.
When you restart QGIS, the key is written again with the default state,
and all toolbars are visible again.
Map Legend
The map legend area lists all the layers in the project. The checkbox in each legend entry can be used to show or hide the layer. The Legend toolbar in the map legend are list allow you to Add group, Manage Layer Visibility of all layers or manage preset layers combination, Filter Legend by Map Content, Expand All or Collapse All and Remove Layer or Group.
Figure Layer tools Bar:
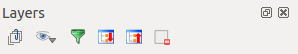
Layer Tool Bar in Map Legend
The button  allows you to add Presets views in the legend. It means that you can choose to display some layer with specific categorization and add this view to the Presets list. To add a preset view just click on , choose Add Preset... from the drop down menu and give a name to the preset. After that you will see a list with all the presets that you can recall pressing on the button.
Wszystkie zapisane zestawy warstw są dostępne również w menadżerze wydruku tak, aby można było tworzyć wydruki na ich podstawie (zob. Main properties).
Warstwy można wybierać i przeciągać w dół lub górę legendy, żeby zmienić ich porządek nakładania. Warstwy umieszczone wyżej w legendzie będą rysowane ponad warstwami umieszczonymi u dołu legendy.
Informacja
This behaviour can be overridden by the ‘Layer order’ panel.
Layers in the legend window can be organised into groups. There are two ways to do this:
- Press the
 icon to add a new group. Type in a name for
the group and press
icon to add a new group. Type in a name for
the group and press Enter. Now click on an existing layer and drag it onto the group. Wybierz jakieś warstwy, następnie kliknij prawym przyciskiem myszy w polu legendy i wybierz Grupuj wybrane. Wybrane warstwy zostaną automatycznie umieszczone w nowej grupie.
Żeby wyciągnąć warstwę z grupy możesz przeciągnąć ją poza jej obszar lub kliknąć ją prawym przyciskiem i wybrać Przenieś na główny poziom. Grupy mogą być zagnieżdżane w innych grupach.
Pole wyboru przy grupie służy do ukrywania i pokazywania wszystkich warstw grupy za pomocą jednego kliknięcia.
The content of the right mouse button context menu depends on whether the
selected legend item is a raster or a vector layer. For GRASS vector layers,
Toggle editing is not available. See section
Digitizing and editing a GRASS vector layer for information on editing GRASS vector layers.
Right mouse button menu for raster layers
- Zoom to Layer
- Show in overview
- Zoom to Best Scale (100%)
- Remove
- Duplicate
Zakres skalowy widoczności warstwy
- Set Layer CRS
Układ wsp. projekty z warstwy
- Styles ‣
- Save as ...
- Save As Layer Definition File ...
Właściwości
Zmień nazwę
Additionally, according to layer position and selection
- Move to Top-level
Grupuj zaznaczone
Right mouse button menu for vector layers
- Zoom to Layer
- Show in overview
- Remove
- Duplicate
Zakres skalowy widoczności warstwy
- Set Layer CRS
Układ wsp. projekty z warstwy
- Styles ‣
- Open Attribute Table
- Toggle Editing (not available for GRASS layers)
- Save As ...
- Save As Layer Definition Style
Filtr
- Show Feature Count
Właściwości
Zmień nazwę
Additionally, according to layer position and selection
- Move to Top-level
Grupuj zaznaczone
Right mouse button menu for layer groups
- Zoom to Group
- Remove
- Set Group CRS
Zmień nazwę
- Add Group
Można wybrać naraz większą liczbę warstw lub grup przytrzymując klawisz Ctrl w czasie wybierania warstw lewym przyciskiem myszy. Wówczas można przesunąć wybrane warstwy do nowej grupy za jednym zamachem.
You may also delete more than one layer or group at once by selecting
several layers with the Ctrl key and pressing Ctrl+D afterwards.
This way, all selected layers or groups will be removed from the layers list.
Określanie kolejności wyświetlania warstw niezależnej od legendy
There is a panel that allows you to define an independent drawing order for the map legend.
You can activate it in the menu Settings ‣ Panels ‣ Layer
order. This feature allows you to, for instance, order your layers in order of importance,
but still display them in the correct order (see figure_layer_order).
Checking the  Control rendering order box underneath the
list of layers will cause a revert to default behavior.
Control rendering order box underneath the
list of layers will cause a revert to default behavior.
Figure Layer Order:
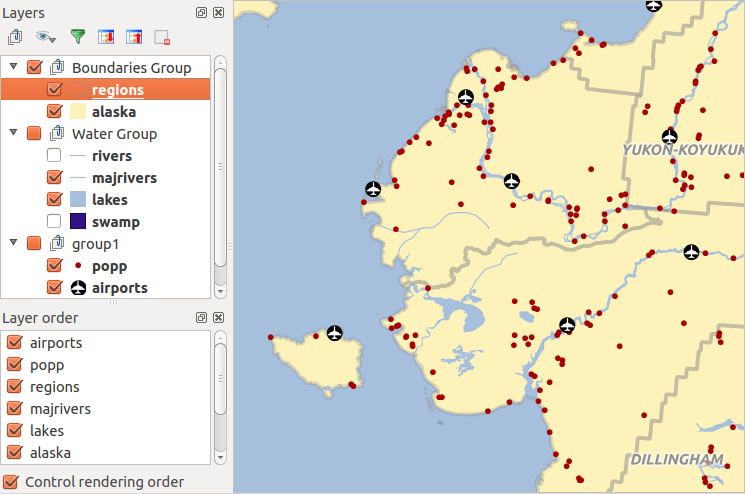
Define a legend independent layer order
Widok mapy
This is the “business end” of QGIS — maps are displayed in this area! The map displayed in this window will depend on the vector and raster layers you have chosen to load (see sections that follow for more information on how to load layers). The map view can be panned, shifting the focus of the map display to another region, and it can be zoomed in and out. Various other operations can be performed on the map as described in the toolbar description above. The map view and the legend are tightly bound to each other — the maps in view reflect changes you make in the legend area.
Wskazówka
Zmiana przybliżenia mapy za pomocą kółka myszy
Do powiększania i pomniejszania widoku można użyć kółka myszy. Należy umieścić kursor myszy w widoku mapy i przekręcić do przodu (od siebie), aby powiększyć widok lub przekręcić w tył (do siebie), aby widok pomniejszyć. Punktem centralnym przybliżenia widoku jest kursor myszy. Można dostosować zachowanie się kółka myszy w zakładce Narzędzia mapy menu Ustawienia ‣ Opcje.
Wskazówka
Przesuwanie mapy za pomocą klawiszy strzałek i spacji
Można używać klawiszy strzałek do przesuwania mapy. Umieść wskaźnik myszy wewnątrz pola mapy i kliknij. Użyj strzałki w prawo, aby przesunąć się na wschód, lewej, aby przesunąć się na zachód. Strzałka w górę przesunie widok na północ, a strzałka w dół przesunie widok na południe. Mapę można również przesuwać poruszając wskaźnikiem myszy przy wciśniętym klawiszu spacji lub wciśniętym kółku myszy.
Pasek statusu
The status bar shows you your current position in map coordinates (e.g., meters or decimal degrees) as the mouse pointer is moved across the map view. To the left of the coordinate display in the status bar is a small button that will toggle between showing coordinate position or the view extents of the map view as you pan and zoom in and out.
Next to the coordinate display you will find the scale display. It shows the scale of the map view. If you zoom in or out, QGIS shows you the current scale. There is a scale selector, which allows you to choose between predefined scales from 1:500 to 1:1000000.
To the right of the scale display you can define a current clockwise rotation for your map view in degrees.
A progress bar in the status bar shows the progress of rendering as each layer is drawn to the map view. In some cases, such as the gathering of statistics in raster layers, the progress bar will be used to show the status of lengthy operations.
If a new plugin or a plugin update is available, you will see a message at the
far left of the status bar. On the right side of the status bar, there is a small
checkbox which can be used to temporarily prevent layers being rendered to the
map view (see section Renderowanie below). The icon  immediately stops the current map rendering process.
To the right of the render functions, you find the EPSG code of the current project CRS and a projector icon. Clicking on this opens the projection properties for the current project.
Wskazówka
Określanie poprawnej skali dla twojej mapy
When you start QGIS, the default units are degrees, and this means that QGIS will interpret any
coordinate in your layer as specified in degrees. To get correct scale values, you can
either change this setting to meters manually in the General tab
under Settings ‣ Project Properties, or you can select a
project CRS clicking on the  Current CRS: icon in the
lower right-hand corner of the status bar. In the last case, the units are set to what the
project projection specifies (e.g., ‘+units=m’).
Current CRS: icon in the
lower right-hand corner of the status bar. In the last case, the units are set to what the
project projection specifies (e.g., ‘+units=m’).