A interface do QGIS
Quando o QGIS inicia, surge uma interface como a que é mostrada na figura abaixo (os números de 1 a 5 em círculos amarelos são analisados abaixo).
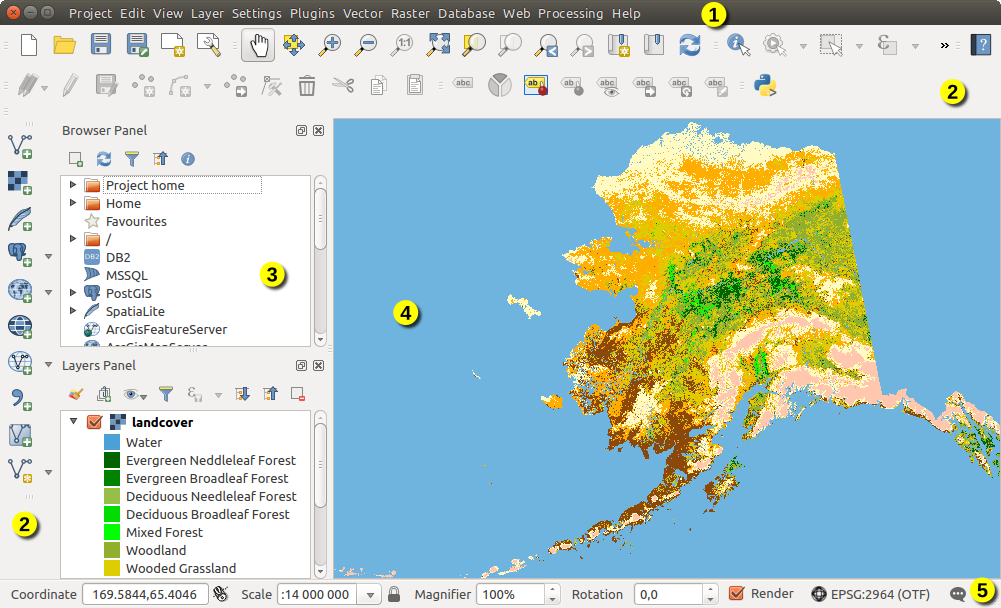
A interface do QGIS com uma amostra de dados do Alaska
Nota
Na sua janela as decorações (barra de títulos, etc.) podem aparecer de forma diferente dependendo do seu sistema operativo e do gestor de janelas.
A interface do QGIS está dividida em cinco componentes:
Barra de Menus
Barras de Ferramentas
Painéis
Vista do Mapa
Barra de Estado
Deslize para baixo para obter explicações detalhadas sobre estes elementos.
Barra de Menus
The Menu bar provides access to various QGIS functions using a standard hierarchical menu. The Menus, their options, associated icons and keyboard shortcuts are outlined below. These keyboard shortcuts are the default settings, but they can be reconfigured using the Keyboard Shortcuts via the menu.
Most Menu options have a corresponding tool and vice-versa. However, the Menus are not organized exactly like the toolbars. The locations of menu options in the toolbars are indicated below in the table. Plugins may add new options to Menus. For more information about tools and toolbars, see Barras de Ferramentas.
Nota
QGIS is a cross-platform application - while the same tools are available on all platforms, they may be placed in different menus on different operating systems. The lists below show the most common locations including known variations.
Projeto
O menu fornece pontos de acesso e saída do project file. Fornece ferramentas para:
Create a New file from scratch or using another project file as a template (see Project files options for template configuration)
Open… a project file from either a file browser or PostgreSQL database
Close a project or revert it to its last saved state
Save a project in
.qgsor.qgzfile format, either as a file or within a PostgreSQL databaseExport the map canvas to different formats or use a print layout for more complex output
Set the project properties and the snapping options when editing layers.
Menu de Opções |
Atalho |
Barra de Ferramentas |
Referência |
|---|---|---|---|
|
Ctrl+N |
Projeto |
|
|
Ctrl+O |
Projeto |
|
Fechar |
|||
|
Ctrl+S |
Projeto |
|
|
Ctrl+Shift+S |
Projeto |
|
Reverter… |
|||
Propriedades… |
Ctrl+Shift+P |
||
Opções de Atração… |
|||
|
|||
|
|||
Exportar Projeto para DXF… |
|||
Importar Camadas de DWG/DXF… |
|||
|
Ctrl+P |
Projeto |
|
|
|||
|
Projeto |
||
|
Ctrl+Q |


Sob  no macOS, o comando Sair do QGIS corresponde a (Cmd+Q).
Editar
O menu fornece a maioria das ferramentas nativas necessárias para editar geometrias e atributos de uma camada (consulte Editando para obter mais detalhes).
Menu de Opções |
Atalho |
Barra de Ferramentas |
Referência |
|---|---|---|---|
|
Ctrl+Z |
Digitalização |
|
|
Ctrl+Shift+Z |
Digitalização |
|
|
Ctrl+X |
Digitalização |
|
|
Ctrl+C |
Digitalização |
|
|
Ctrl+V |
Digitalização |
|
Atributos |
|||
|
Ctrl+. |
Digitalização |
|
|
Ctrl+. |
Digitalização |
|
|
Ctrl+. |
Digitalização |
|
|
Ctrl+. |
Digitalização |
|
|
Digitalização de formas |
||
|
Digitalização de formas |
||
Digitalização de formas |
|||
Digitalização de formas |
|||
Digitalização de formas |
|||
Digitalização de formas |
|||
|
Digitalização Avançada |
||
|
Digitalização Avançada |
||
|
Digitalização |
||
|
Digitalização |
||
|
Digitalização Avançada |
||
|
Digitalização Avançada |
||
|
Digitalização Avançada |
||
|
Digitalização Avançada |
||
|
Digitalização Avançada |
||
|
Digitalização Avançada |
||
|
Digitalização Avançada |
||
|
Digitalização Avançada |
||
|
Digitalização Avançada |
||
|
Digitalização Avançada |
||
|
Digitalização Avançada |
||
|
Digitalização Avançada |
||
|
Digitalização Avançada |
||
|
Digitalização |
||
|
Digitalização |
||
|
Digitalização Avançada |
||
|
Digitalização Avançada |
||
|
Digitalização Avançada |


As ferramentas dependentes do tipo de geometria da camada selecionada, isto é, ponto, polilinha ou polígono, são ativadas de acordo com:
Menu de Opções |
Ponto |
Polilinha |
Polígono |
|---|---|---|---|
Mover Elemento(s) |
|
|
|
Copiar e Mover Elemento(s) |
|
|
|


Ver
O mapa é renderizado nas vistas de mapa. Pode-se interagir com essas vistas usando as ferramentas (para obter mais informação consultar Working with the map canvas). Pode-se, por exemplo:
Criar novas visualizações de mapa 2D ou 3D ao lado da vista principal do mapa
Aproximar/Afastar ou mover para qualquer lugar
Consultar atributos ou geometria dos elementos visualizados
Melhorar a visualização do mapa com pré-visualizações, anotações ou decorações
Aceder a qualquer painel ou barra de ferramentas
Este menu também permite reorganizar a própria interface do QGIS usando ações tais como:
Alternar Modo de Ecrã Completo: preenche a totalidade do ecrã e oculta a barra de título
Toggle Panel Visibility: shows or hides enabled panels - useful when digitizing features (for maximum canvas visibility) as well as for (projected/recorded) presentations using QGIS” main canvas
Alternar Apenas Mapa: oculta painéis, barras de ferramentas, menus e barra de estado e mostra apenas a vista do mapa. Combinado com a opção de Ecrã Completo, faz com que a vista apresente apenas o mapa
Menu de Opções |
Atalho |
Barra de Ferramentas |
Referência |
|---|---|---|---|
|
Ctrl+M |
Navegação no Mapa |
|
|
Ctrl+Shift+M |
||
|
Navegação no Mapa |
||
|
Navegação no Mapa |
||
|
Ctrl+Alt++ |
Navegação no Mapa |
|
|
Ctrl+Alt+- |
Navegação no Mapa |
|
|
Ctrl+Shift+I |
Atributos |
|
Atributos |
|||
|
Atributos |
||
|
Ctrl+Shift+F |
Navegação no Mapa |
|
|
Navegação no Mapa |
||
|
Ctrl+J |
Navegação no Mapa |
|
|
Navegação no Mapa |
||
|
Navegação no Mapa |
||
|
Navegação no Mapa |
||
|
Atributos |
||
|
Ctrl+B |
Navegação no Mapa |
|
|
Ctrl+Shift+B |
Navegação no Mapa |
|
|
F5 |
Navegação no Mapa |
|
|
Ctrl+Shift+U |
||
|
Ctrl+Shift+H |
||
|
|||
|
|||
|
|||
Alternar Modo de Ecrã Completo |
F11 |
||
Mostrar / Ocultar Painéis |
Ctrl+Tab |
||
Alternar apenas Mapa |
Ctrl+Shift+Tab |


Under  Linux KDE, ,
and Toggle Full Screen Mode are in the
menu.
Linux KDE, ,
and Toggle Full Screen Mode are in the
menu.
Camada
The menu provides a large set of tools to create new data sources, add them to a project or save modifications to them. Using the same data sources, you can also:
Duplicate a layer, generating a copy you can modify within the same project
Copy and Paste layers or groups from one project to another as a new instance whose features and properties you can modify independently of the original
or Embed Layers and Groups… from another project, as read-only copies which you cannot modify (see Nesting Projects)
The menu also contains tools to configure, copy or paste layer properties (style, scale, CRS…).
Menu de Opções |
Atalho |
Barra de Ferramentas |
Referência |
|---|---|---|---|
|
Ctrl+L |
Data Source Manager |
|
Data Source Manager |
|||
Data Source Manager |
|||
Incorporar Camadas e Grupos… |
|||
Add from Layer Definition File… |
|||
|
|||
|
|||
|
|||
|
|||
|
F6 |
Atributos |
|
|
Digitalização |
||
|
Digitalização |
||
|
Digitalização |
||
Save As… |
|||
Save As Layer Definition File… |
|||
|
Ctrl+D |
||
|
|||
Definir a Escala de Visibilidade da Camada(s) |
|||
Definir SRC da(s) Camada(s) |
Ctrl+Shift+C |
||
Usar o mesmo SRC da camada no Projecto |
|||
Layer Properties… |
|||
Filtrar… |
Ctrl+F |
||
|
|||
|
|||
|
|||
|


Configurações
Menu de Opções |
Referência |
|---|---|
|
|
|
|
|
|
|
|
|


Under Linux KDE, you’ll find more tools in the
menu such as ,
and Toggle Full Screen Mode.
Módulos
Menu de Opções |
Atalho |
Barra de Ferramentas |
Referência |
|---|---|---|---|
|
|||
|
Ctrl+Alt+P |
Plugins |


When starting QGIS for the first time not all core plugins are loaded.
Vector
This is what the Vector menu looks like if all core plugins are enabled.
Menu de Opções |
Atalho |
Barra de Ferramentas |
Referência |
|---|---|---|---|
|
Vector |
||
|
Vector |
||
|
Vector |
||
|
Vector |
||
Alt+O + G |
|||
Alt+O + E |
|||
Alt+O + A |
|||
Alt+O + D |
|||
Alt+O + R |


By default, QGIS adds Processing algorithms to the Vector menu, grouped by sub-menus. This provides shortcuts for many common vector-based GIS tasks from different providers. If not all these sub-menus are available, enable the Processing plugin in .
Note that the list of the Vector menu tools can be extended with any Processing algorithms or some external plugins.
Matricial
This is what the Raster menu looks like if all core plugins are enabled.
Menu de Opções |
Barra de Ferramentas |
Referência |
|---|---|---|
|
||
Alinhar Raster… |
||
|
Raster |


By default, QGIS adds Processing algorithms to the Raster menu, grouped by sub-menus. This provides a shortcut for many common raster-based GIS tasks from different providers. If not all these sub-menus are available, enable the Processing plugin in .
Note that the list of the Raster menu tools can be extended with any Processing algorithms or some external plugins.
Base de Dados
This is what the Database menu looks like if all the core plugins are enabled. If no database plugins are enabled, there will be no Database menu.
Menu de Opções |
Barra de Ferramentas |
Referência |
|---|---|---|
|
Base de Dados |
|
Base de Dados |
||
Base de Dados |

When starting QGIS for the first time not all core plugins are loaded.
Web
This is what the Web menu looks like if all the core plugins are enabled. If no web plugins are enabled, there will be no Web menu.
Menu de Opções |
Barra de Ferramentas |
Referência |
|---|---|---|
|
Web |

When starting QGIS for the first time not all core plugins are loaded.
Processamento
Menu de Opções |
Atalho |
Referência |
|---|---|---|
|
Ctrl+Alt+T |
|
|
Ctrl+Alt+M |
|
|
Ctrl+Alt+H |
|
|
Ctrl+Alt+R |
|
|


When starting QGIS for the first time not all core plugins are loaded.
Ajuda
Menu de Opções |
Atalho |
Barra de Ferramentas |
|---|---|---|
|
F1 |
Ajuda |
Documentação API |
||
Reportar Problema |
||
Necessita de suporte comercial? |
||
|
Ctrl+H |
|
|
||
|
||
|


QGIS
This menu is only available under macOS and contains some OS related
commands.
Menu de Opções |
Atalho |
Referência |
|---|---|---|
Preferências |
||
Sobre o QGIS |
||
Ocultar o QGIS |
||
Mostrar Tudo |
||
Ocultar os Outros |
||
Sair do QGIS |
Cmd+Q |
Preferences and About QGIS are the same commands as and . Quit QGIS corresponds to under the other platforms.
Painéis e Barras de Ferramentas
From the menu (or ), you can
switch QGIS widgets () and toolbars
() on and off. To (de)activate any of them,
right-click the menu bar or toolbar and choose the item you want.
Each panel or toolbar can be moved and placed wherever you feel comfortable
within the QGIS interface.
The list can also be extended with the activation of Core or external
plugins.
Barras de Ferramentas
The toolbar provides access to most of the same functions as the menus, plus additional tools for interacting with the map. Each toolbar item has pop-up help available. Hover your mouse over the item and a short description of the tool’s purpose will be displayed.
Every toolbar can be moved around according to your needs. Additionally, they can be switched off using the right mouse button context menu, or by holding the mouse over the toolbars.
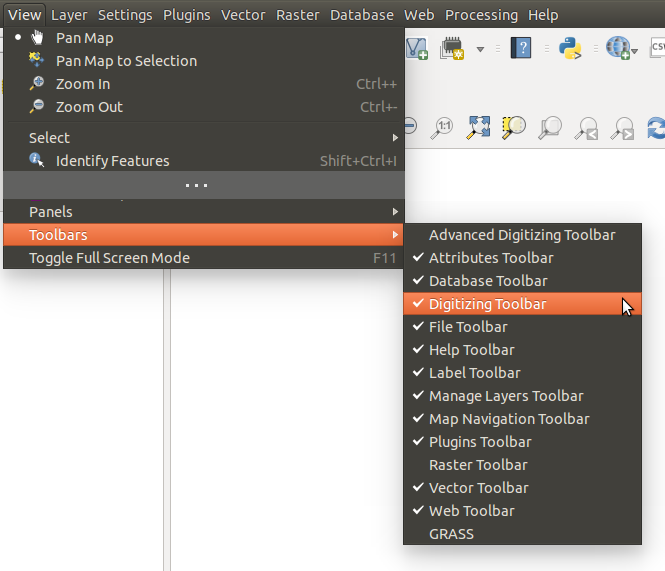
O menu da Barra de Ferramentas
Dica
Restaurar as Barras de Ferramentas
If you have accidentally hidden a toolbar, you can get it
back by choosing menu option
(or ).
If for some reason a toolbar (or any other widget) totally disappears
from the interface, you’ll find tips to get it back at restoring
initial GUI.
Painéis
Besides toolbars, QGIS provides many panels to work with by default. Panels are special widgets that you can interact with (selecting options, checking boxes, filling values…) to perform more complex tasks.

O Menu de Painéis
Em baixo estão listados painéis pré-definidos fornecidos pelo QGIS:
the Browser Panel
the Tile Scale Panel
the User Input Panel
Vista do Mapa
Also called Map canvas, this is the «business end» of QGIS — maps are displayed in this area. The map displayed in this window will depend on the vector and raster layers you have chosen to load.
When you add a layer (see e.g. Opening Data), QGIS automatically looks for its Coordinate Reference System (CRS) and zooms to its extent if you start with a blank QGIS project. The layer’s CRS is then applied to the project. If there are already layers in the project, and if the new layer has the same CRS as the project, its features falling in the current map canvas extent will be visualized. If the new layer is in a different CRS from the project’s, you must Enable on-the-fly CRS transformation from the (see On The Fly (OTF) CRS Transformation). The added layer should now be visible if data are available in the current view extent.
The map view can be panned, shifting the display to another region of the map, and it can be zoomed in and out. Various other operations can be performed on the map as described in the Barras de Ferramentas section. The map view and the legend are tightly bound to each other — the maps in the view reflect changes you make in the legend area.
Dica
Aumentado o Mapa com a roda do Rato
Pode usar a roda do rato para ampliar ou afastar o mapa. Posicione o cursos do rato dentro da área do mapa e rode a roda para a frente (longe de si) para ampliar e para trás (perto de si) para afastar. A posição do cursor do mapa é centrada onde a ampliação ocorre. Pode personalizar o comportamento de ampliação da roda do rato usando o separador Ferramentas de mapa no menu .
Dica
Movendo o Mapa com as Setas de Direcção e Barra de Espaço
You can use the arrow keys to pan the map. Place the mouse cursor inside the map area and click on the arrow keys to pan left, right, up and down. You can also pan the map by moving the mouse while holding down the space bar or the middle mouse button (or holding down the mouse wheel).
3D Map View
3D visualization support is offered through the 3D map view.
Nota
3D visualization in QGIS requires a recent version of the QT library (5.8 or later).
You create and open a 3D map view via  .
A floating QGIS panel will appear. The panel can be docked.
.
A floating QGIS panel will appear. The panel can be docked.
To begin with, the 3D map view has the same extent and view as the 2D canvas. There is no dedicated toolbar for navigation in the 3D canvas. You zoom in/out and pan in the same way as in the main 2D canvas. You can also zoom in and out by dragging the mouse down/up with the right mouse button pressed.
Navigation options for exploring the map in 3D:
Tilt and rotate
To tilt the terrain (rotating it around a horizontal axis that goes through the center of the window):
Drag the mouse forward/backward with the middle mouse button pressed
Press Shift and drag the mouse forward/backward with the left mouse button pressed
Press Shift and use the up/down keys
To rotate the terrain (around a vertical axis that goes through the center of the window):
Drag the mouse right/left with the middle mouse button pressed
Press Shift and drag the mouse right/left with the left mouse button pressed
Press Shift and use the left/right keys
Change the camera angle
Pressing Ctrl and dragging the mouse with the left mouse button pressed changes the camera angle corresponding to directions of dragging
Pressing Ctrl and using the arrow keys turns the camera up, down, left and right
Move the camera up/down
Pressing the Page Up/Page Down keys moves the terrain up and down, respectively
Zoom in and out
Dragging the mouse with the right mouse button pressed will zoom in (drag down) and out (drag up)
Move the terrain around
Dragging the mouse with the left mouse button pressed moves the terrain around
Using the up/down/left/right keys moves the terrain closer, away, right and left, respectively
To reset the camera view, click the  Zoom Full
button on the top of the 3D canvas panel.
Zoom Full
button on the top of the 3D canvas panel.
Terrain Configuration
A terrain raster provides the elevation. This raster layer must contain a band that represents elevation. To select the terrain raster:
Click the
 Configure… button at the top of
the 3D canvas panel to open the 3D configuration window
Configure… button at the top of
the 3D canvas panel to open the 3D configuration windowChoose the terrain raster layer in the Elevation pull-down menu
In the 3D Configuration window there are various other options to fine-tune the 3D scene. Before diving into the details, it is worth noting that terrain in a 3D view is represented by a hierarchy of terrain tiles and as the camera moves closer to the terrain, existing tiles that do not have sufficient detail are replaced by smaller tiles with more details. Each tile has mesh geometry derived from the elevation raster layer and texture from 2D map layers.
Configuration options and their meaning:
Elevation: Raster to be used for generation of terrain.
Vertical scale: Scale factor for vertical axis. Increasing the scale will exaggerate the terrain.
Tile resolution: How many samples from the terrain raster layer to use for each tile. A value of 16px means that the geometry of each tile will be built from 16x16 elevation samples. Higher numbers create more detailed terrain tiles at the expense of increased rendering complexity.
Skirt height: Sometimes it is possible to see small cracks between tiles of the terrain. Raising this value will add vertical walls («skirts») around terrain tiles to hide the cracks.
Map tile resolution: Width and height of the 2D map images used as textures for the terrain tiles. 256px means that each tile will be rendered into an image of 256x256 pixels. Higher numbers create more detailed terrain tiles at the expense of increased rendering complexity.
Max. screen error: Determines the threshold for swapping terrain tiles with more detailed ones (and vice versa) - i.e. how soon the 3D view will use higher quality tiles. Lower numbers mean more details in the scene at the expense of increased rendering complexity.
Max. ground error: The resolution of the terrain tiles at which dividing tiles into more detailed ones will stop (splitting them would not introduce any extra detail anyway). This value limits the depth of the hierarchy of tiles: lower values make the hierarchy deep, increasing rendering complexity.
Zoom labels: Shows the number of zoom levels (depends on the map tile resolution and max. ground error).
 Show labels: Toggles map labels on/off
- Show map tile info: Include border and tile numbers for the
terrain tiles (useful for troubleshooting terrain issues)
- Show bounding boxes: Show 3D bounding boxes of the terrain
tiles (useful for troubleshooting terrain issues)
- Show camera’s view center
3D vector layers
A vector layer with elevation values can be shown in the 3D map view by checking Enable 3D Renderer in the 3D View section of the vector layer properties. A number of options are available for controlling the rendering of the 3D vector layer.
Barra de Estado
The status bar provides you with general information about the map view and processed or available actions, and offers you tools to manage the map view.
On the left side of the status bar, the locator bar, a quick search widget,
helps you find and run any feature or options in QGIS. Simply type text
associated with the item you are looking for (name, tag, keyword…) and you get
a list that updates as you write. You can also limit the search scope using
locator filters. Click the  button to
select any of them and press the Configure entry for global settings.
button to
select any of them and press the Configure entry for global settings.
In the area next to the locator bar, a summary of actions you’ve carried out will be shown when needed (such as selecting features in a layer, removing layer) or a long description of the tool you are hovering over (not available for all tools).
In case of lengthy operations, such as gathering of statistics in raster layers, executing Processing algorithms or rendering several layers in the map view, a progress bar is displayed in the status bar.
The ![]() Coordinate option shows the current position of the mouse,
following it while moving across the map view. You can set the units (and precision)
in the tab.
Click on the small button at the left of the textbox to toggle between
the Coordinate option and the
Coordinate option shows the current position of the mouse,
following it while moving across the map view. You can set the units (and precision)
in the tab.
Click on the small button at the left of the textbox to toggle between
the Coordinate option and the  Extents option that displays
the coordinates of the current bottom-left and top-right
corners of the map view in map units.
Extents option that displays
the coordinates of the current bottom-left and top-right
corners of the map view in map units.
Next to the coordinate display you will find the Scale display. It shows the scale of the map view. There is a scale selector, which allows you to choose between predefined and custom scales.
On the right side of the scale display, press the  button to lock
the scale to use the magnifier to zoom in or out. The magnifier allows you to zoom
in to a map without altering the map scale, making it easier to tweak the
positions of labels and symbols accurately. The magnification level is expressed as a
percentage. If the Magnifier has a level of 100%, then the current
map is not magnified. Additionally, a default magnification value can be defined
within ,
which is very useful for high-resolution screens to enlarge small symbols.
button to lock
the scale to use the magnifier to zoom in or out. The magnifier allows you to zoom
in to a map without altering the map scale, making it easier to tweak the
positions of labels and symbols accurately. The magnification level is expressed as a
percentage. If the Magnifier has a level of 100%, then the current
map is not magnified. Additionally, a default magnification value can be defined
within ,
which is very useful for high-resolution screens to enlarge small symbols.
To the right of the magnifier tool you can define a current clockwise rotation for your map view in degrees.
On the right side of the status bar, there is a small checkbox which can be used temporarily to prevent layers being rendered to the map view (see section Renderização).
To the right of the render functions, you find the  EPSG:code button showing the current project CRS. Clicking on
this opens the Project Properties dialog and lets you apply another
CRS to the map view.
EPSG:code button showing the current project CRS. Clicking on
this opens the Project Properties dialog and lets you apply another
CRS to the map view.
The  Messages button next to it opens the Log
Messages Panel which has information on underlying processes (QGIS startup, plugins
loading, processing tools…)
Messages button next to it opens the Log
Messages Panel which has information on underlying processes (QGIS startup, plugins
loading, processing tools…)
Depending on the Plugin Manager settings, the status
bar can sometimes show icons to the right to inform you about availability
of  new or
  upgradeable plugins. Click the icon to
open the Plugin Manager dialog.
upgradeable plugins. Click the icon to
open the Plugin Manager dialog.
Dica
Calculando a Escala Correcta para o Seu Enquadramento do Mapa
When you start QGIS, the default CRS is WGS 84 (EPSG 4326) and
units are degrees. This means that QGIS will interpret any
coordinate in your layer as specified in degrees. To get correct scale values,
you can either manually change this setting in the General
tab under (e.g. to meters), or you can use
the EPSG:code icon seen above. In the latter case,
the units are set to what the project projection specifies (e.g., +units=us-ft).
Note that CRS choice on startup can be set in .