3.2. Lesson: Simbologia
La simbologia di un layer é il suo aspetto visuale sulla mappa. La forza del GIS rispetto ad altri modi di rappresentare dati con aspetti spaziali é che con il GIS si ha una rappresentazione visuale dinamica dei dati con cui si sta lavorando.
Quindi, l’aspetto visuale della mappa (che dipende dalla simbologia dei singoli layer) é molto importante. L’utente finale delle mappe che si producono deve essere in grado di capire semplicemente cosa la mappa rappresenti. É inoltre molto importante poter essere in grado di esplorare i dati con cui si sta lavorando, ed una buona simbologia aiuta molto.
In altre parole, avere una buona simbologia non é un lusso. Infatti, é essenziale utilizzare il GIS in maniera adeguata e produrre mappe ed informazione che gli utenti siano in grado di utilizzare.
Obiettivo di questa lezione: Essere in grado di creare qualsiasi simbologia si voglia per qualsiasi vettore.
3.2.1. |base| Follow Along: Cambiare i Colori
Per cambiare la simbologia di un layer, aprire le sue Layer Properties. Iniziamo cambiando il colore del layer landuse.
Right-click on the landuse layer in the layers list.
Select the menu item Properties… in the menu that appears.
Nota
Per definizione, é possibile accedere alle proprietá del layer tramite doppio click sul layer nella lista dei layer.
Suggerimento
The
 button at the top of the Layers
panel will open the Layer Styling panel. You can use this
panel to change some properties of the layer: by default, changes will be
applied immediately!
button at the top of the Layers
panel will open the Layer Styling panel. You can use this
panel to change some properties of the layer: by default, changes will be
applied immediately!In the Layer Properties window, select the
Symbology tab: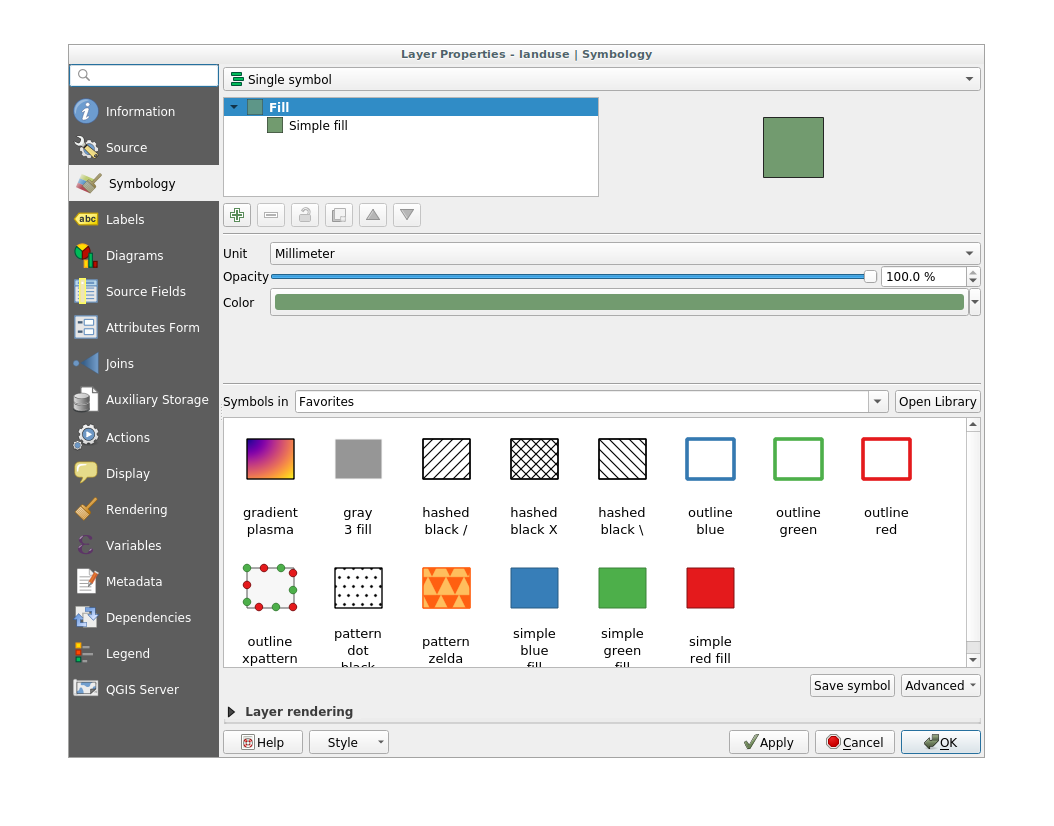
Click the color select button next to the Color label. A standard color dialog will appear.
Selezionare un colore grigio e fare click su OK.
Fare nuovamente click su OK nella finestra Layer Properties, e si vedrá il cambiamento di colore applicato al layer.
3.2.2.  Try Yourself
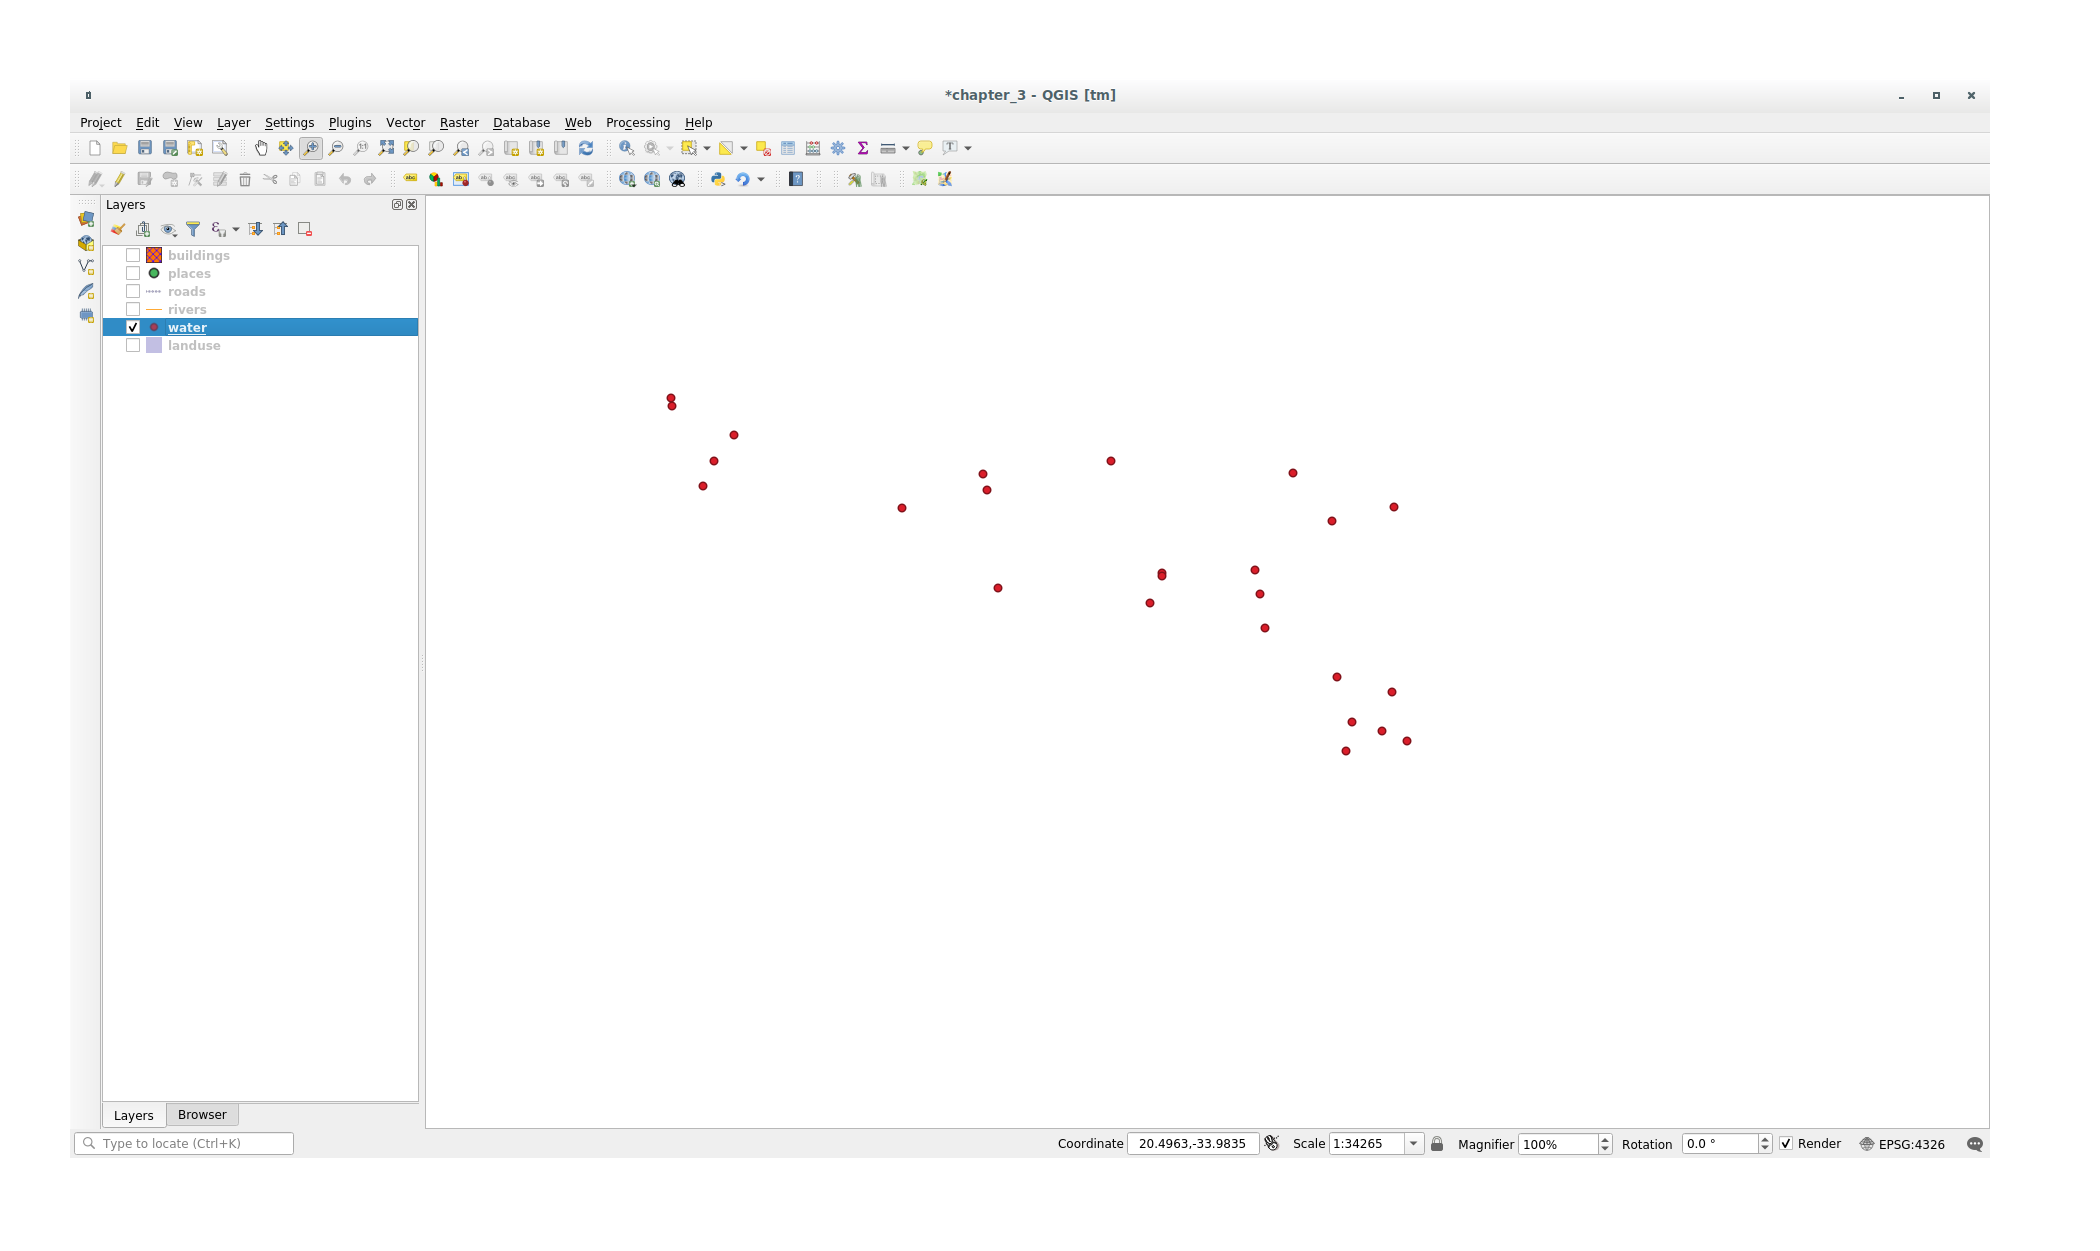
Change the color of the water layer to light blue. Try to use the Layer Styling panel instead of the Layer Properties menu.
3.2.3. Follow Along: Cambiare la Struttura del Simbolo
Tutto questo è molto utile, ma la simbologia dei layer comprende molto di più che il semplice colore. Si vogliono ora eliminare le linee tra differenti aree di uso del suolo in modo da rendere la mappa più libera alla vista.
Aprire la finestra Proprietà del Layer per il layer landuse.
Under the
Symbology tab, you will see the same kind
of dialog as before. This time, however, you’re doing more than just quickly
changing the color.In the symbol layers tree, expand the Fill dropdown and select the Simple fill option.
Click on the Stroke style dropdown. At the moment, it should be showing a short line and the words Solid Line.
Cambiarlo con No Pen.
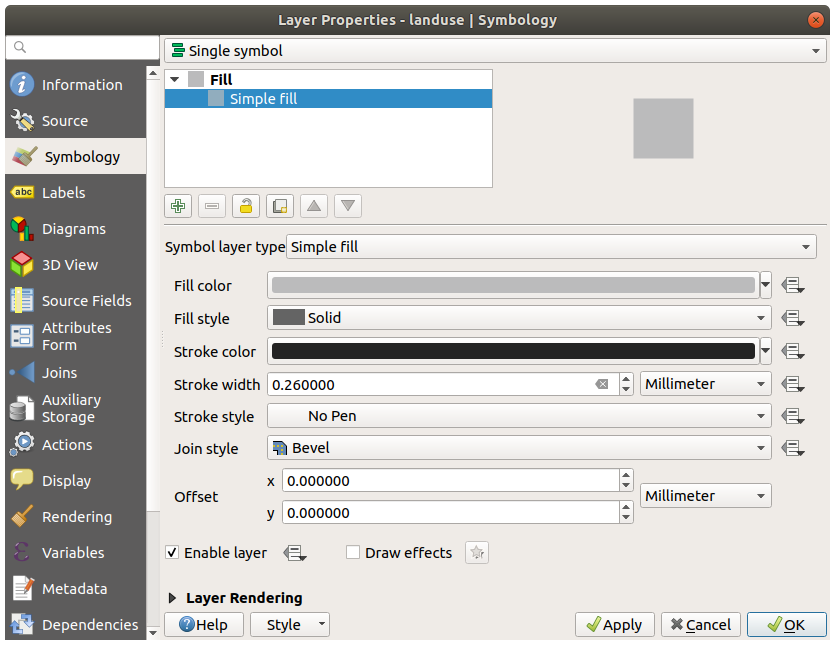
Click OK.
Adesso il layer landuse non avrá alcuna linea tra le aree.
3.2.4. Try Yourself
Change the water layer’s symbology again so that it has a darker blue outline.
Cambiare la simbologia del layer rivers per ottenere una rappresentazione ragionevole delle vie d’acqua.
Remember: you can use the Open the Layer Styling panel
button and see all the changes instantly. That panel also allows you to undo
individual changes while symbolizing a layer.
3.2.5.  Follow Along: Visibilitá Basata sulla Scala
Alcune volte si ha che un layer non sia adatto per una certa scala. Ad esempio, un insieme di dati di tutti i continenti potrebbe avere poco dettaglio, e non molto accurato a livello di strada. Quando ció accade, si vorrebbe poter nascondere l’insieme di dati per le scale inappropriate.
In our case, we may decide to hide the buildings from view at small scales. This map, for example…
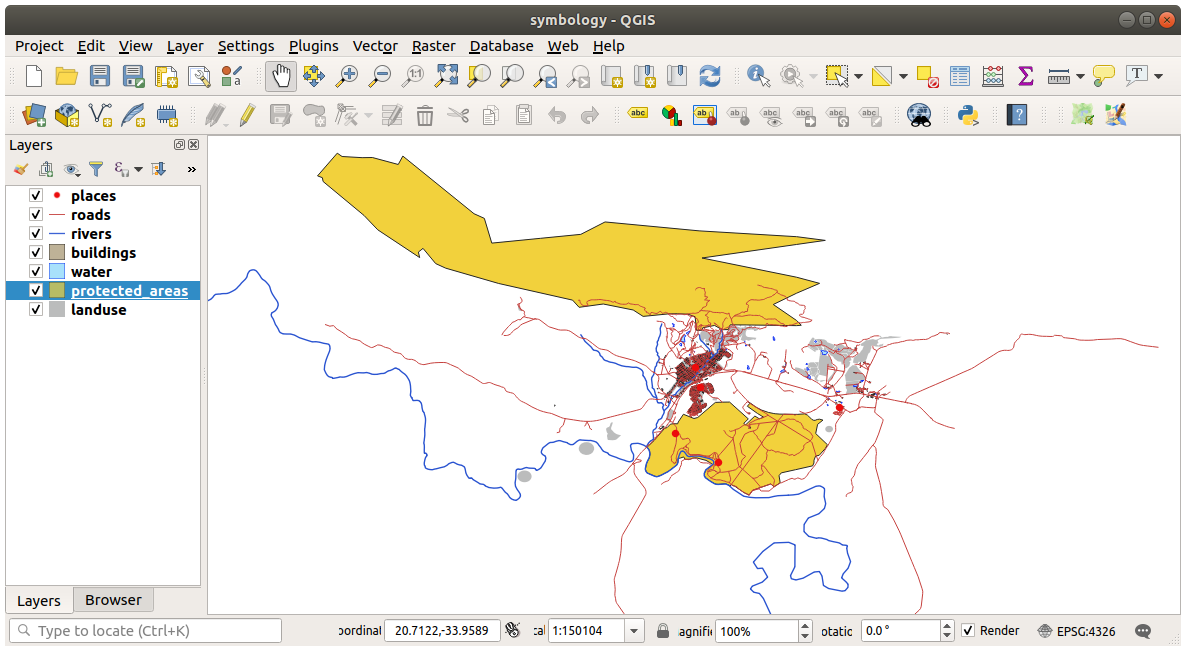
… non é molto utile. Gli edifici sono difficili da distinguere a questa scala.
Per abilitare la visualizzazione basata sulla scala:
Aprire la finestra di dialogo Layer Properties per il layer buildings.
Activate the
 Rendering tab.
Enable scale-based rendering by clicking on the checkbox labeled Scale dependent visibility:
Change the Minimum value to
1:10000.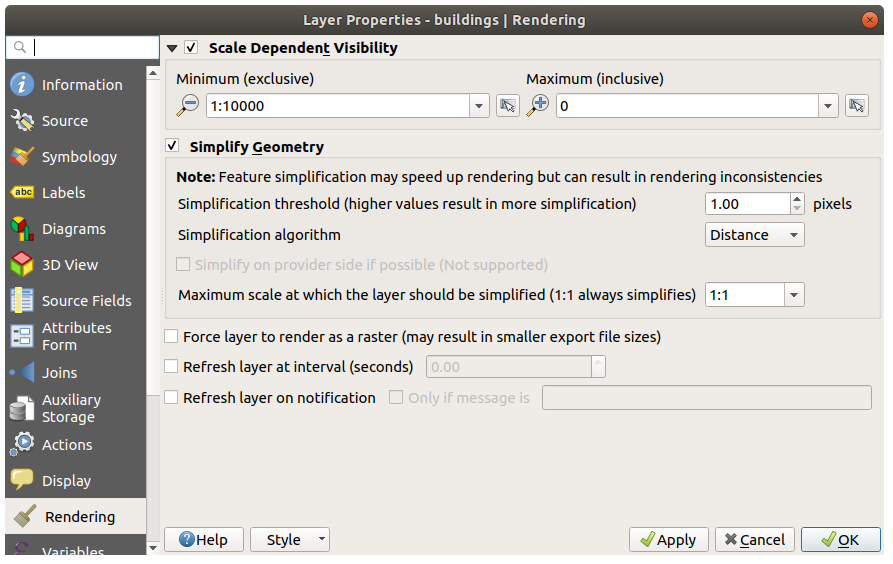
Click OK.
Testare gli effetti di questa operazione facendo zoom in e zoom out sulla mappa, notando quando il layer buildings appare e scompare.
Nota
É possibile usare la rotella del mouse per aumentare il livello di zoom. Alternativamente, utilizzare gli strumenti di zoom per fare zoom ad una finestra:


3.2.6. Follow Along: Aggiungere livelli simbolo
Ora che sai come modificare una semplice simbologia per i tuoi layers, il passo successivo è creare una simbologia più complessa. QGIS permette di farlo utilizzando i livelli simbolo.
Go back to the landuse layer’s symbol properties panel (by clicking Simple fill in the symbol layers tree).
In this example, the current symbol has no outline (i.e., it uses the No Pen border style).

Select the Fill level in the tree and click the
 Add symbol layer button.
The dialog will change to look something like this, with a new symbol layer
added:
Add symbol layer button.
The dialog will change to look something like this, with a new symbol layer
added: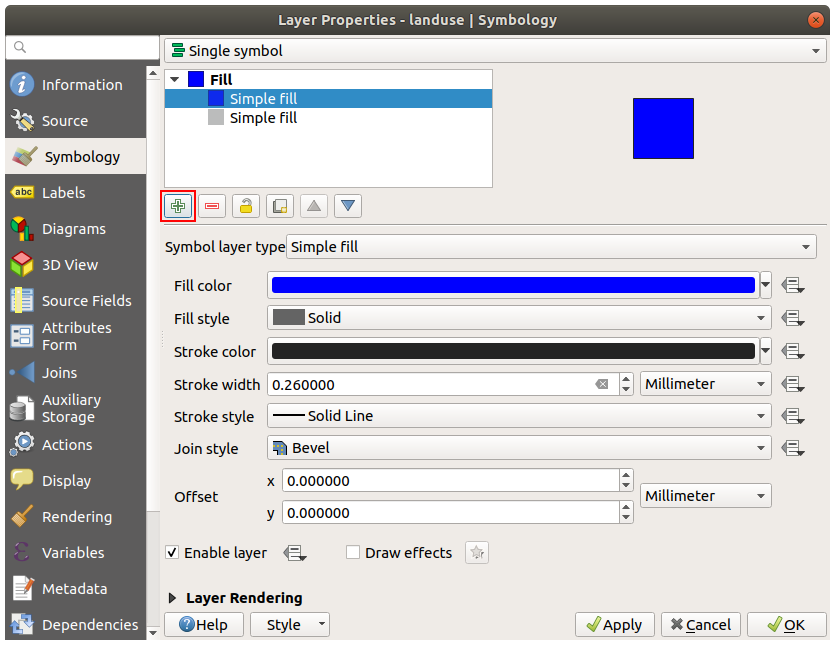
It may appear somewhat different in color, for example, but you’re going to change that anyway.
Now there’s a second symbol layer. Being a solid color, it will of course completely hide the previous kind of symbol. Plus, it has a Solid Line border style, which we don’t want. Clearly this symbol has to be changed.
Nota
It’s important not to get confused between a map layer and a symbol layer. A map layer is a vector (or raster) that has been loaded into the map. A symbol layer is part of the symbol used to represent a map layer. This course will usually refer to a map layer as just a layer, but a symbol layer will always be called a symbol layer, to prevent confusion.
With the new Simple Fill symbol layer selected:
Set the border style to No Pen, as before.
Change the fill style to something other than Solid or No brush. For example:
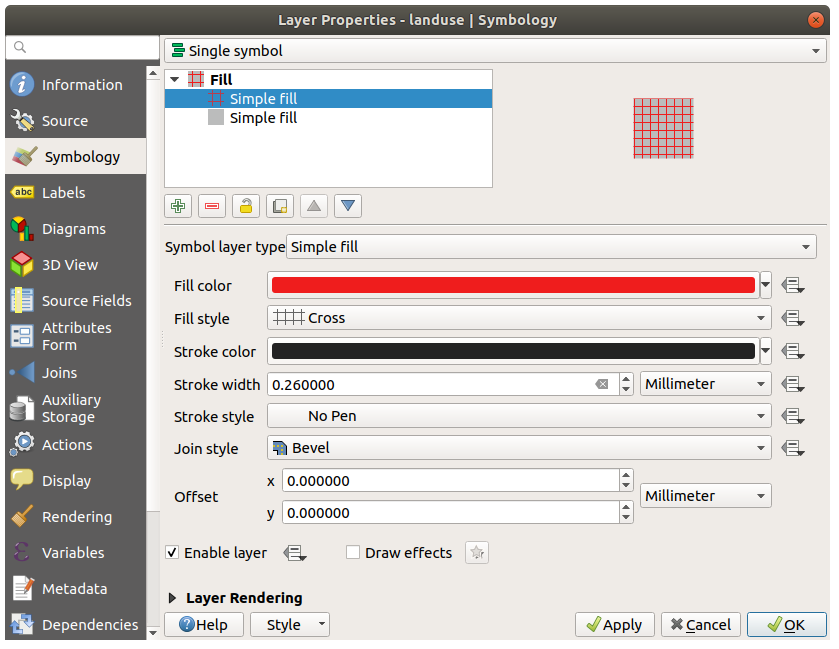
Click OK.
Now you can see your results and tweak them as needed. You can even add multiple extra symbol layers and create a kind of texture for your layer that way.
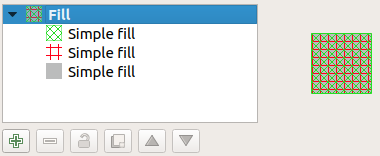
It’s fun! But it probably has too many colors to use in a real map…
3.2.7. Try Yourself
Remembering to zoom in if necessary, create a simple, but not distracting texture for the buildings layer using the methods above.
3.2.8. Follow Along: Ordering Symbol Levels
When symbol layers are rendered, they are also rendered in a sequence, similar to the way the different map layers are rendered. This means that in some cases, having many symbol layers in one symbol can cause unexpected results.
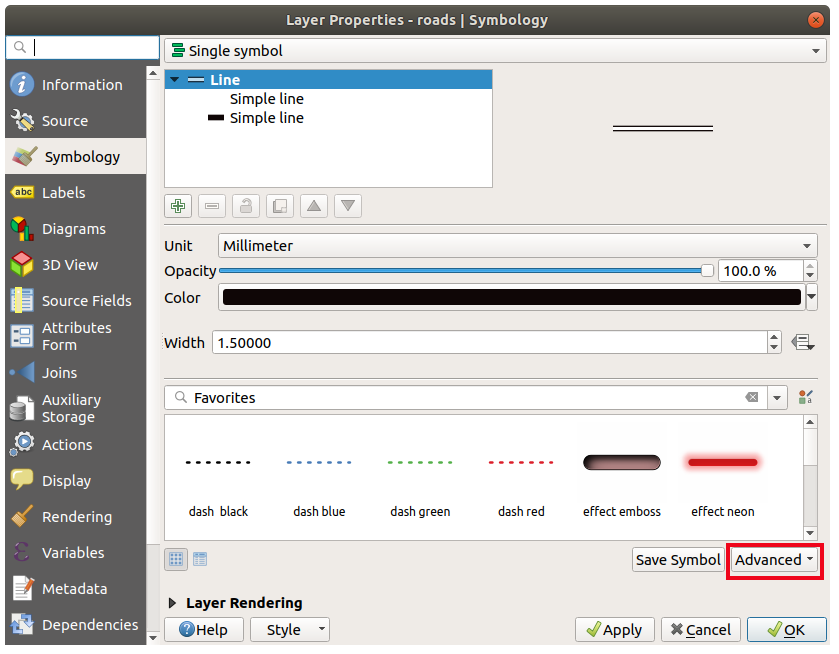
Give the roads layer an extra symbol layer (using the method for adding symbol layers demonstrated above).
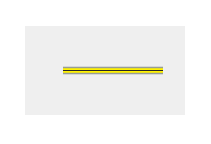
Give the base line a Stroke width of
1.5and a black color.Give the new, uppermost layer a thickness of
0.8and a white color.
You’ll notice that this happens:
Well, roads have now a street like symbology, but you see that lines are overlapping each others at each cross. That’s not what we want at all!
To prevent this from happening, you can sort the symbol levels and thereby control the order in which the different symbol layers are rendered.
To change the order of the symbol layers:
Select the topmost Line layer in the symbol layers tree.
Click in the bottom right-hand corner of the window.
This will open a dialog like this:
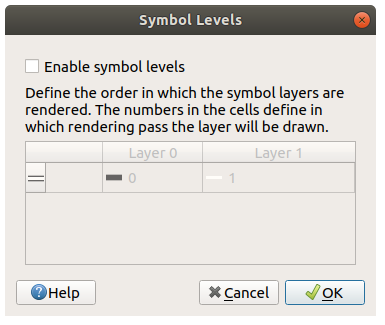
Check
 Enable symbol levels. You can then set the
layer order of each symbol by entering the corresponding level number.
0 is the bottom layer.
Enable symbol levels. You can then set the
layer order of each symbol by entering the corresponding level number.
0 is the bottom layer.In our case, we just want to activate the option, like this:
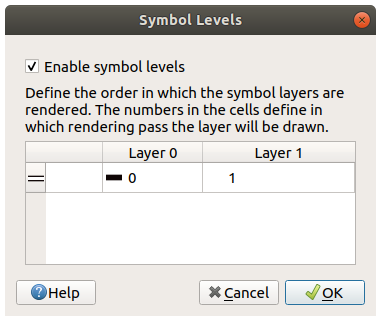
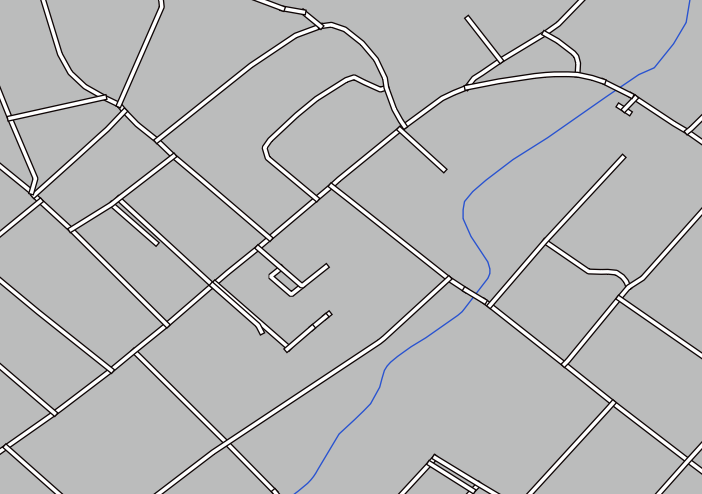
This will render the white line above the thick black line borders:
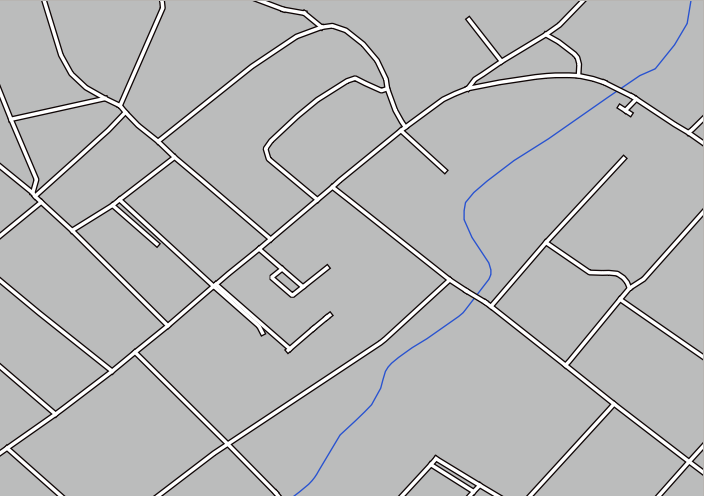
Click OK twice to return to the map.
The map will now look like this:
When you’re done, remember to save the symbol itself so as not to lose your work if you change the symbol again in the future. You can save your current symbol style by clicking the Save Style… button at the bottom of the Layer Properties dialog. We will be using the QGIS QML Style File format.
Save your style in the solution/styles/better_roads.qml folder. You can load a
previously saved style at any time by clicking the Load Style…
button. Before you change a style, keep in mind that any unsaved style you are
replacing will be lost.
3.2.9. Try Yourself
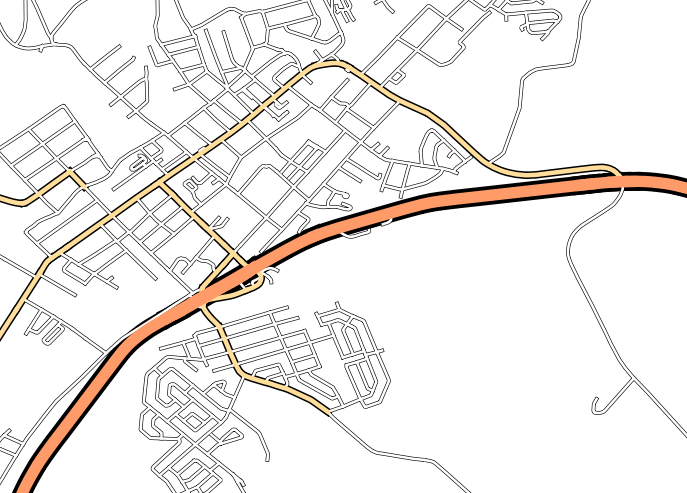
Change the appearance of the roads layer again.
Make the roads narrow and yellow, with a thin, pale gray outline and a thin black line in the middle. Remember that you may need to change the layer rendering order via the dialog.
3.2.10.  Try Yourself
Symbol levels also work for classified layers (i.e., layers having multiple symbols). Since we haven’t covered classification yet, you will work with some rudimentary pre-classified data.
Create a new map and add only the roads dataset.
Load the style file
advanced_levels_demo.qmlprovided inexercise_data/styles.Zoom in to the Swellendam area.
Using symbol layers, ensure that the outlines of layers flow into one another as per the image below:
3.2.11. Follow Along: Symbol layer types
In addition to setting fill colors and using predefined patterns, you can use different symbol layer types entirely. The only type we’ve been using up to now was the Simple Fill type. The more advanced symbol layer types allow you to customize your symbols even further.
Each type of vector (point, line and polygon) has its own set of symbol layer types. First we will look at the types available for points.
3.2.11.1. Point Symbol Layer Types
Uncheck all the layers except for places.
Change the symbol properties for the places layer:
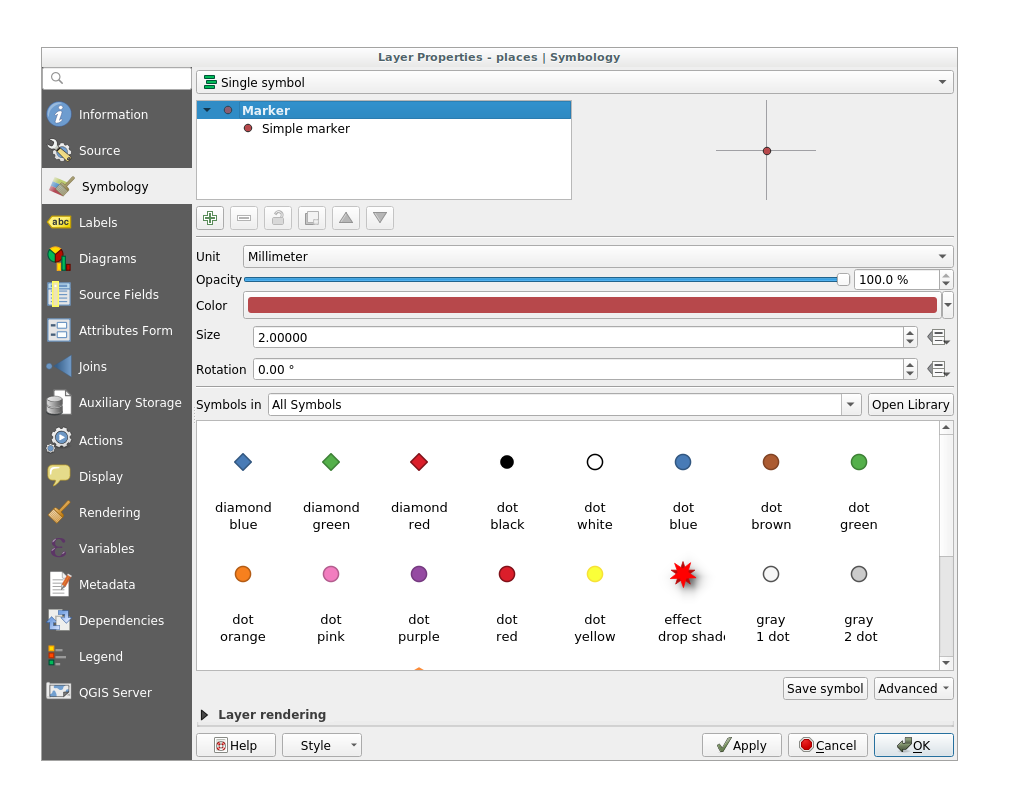
You can access the various symbol layer types by selecting the Simple marker layer in the symbol layers tree, then click the Symbol layer type dropdown:

Investigate the various options available to you, and choose a symbol with styling you think is appropriate.
If in doubt, use a round Simple marker with a white border and pale green fill, with a Size of
3.00and a Stroke width of0.5.
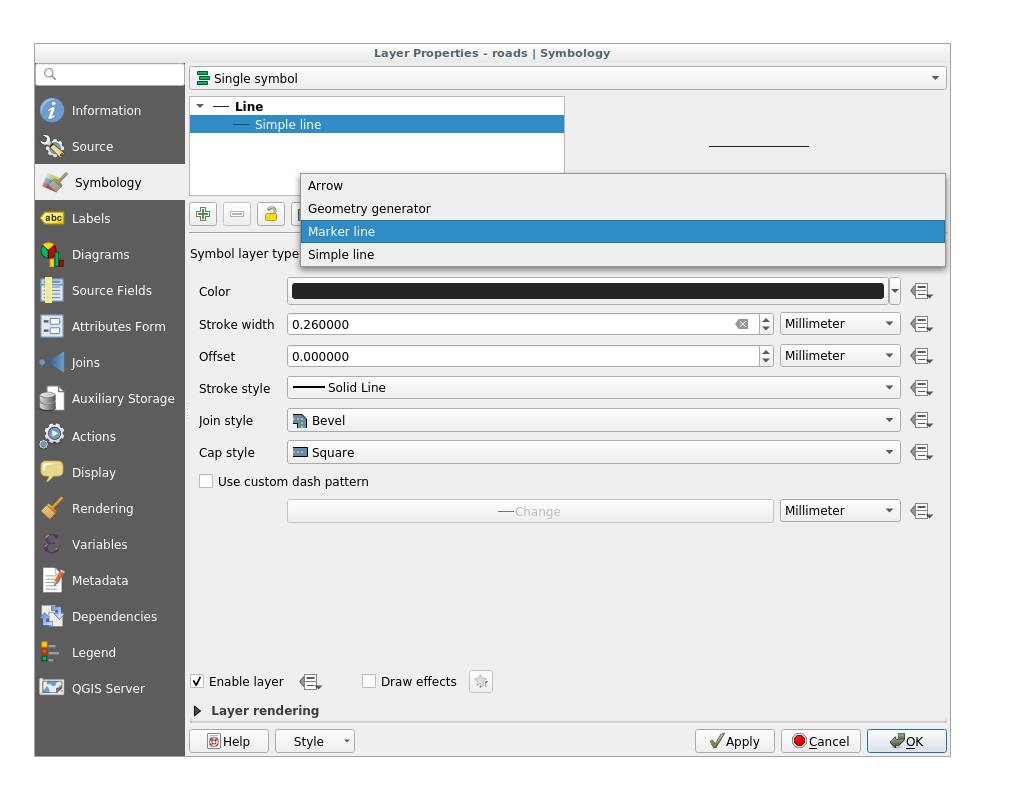
3.2.11.2. Line Symbol Layer Types
To see the various options available for line data:
Change the Symbol layer type for the roads layer’s topmost symbol layer to Marker line:
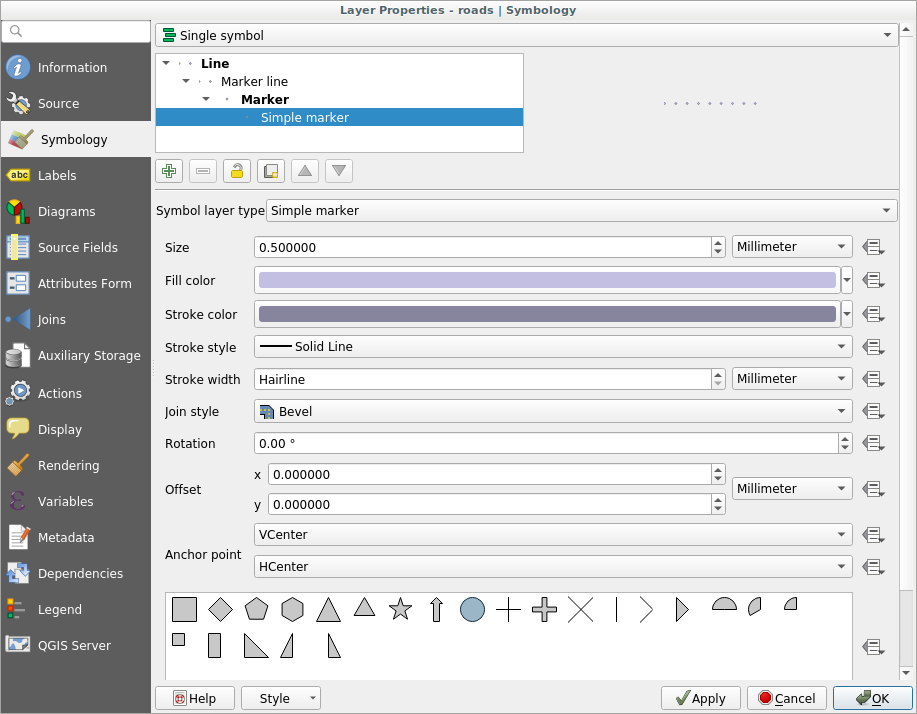
Select the Simple marker layer in the symbol layers tree. Change the symbol properties to match this dialog:
Select the Marker line layer and change the interval to
1.00: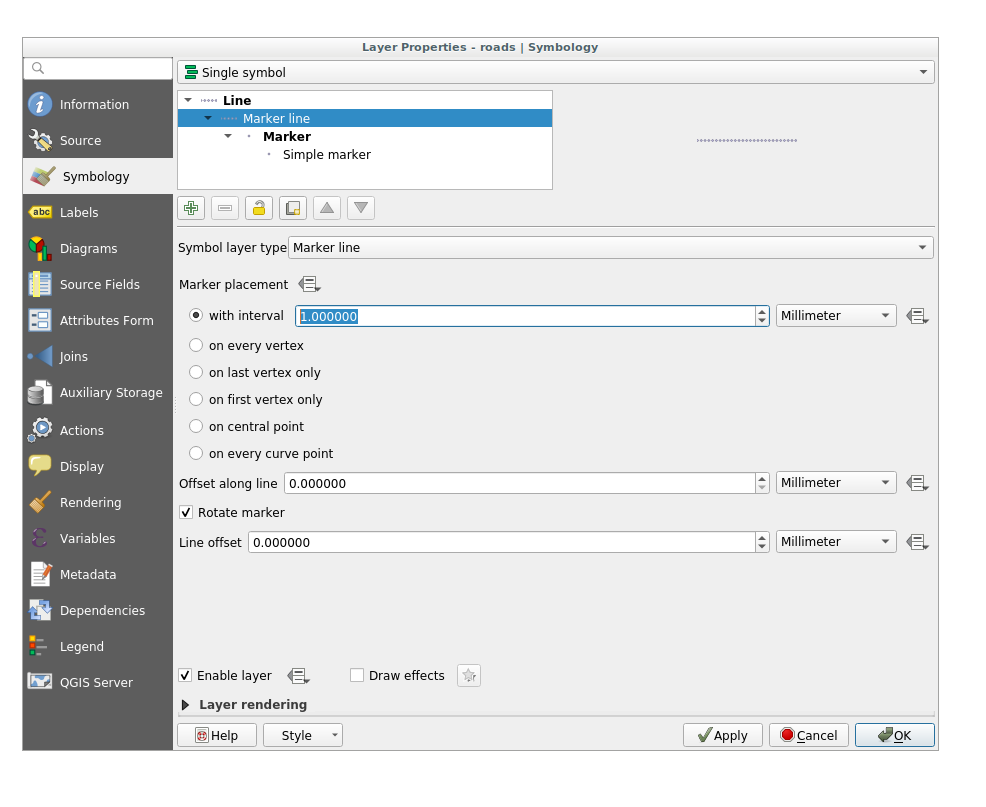
Ensure that the symbol levels are correct (via the dialog we used earlier) before applying the style.
Once you have applied the style, take a look at its results on the map. As you can see, these symbols change direction along with the road but don’t always bend along with it. This is useful for some purposes, but not for others. If you prefer, you can change the symbol layer in question back to the way it was before.
3.2.11.3. Polygon Symbol Layer Types
To see the various options available for polygon data:
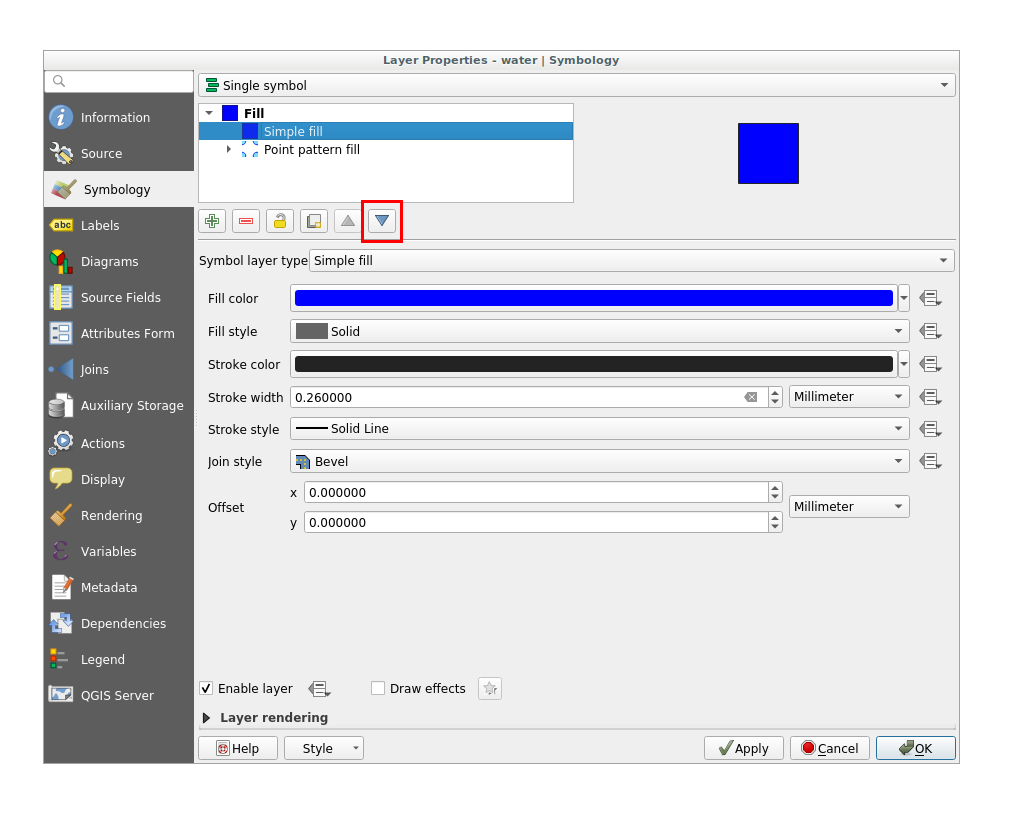
Change the Symbol layer type for the water layer, as before for the other layers.
Investigate what the different options on the list can do.
Choose one of them that you find suitable.
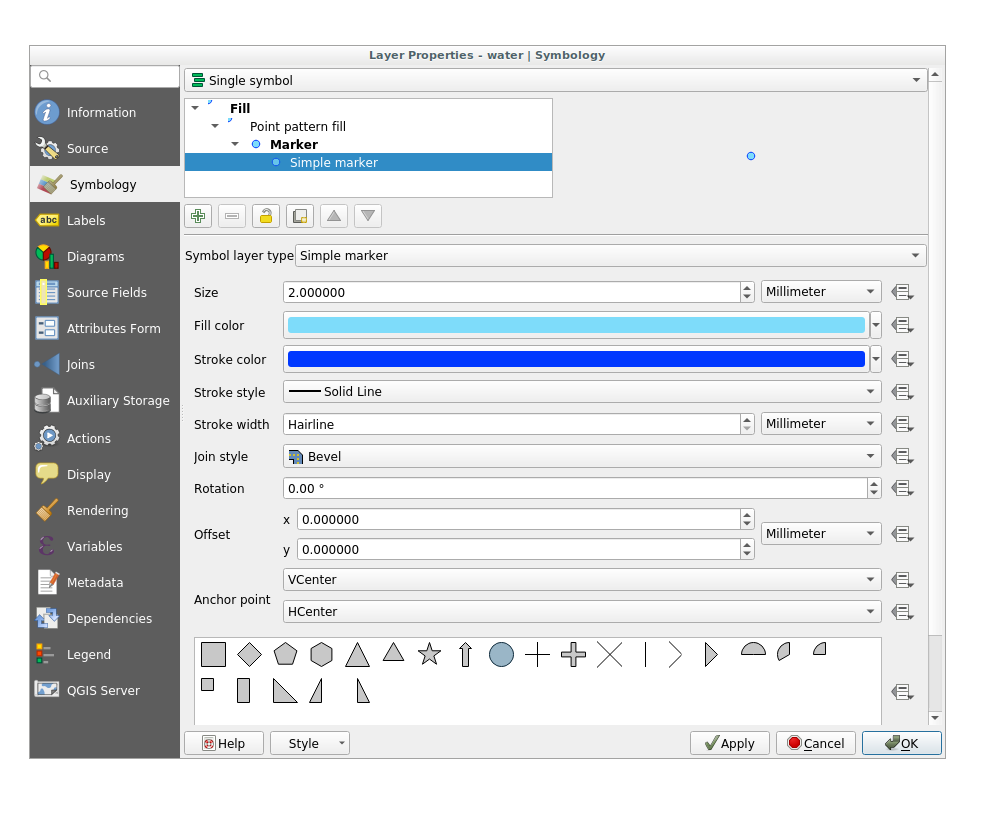
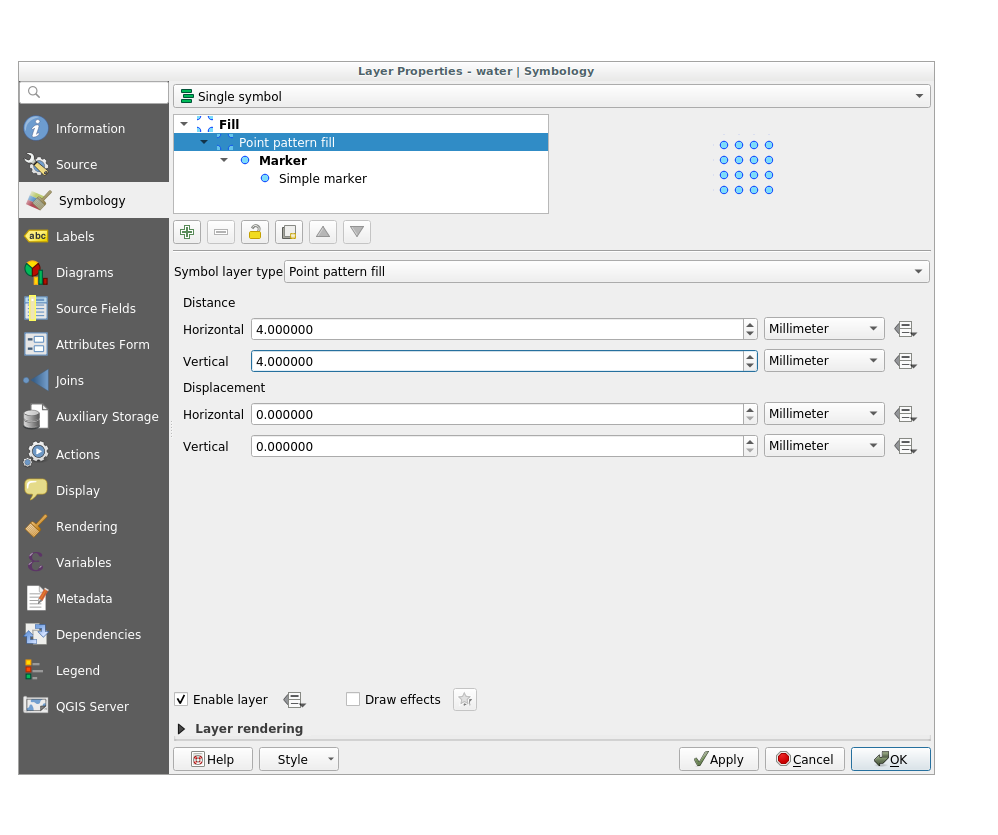
If in doubt, use the Point pattern fill with the following options:
Add a new symbol layer with a normal Simple fill.
Make it the same light blue with a darker blue border.
Move it underneath the point pattern symbol layer with the Move down button:
As a result, you have a textured symbol for the water layer, with the added benefit that you can change the size, shape and distance of the individual dots that make up the texture.
3.2.12. Try Yourself
Apply a green transparent fill color to the protected_areas layer, and change the outline to look like this:
3.2.13. Follow Along: Simbologia tramite generatore geometria
Puoi utilizzare la simbologia del generatore geometria con tutti i tipi di vettore (punti, linee e poligoni). Il simbolo risultante dipende direttamente dal tipo di vettore.
In sintesi, la simbologia del generatore di geometria ti consente di eseguire alcune operazioni spaziali usando la simbologia stessa. Ad esempio, puoi rappresentare un centroide reale sul poligono senza dover creare un livello punto.
Inoltre, hai tutte le opzioni di stile per cambiare l’aspetto del simbolo risultante.
Prova!
Seleziona il vettore water.
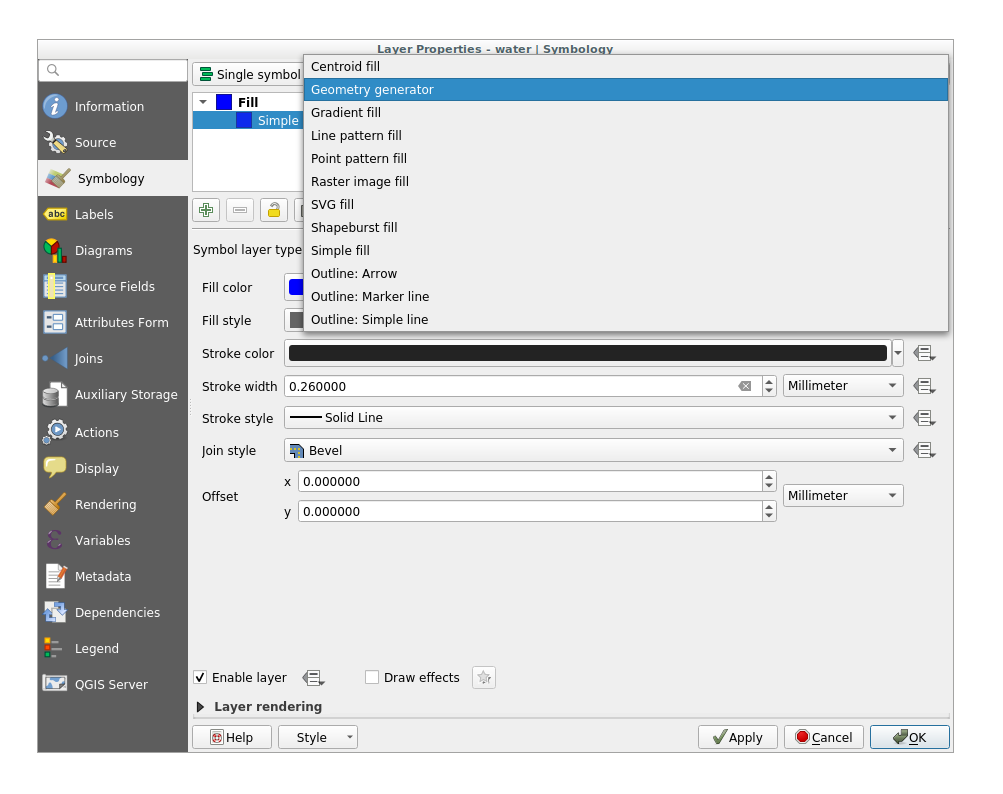
Click on Riempimento semplice`e cambia :guilabel:`Tipo simbolo del vettore con Generatore geometria.
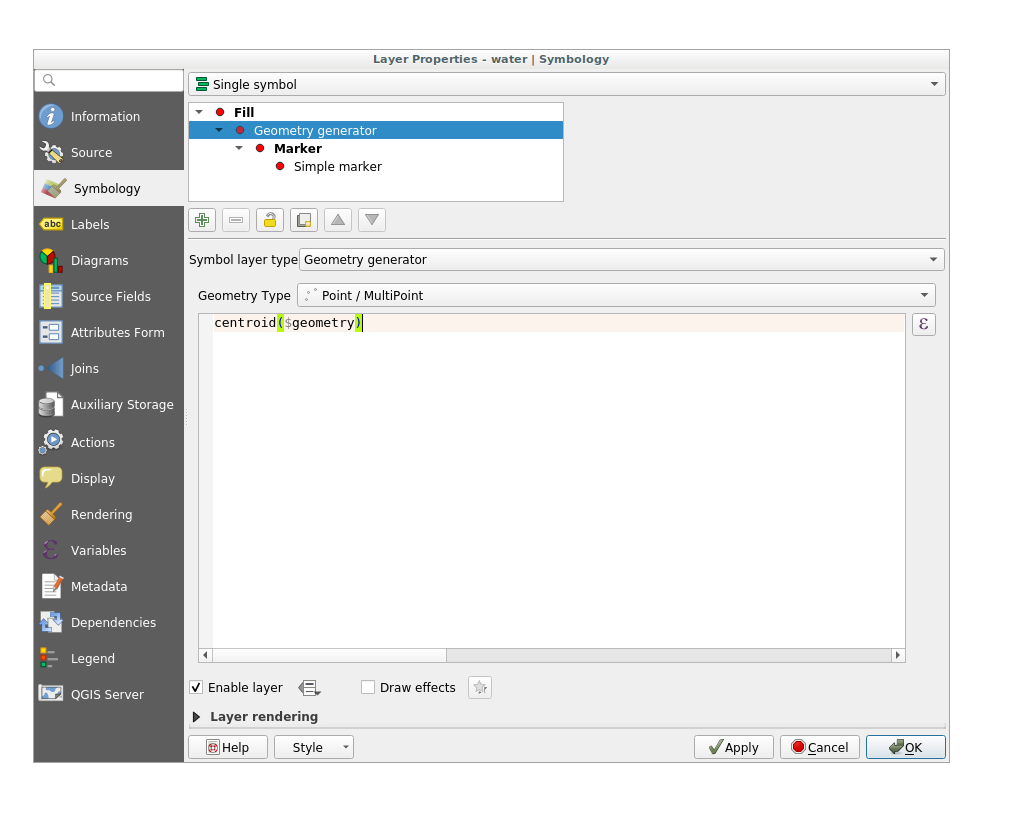
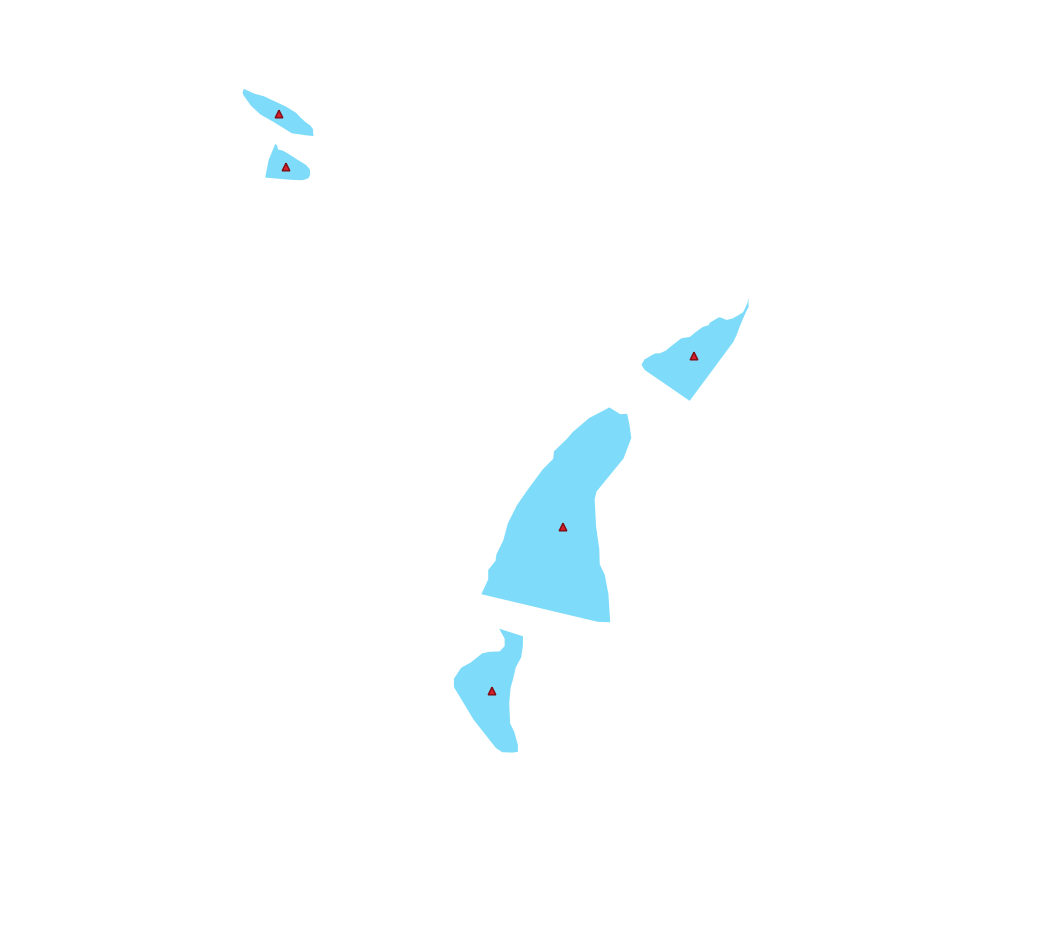
Prima di iniziare a scrivere l’interrogazione spaziale, devi scegliere il tipo di geometria che vai a realizzare. In questo esempio creerai centroidi per ogni elemento, quindi cambia il tipo di geometria in Punto / Multipunto.
Adesso scrivi l’interrogazione nell’apposito pannello.
centroid($geometry)
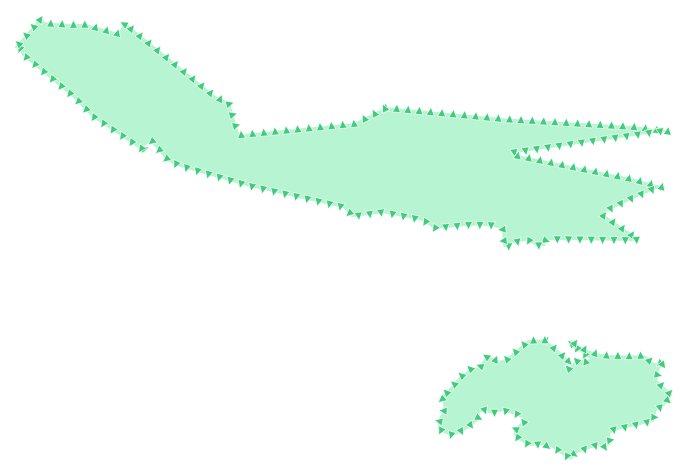
Quando fai clic su OK, vedrai che il vettore water viene reso come livello punto! Hai appena eseguito un’operazione spaziale all’interno della simbologia del livello stesso, non è sorprendente?
Con la simbologia tramite genoratore geometria puoi oltrepassare i limiti di una normale simbologia.
3.2.13.1. Try Yourself
Il generatore geometria è un altro livello per i simboli. Prova ad aggiungereun altro Riempimento semplice sotto quello di Generatore geometria.
Modifica anche l’aspetto del simbolo punto della simbologia del generatore geometria.
Il risultato finale dovrebbe assomigliare a questo:
3.2.14. Follow Along: Crea un riempimento SVG perasonalizzato
Nota
Per fare questo esercizio, devi avere installato il programma di produzione vettoriale gratuito Inkscape.
Avvia il programma Inkscape. Vedrai la seguente interfaccia:
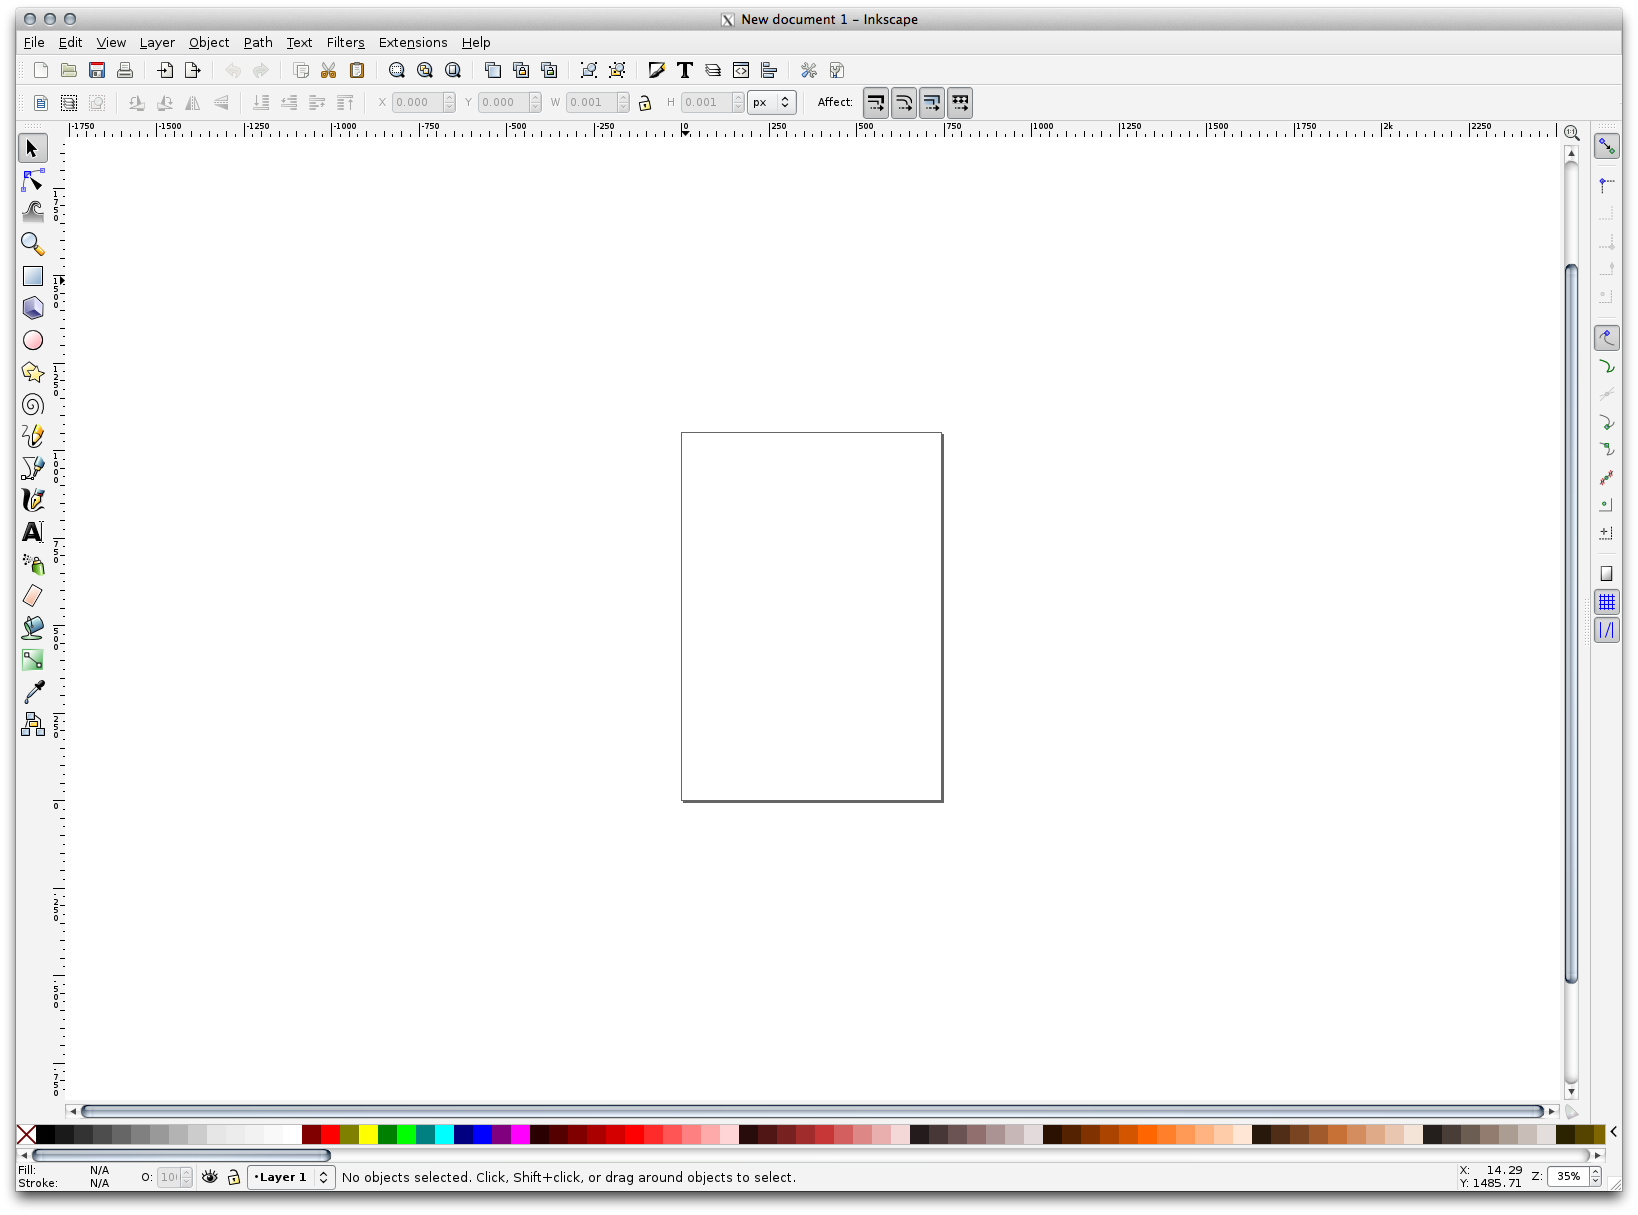
Dovresti trovare familiare questo se hai usato altri programmi per immagini vettoriali, come Corel.
Innanzitutto, riduci la pagina a una dimensione appropriata per una piccola trama.
Clic su . Avrai la finestra di dialogo Proprietà del documento.
Cambia Unità con px.
Cmbia Larghezza e Altezza a
100.Chiudi la finestra di dialogo quando lo hai fatto.
Clic su per vedere la pagina su cui stai lavorando.
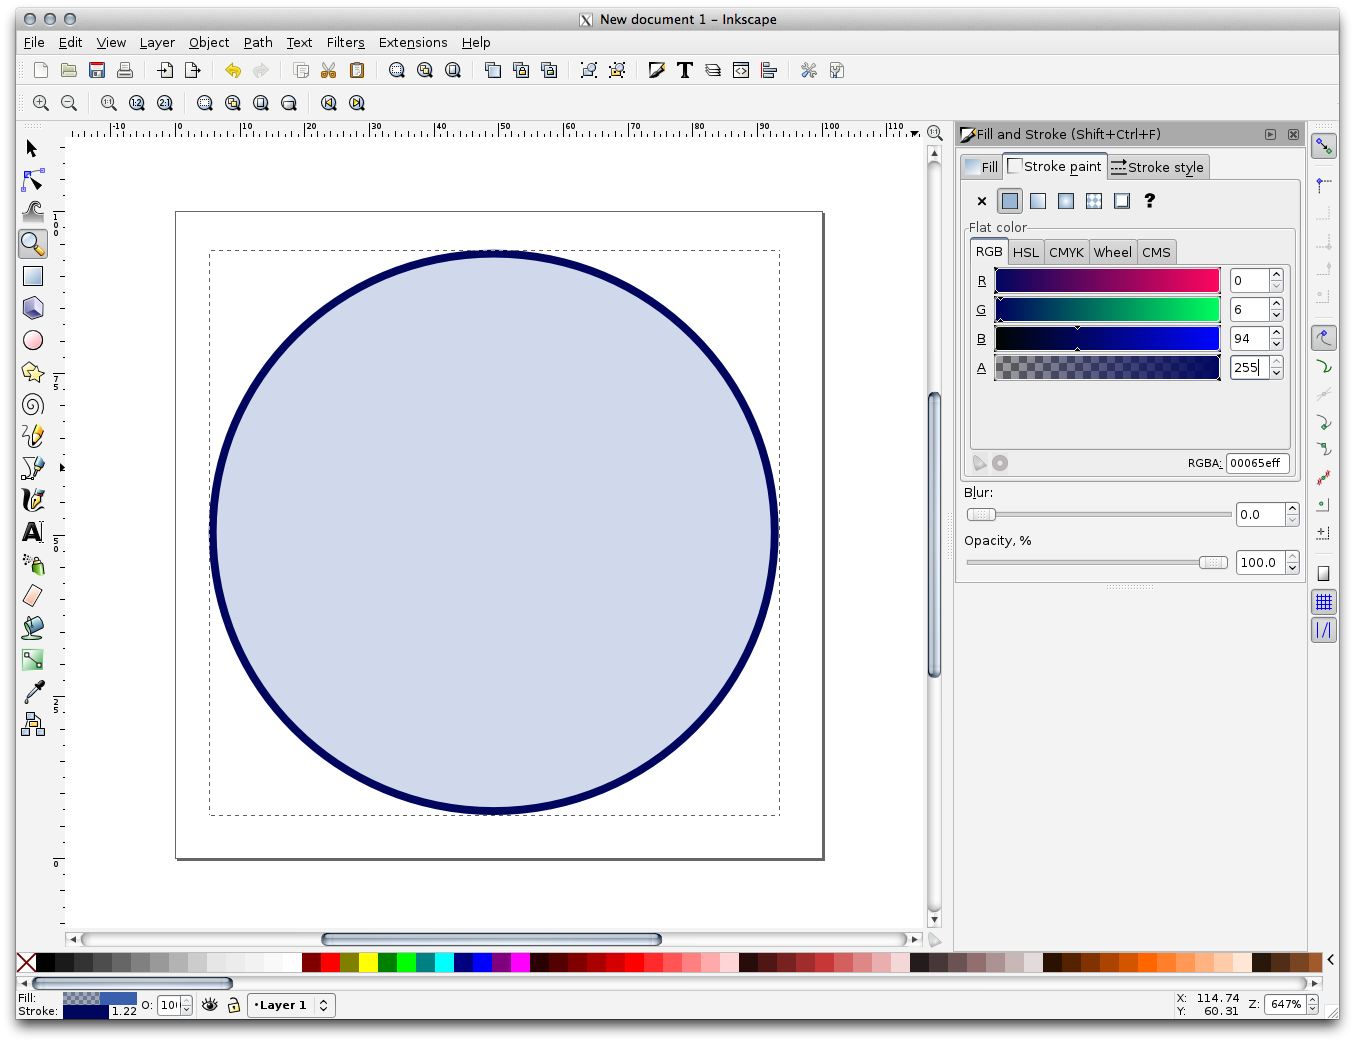
Seleziona lo strumento Crea circolo:
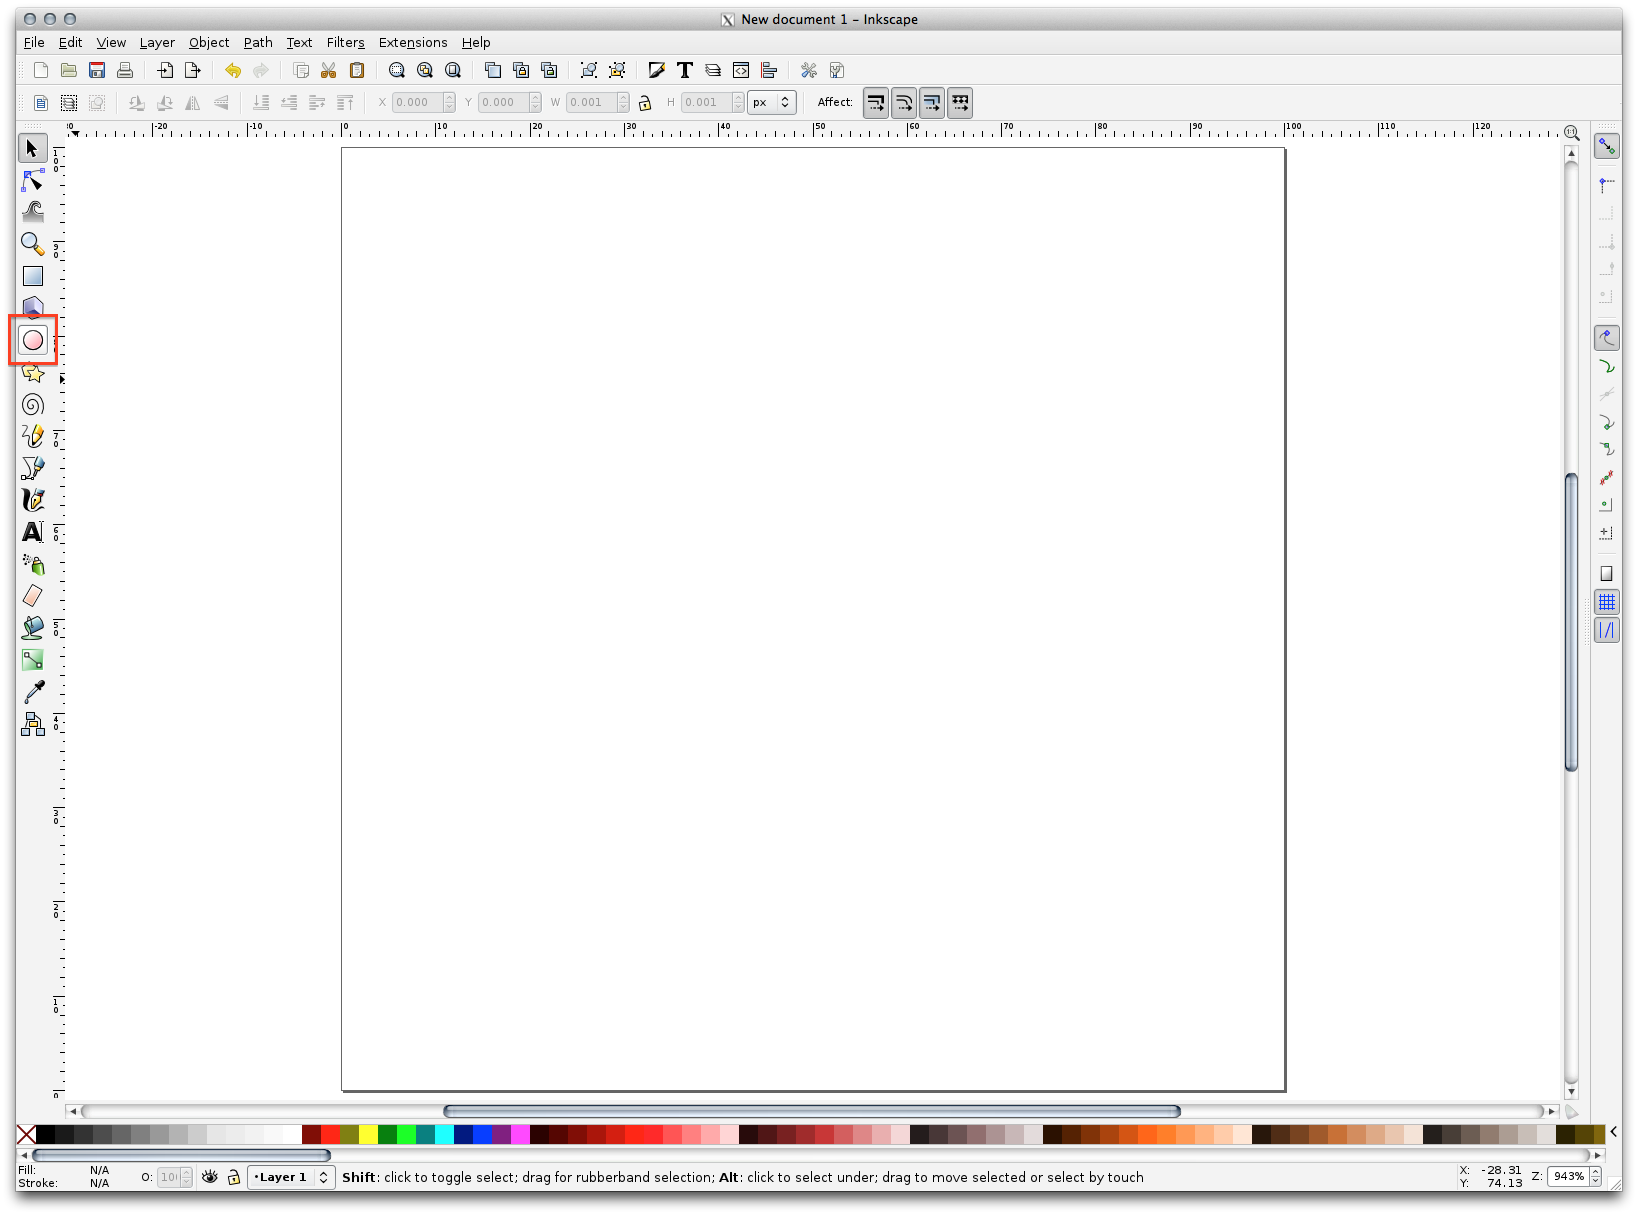
Clic e spostati sulla pagina per disegnare un elisse. Per trasformare l’ellisse in un cerchio, tieni premuto il tasto:kbd:Ctrl mentre lo disegni.
Clic destro sul cerchio che hai appena creato e apri le relative opzioni Riempimenti e contorni. Puoi modificare la vista, ad esempio:
Cambia il colore Riempimento in un grigio-blu chiaro,
Assegna al contorno un clore scuro nella scheda Colore contorno,
E riduci lo spessore del bordo nella scheda Stile contorno .
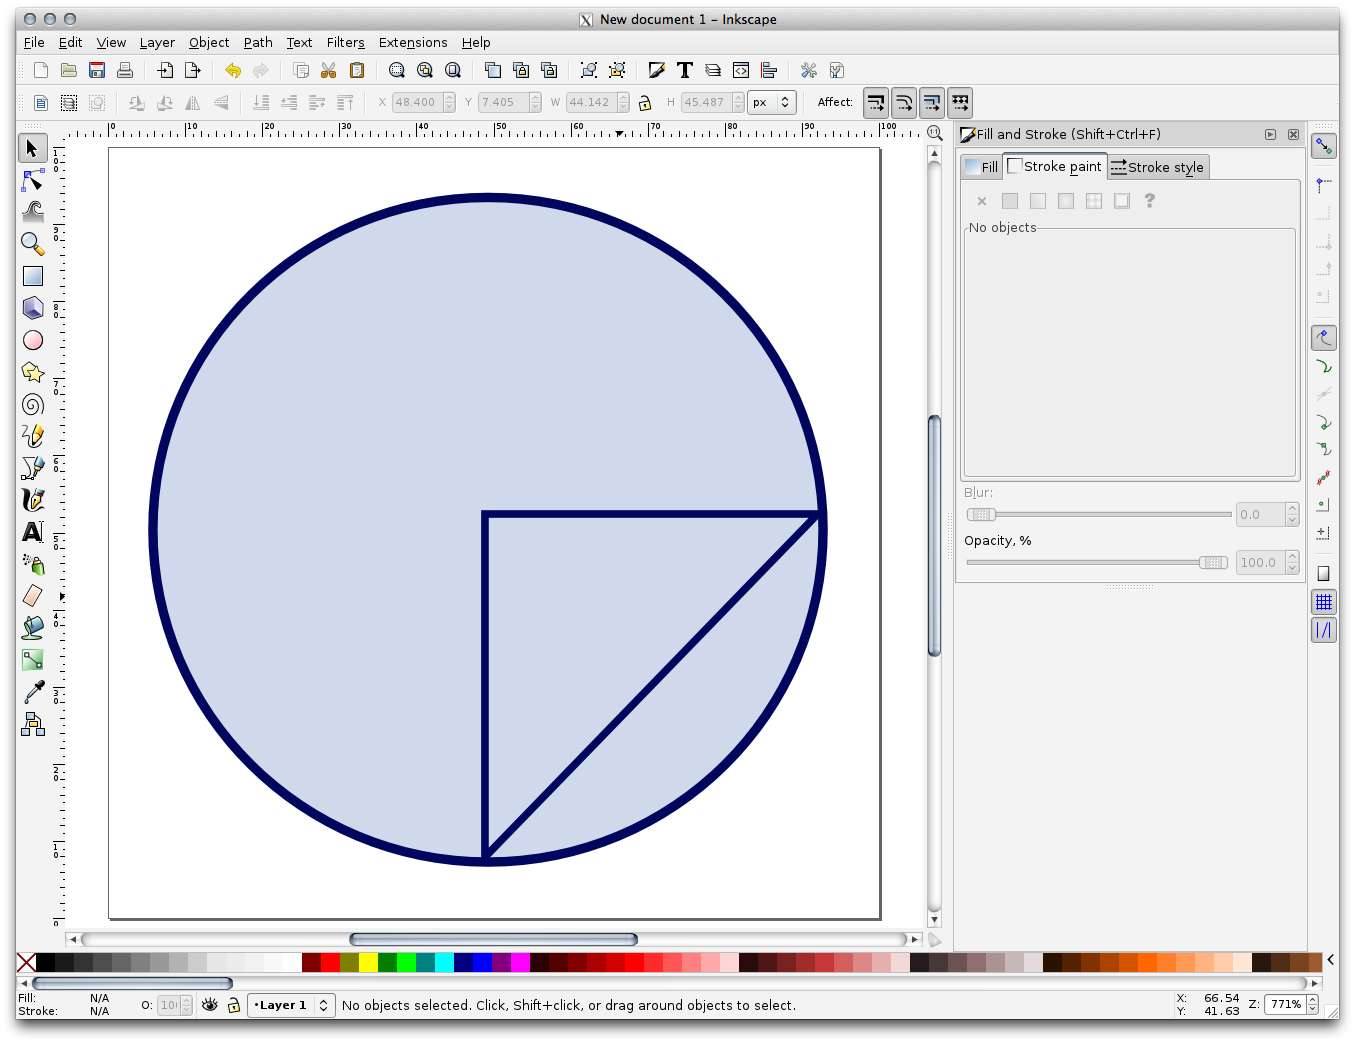
Draw a line using the Pencil tool:
Click once to start the line. Hold Ctrl to make it snap to increments of 15 degrees.
Move the pointer horizontally and place a point with a simple click.
Click and snap to the vertex of the line and trace a vertical line, ended by a simple click.
Now join the two end vertices.
Change the color and width of the triangle symbol to match the circle’s stroke and move it around as necessary, so that you end up with a symbol like this one:
If the symbol you get satisfies you, then save it as landuse_symbol under the directory that the course is in, under
exercise_data/symbols, as SVG file.
In QGIS:
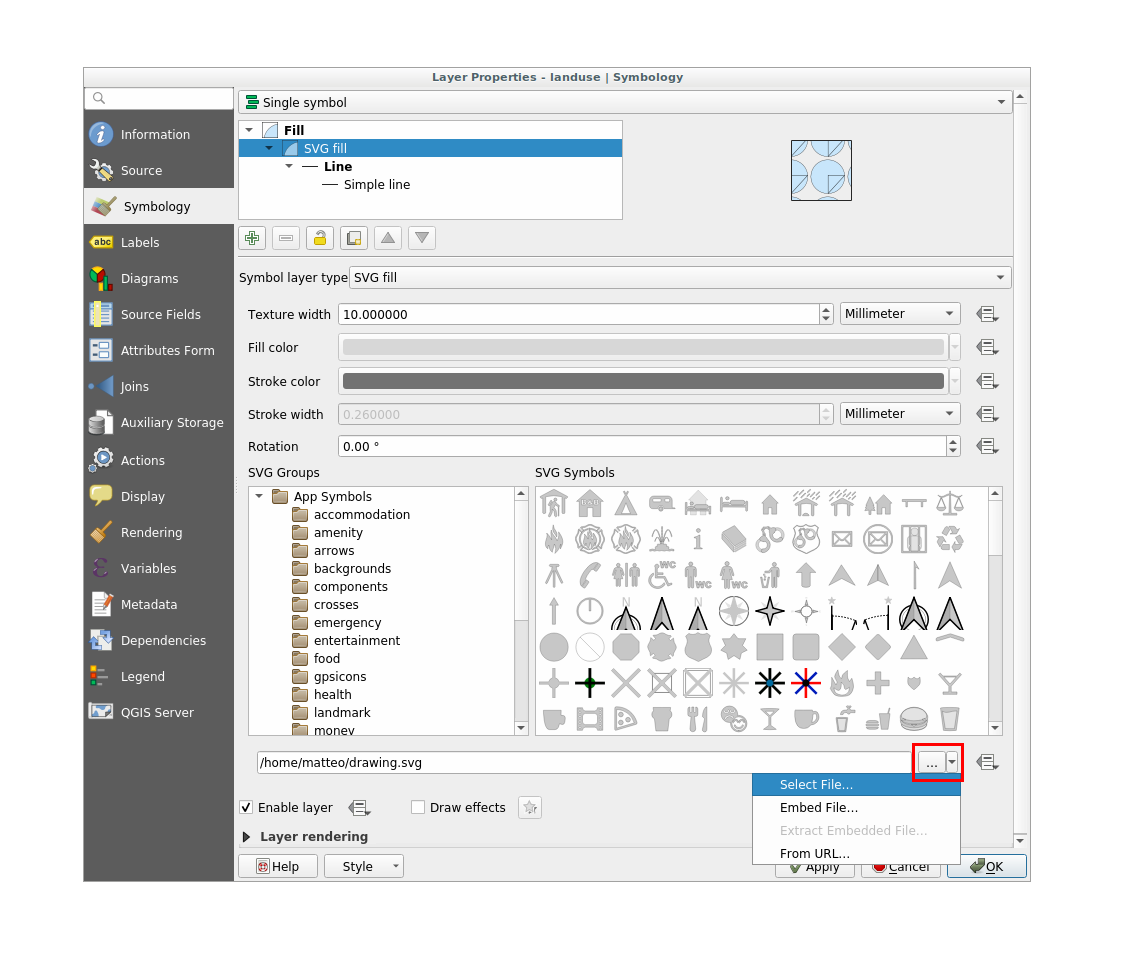
Open the Layer Properties for the
landuselayer.In the
Symbology tab, change the symbol structure by
changing the Symbol Layer Type to SVG Fill```
shown below.Click the … button and then Select File… to select your SVG image.
It’s added to the symbol tree and you can now customize its different characteristics (colors, angle, effects, units…).
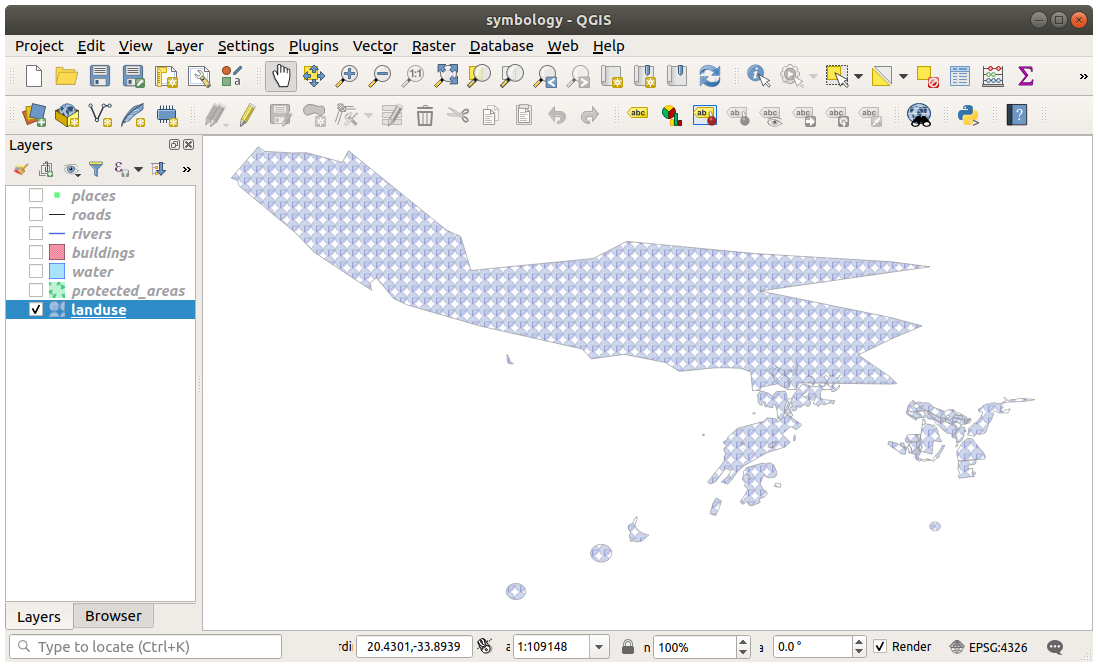
Once you validate the dialog, features in landuse layer should now be covered by a set of symbols, showing a texture like the one on the following map. If textures are not visible, you may need to zoom in the map canvas or set in the layer properties a bigger Texture width.
3.2.15. In Conclusion
Changing the symbology for the different layers has transformed a collection of vector files into a legible map. Not only can you see what’s happening, it’s even nice to look at!
3.2.16. Further Reading
3.2.17. What’s Next?
Changing symbols for whole layers is useful, but the information contained within each layer is not yet available to someone reading these maps. What are the streets called? Which administrative regions do certain areas belong to? What are the relative surface areas of the farms? All of this information is still hidden. The next lesson will explain how to represent this data on your map.
Nota
Did you remember to save your map recently?