Travailler avec des données maillées (mesh)
Qu’est-ce qu’un maillage ?
Un maillage est une grille non structurée qui contient usuellement des composantes temporelle ou d’autres types. La composante spatiale contient une collection de sommets, d’arêtes et de faces en 2D ou en 3D :
sommets : points XY(Z) (dans le système de coordonnées de la couche)
arêtes : connecte des paires de sommets
faces : une face est définie par une série d’arêtes formant une surface fermée, typiquement un triangle ou un quadrilatère et, plus rarement, un polygone composé de plus de sommets

Différents types de maillage
QGIS est actuellement capable d’afficher des données maillées composées de triangles ou de quadrilatères.
Le maillage fournit les information sur la structure spatiale. En plus, un maillage peut contenir des jeux de données (des groupes) qui attribuent une valeur à chaque sommet. Voici un exemple avec un maillage triangulaire dont les numéros de sommets apparaissent sur l’image ci-dessous :
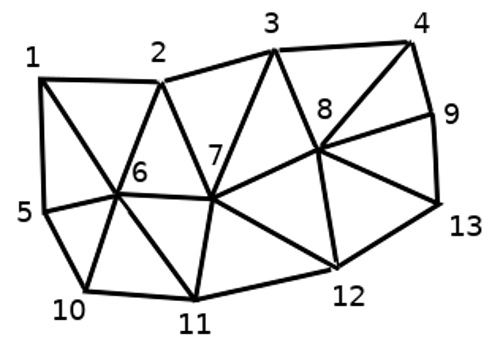
Maillage triangulaire dont les sommets sont numérotés
Chaque sommet peut stocker plusieurs jeux de données (très souvent de grandes quantités) et ceux-ci peuvent avoir également une dimension temporelle. Ainsi, un unique fichier peut contenir de très nombreux jeux de données.
Le tableau qui suit donne une idée des informations qui peuvent être stockées dans les jeux de données maillés. Les colonnes correspondent aux numéros des sommets et chaque ligne représente un jeu de données. Les jeux de données peuvent être de différents types. Dans cet exemple, il s’agit de la vitesse du vent à 10m à différents moments (t1, t2, t3).
De la même manière, un jeu de données maillé peut stocké des vecteurs de valeurs pour chaque sommet. Par exemple, la direction du vent à un moment donné :
Vent à 10m |
1 |
2 |
3 |
… |
|---|---|---|---|---|
Vitesse à 10m au temps t1 |
17251 |
24918 |
32858 |
… |
Vitesse à 10m au temps t2 |
19168 |
23001 |
36418 |
… |
Vitesse à 10m au temps t3 |
21085 |
30668 |
17251 |
… |
… |
… |
… |
… |
… |
Direction du vent à 10m au temps t1 |
[20,2] |
[20,3] |
[20,4.5] |
… |
Direction du vent à 10m au temps t2 |
[21,3] |
[21,4] |
[21,5.5] |
… |
Direction du vent à 10m au temps t3 |
[22,4] |
[22,5] |
[22,6.5] |
… |
… |
… |
… |
… |
… |
Nous pouvons visualiser les données en attribuant des couleurs aux valeurs (de la même façon que pour les rendus raster en Pseudo-couleur à bande unique) et en interpolant les données entre les sommets en fonction de la topologie. Il est courant que les valeurs soient des vecteurs 2D plutôt que de simples valeurs scalaires (comme pour la direction du vent). Pour de telles types de valeurs, il est préférable d’afficher des flèches indiquant les directions.
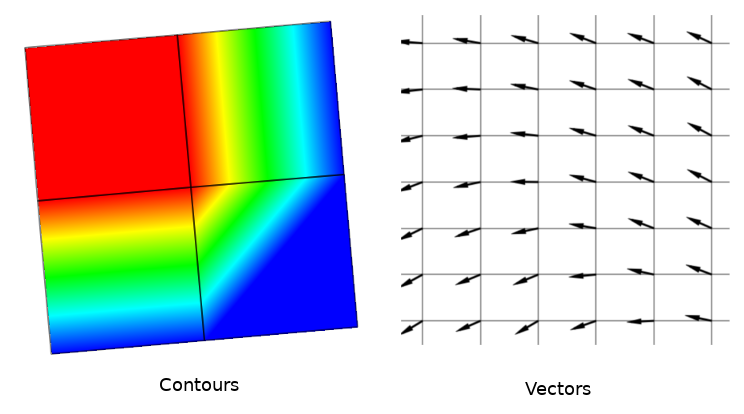
Exemples de visualisation de données maillées
Formats de données gérés
QGIS accède aux données maillées via les pilotes MDAL. Ainsi, les formats gérés nativement sont :
NetCDF: Format générique pour les données scientifiquesGRIB: Format utilisé couramment en météorologieXMDF: Par exemple, des sorties du modèle hydraulique TUFLOWDAT: Format de sortie de nombreux modèles d’hydrodynamique (par ex. BASEMENT, HYDRO_AS-2D, TUFLOW)3Di: Format du modèle 3Di basé sur les Conventions « Climate and Forecast » (http://cfconventions.org/)Quelques exemples de jeux de données maillés se trouvent ici : https://apps.ecmwf.int/datasets/data/interim-full-daily/levtype=sfc/
Charger une couche de maillage
Pour ajouter une couche de maillage à QGIS :
Open the dialog, either by selecting it from the menu or clicking the
 Open Data Source Manager button.
Press the … button to select the file and press Add. The layer will be added using the native mesh rendering.
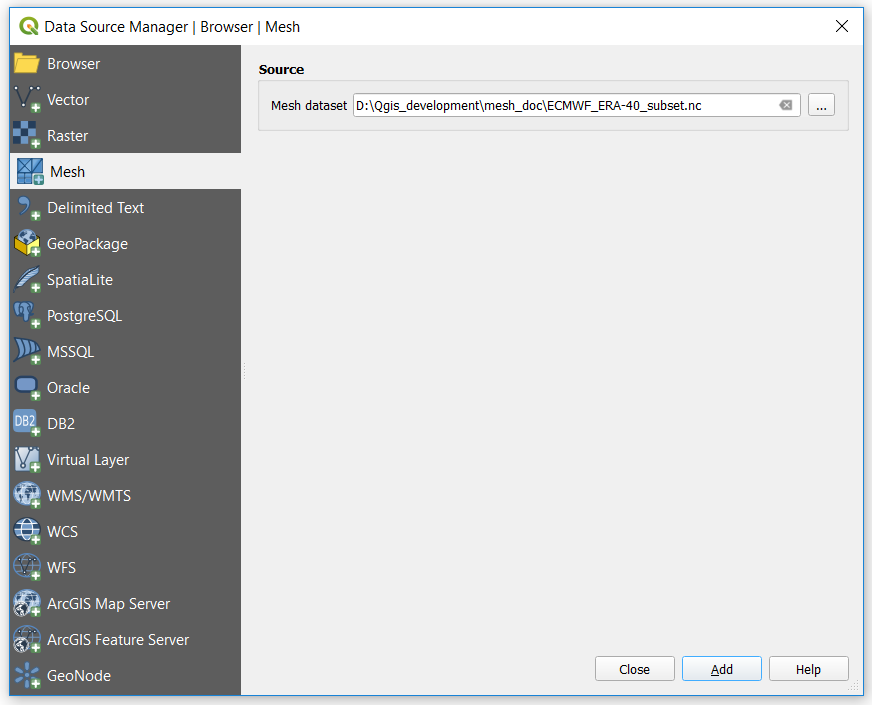
Mesh tab in Data Source Manager
Mesh Dataset Properties
Information
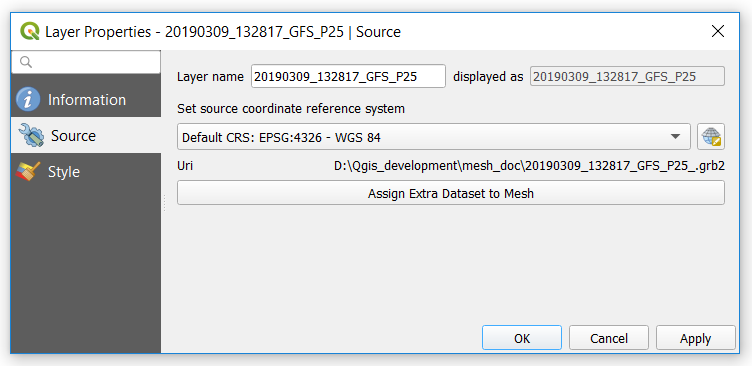
Mesh Layer Properties
The Information tab is read-only and represents an interesting place to quickly grab summarized information and metadata on the current layer. Provided information are (based on the provider of the layer) uri, vertex count, face count and dataset groups count.
Source
The Source tab displays basic information about the selected mesh, including:
the Layer name to display in the Layers panel
setting the Coordinate Reference System: Displays the layer’s Coordinate Reference System (CRS) as a PROJ.4 string. You can change the layer’s CRS by selecting a recently used one in the drop-down list or clicking on
 Select CRS button (see Sélectionneur de système de coordonnées de référence).
Use this process only if the CRS applied to the layer is wrong or
if none was applied.
Use the Assign Extra Dataset to Mesh button to add more groups to the current mesh layer.
Style
Click the  Style button to activate the dialog
as shown in the following image:
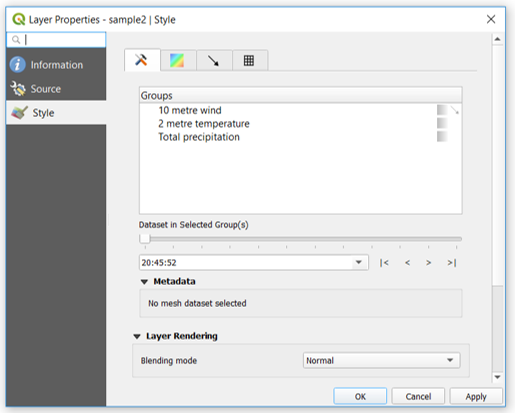
Mesh Layer Style
Style properties are divided in several tabs:
General
The tab  presents the following items:
groups available in the mesh dataset
dataset in the selected group(s), for example, if the layer has a temporal dimension
metadata if available
blending mode available for the selected dataset.
The slider  , combo box
  and
and  buttons
allow to explore another dimension of the data, if available.
As the slider moves, the metadata is presented accordingly.
See the figure Mesh groups below as an example.
The map canvas will display the selected dataset group as well.
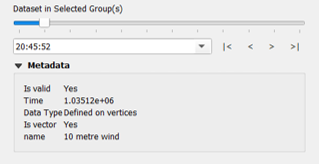
Dataset in Selected Group(s)
You can apply symbology to each group using the tabs.
Contours Symbology
Under Groups, click on  to show contours with
default visualization parameters.
In the tab  you can see and change the current visualization options of contours
for the selected group, as shown in the image Styling contours in a mesh below:
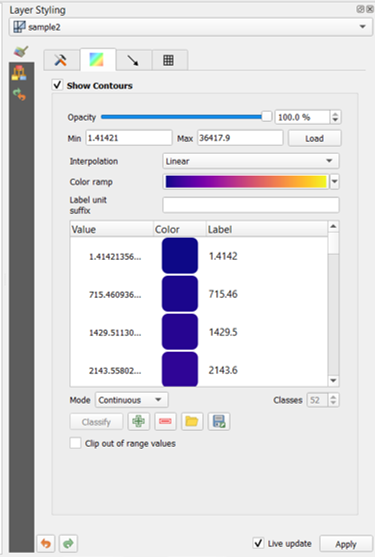
Styling Contours in a Mesh Layer
Use the slide bar or combo box to set the opacity of the current group.
Use Load to adjust the min and max values of the current group.
The Interpolation list contains three options to render contours: Linear, Discrete and Exact.
The Color ramp widget opens the color ramp drop-down shortcut.
The Label unit suffix is a label added after the value in the legend.
By selecting Continuous in the classification Mode, QGIS creates classes automatically considering the Min and Max values. With ‘Equal interval’, you only need to select the number of classes using the combo box Classes and press the button Classify.
The button  Add values manually adds a value
to the individual color table. The button
  Remove selected row
deletes a value from the individual color table. Double clicking on the value column
lets you insert a specific value. Double clicking on the color column opens the dialog
Change color, where you can select a color to apply on that value.
Vectors Symbology
In the tab  , click on
  to display vectors if available.
The map canvas will display the vectors in the selected group with default parameters.
Click on the tab
  to change the visualization parameters for vectors as shown in the image below:
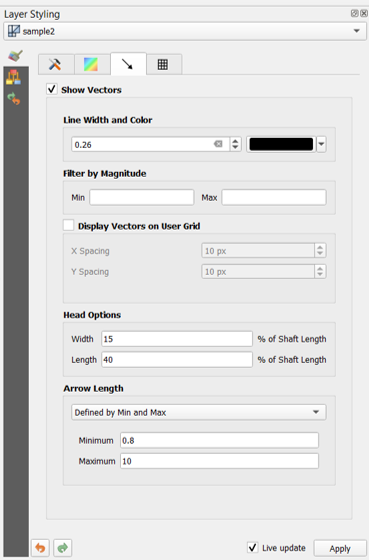
Styling Vectors in a Mesh Layer
The line width can be set using the combo box or typing the value. The color widget opens the dialog Change color, where you can select a color to apply to vectors.
Enter values for Min and Max to filter vectors according to their magnitude.
Check on the box  Display Vectors on User Grid and specify
the X spacing and the Y spacing,
QGIS will render the vector considering the given spacing.
With the Head Options Head Options, QGIS allows the shape of the arrow head to be set by specifying width and length (in percentage).
Vector’s Arrow length can be rendered in QGIS in three different ways:
Defined by Min and Max: You specify the minimum and maximum length for the vectors, QGIS will adjust their visualization accordingly
Scale to magnitude: You specify the (multiplying) factor to use
Fixed: all the vectors are shown with the same length
Rendering
In the tab  , QGIS offers two possibilities to display the grid,
as shown in the image Mesh rendering:
Native Mesh Renderingthat shows quadrantsTriangular Mesh Renderingthat display triangles
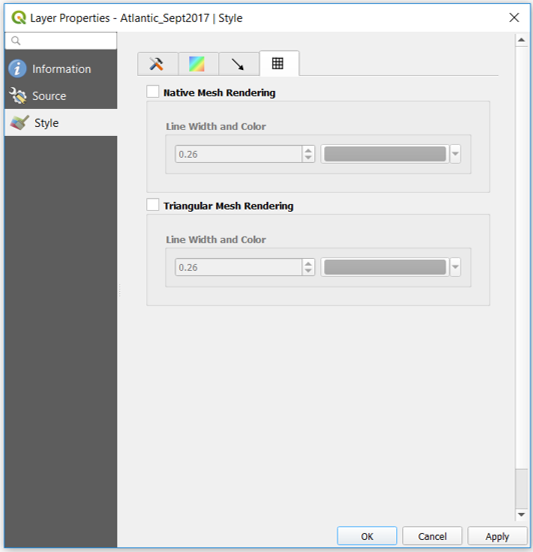
Mesh Rendering
The line width and color can be changed in this dialog, and both the grid renderings can be turned off.
