Créer un Rapport
Qu’est-ce?
Cette section va vous aider à mettre en place une génération automatique de rapports dans QGIS. Par définition, un rapport SIG est un document contenant des informations organisées dans des formulaires narratifs, graphiques, cartographiques ou tabulaires préparés selon les besoins ou pour sur une base périodique, récurrente, régulière ou au cas par cas. Les rapports peuvent se référer à des périodes spécifiques, des évènements, occurences ou à des sujets, emplacements différents. Ils peuvent servir de supports de communication écrits pour des publications ou des communications. Les rapports dans QGIS permettent aux utilisateurs d’extraire le contenu des SIG sous une forme simple et rapide.
Se lancer
L’onglet Reports est une extension de l’outil de mise en page. Cette fonctionalité peut être trouvée sous ou à travers .
Dans la boîte de dialogue Gestionnaire de mise en page, le rapport peut être créé sous Nouveau depuis un modèle et sélectionner l’option du menu déroulant Rapport vide et cliquer sur le bouton Créer…
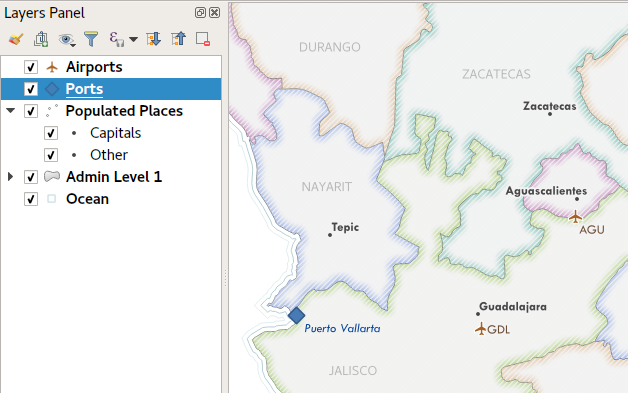
Pour cet exemple, nous utilisons les limites administratives, endroits peuplés, ports et aéroports du jeu de données Natural Earth.
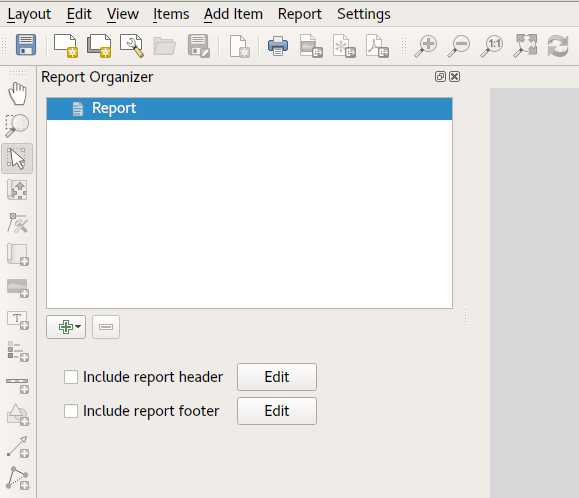
En utilisant la commande , créer un rapport vide. Au début, il n’y a pas beaucoup de choses à voir. La boîte de dialogue ressemble fortement au composeur de mises en pages, à l’exception du nouveau panneau Editeur de rapport sur la gauche :
Espace de travail de mise en page du rapport
QGIS reports can consist of multiple, nested sections. In our new blank report we initially have only the main report section. The only options present for this report section is Include report header or Include report footer. If we enable these options, the header will be included as the very first page (or pages… — individual parts of reports can be multi-page if desired) in the report, and the footer would be the last page. Let’s go ahead and enable the header, and hit the Edit button next to it:
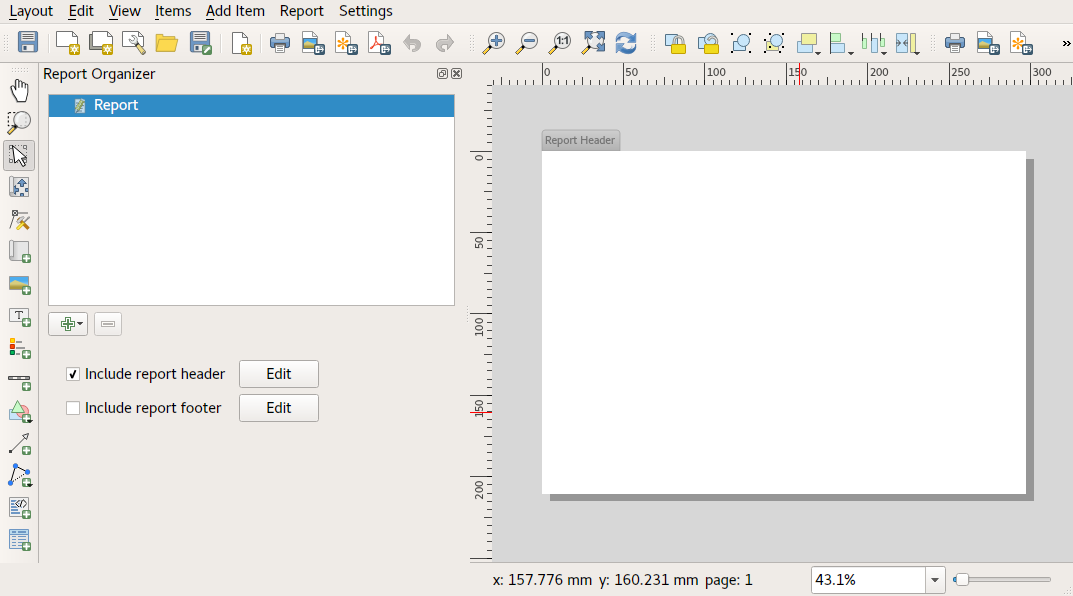
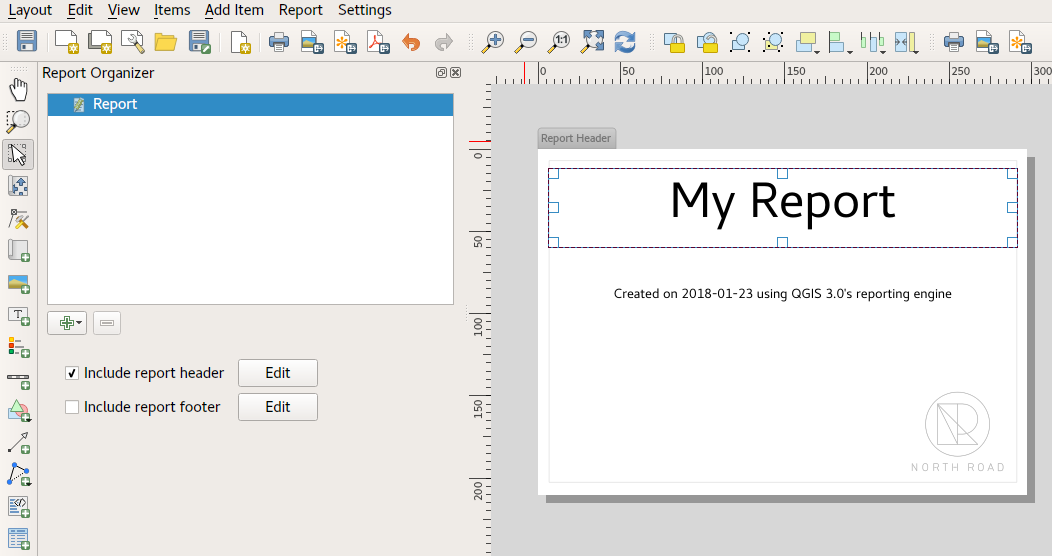
A few things happen as a result. Firstly, an edit pencil is now shown next to the Report section in the Report Organizer, indicating that the report section is currently being edited in the designer. We also see a new blank page shown in the designer itself, with the small Report Header title. In QGIS reports, every component of the report is made up of individual layouts. They can be created and modified using the exact same tools as are available for standard print layouts – so you can use any desired combination of labels, pictures, maps, tables, etc. Let’s add some items to our report header to demonstrate:
We’ll also create a simple footer for the report, by checking the Include report footer option and hitting Edit.
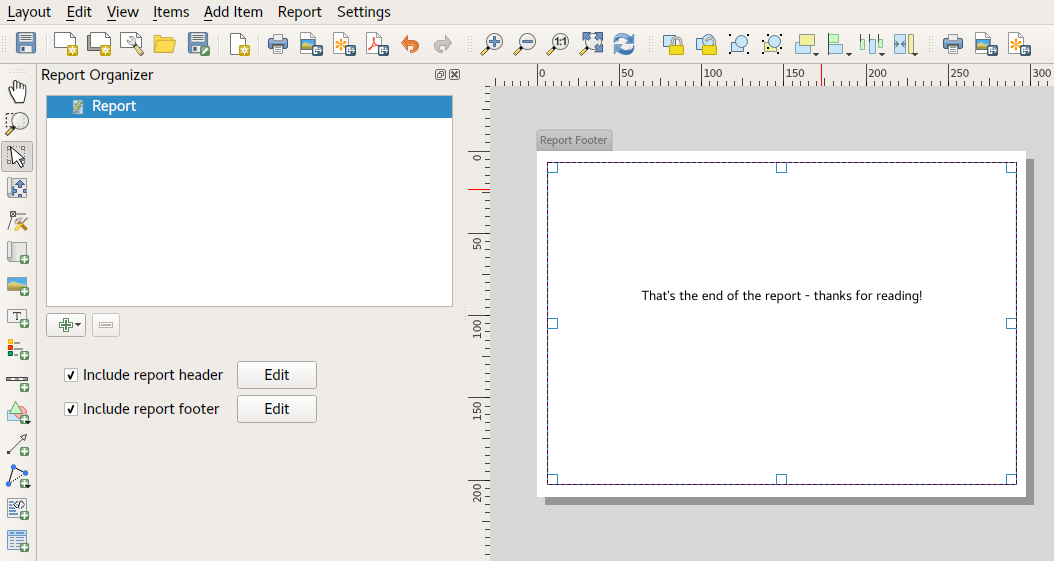
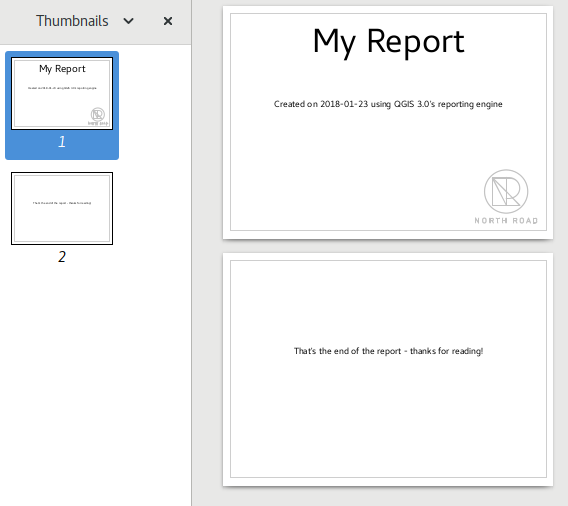
Before proceeding further, let’s export this report and see what we get. Exporting is done from the Report menu – in this case we select Export Report as PDF to render the whole report to a PDF file. Here’s the not-very-impressive result – a two page PDF consisting of our header and footer:
Let’s make things more interesting. By hitting the  Add Static Layout Section
button in the Report Organizer, we’re given a choice of new sections
to add to our report.
Add Static Layout Section
button in the Report Organizer, we’re given a choice of new sections
to add to our report.
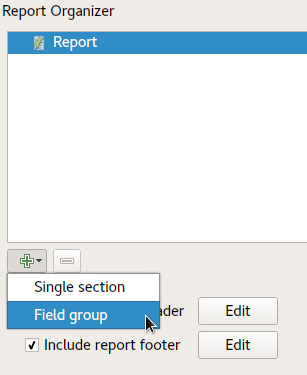
There are two options: Add Static Layout Section and a Field Group Section. The Add Static Layout Section is a single, static body layout. This can be used to embed static layouts mid-way through a report. Alternatively, a Field Group Section repeats its body layout for every feature in a layer. The features are sorted by the selected grouping feature (with an option for ascending/descending sort). If a field group section has child sections (e.g. another field group section with a different field, then only features with unique values for the group feature are iterated over. This allows nested reports with different information.
For now we’ll add a Field Group to our report. At its most basic level, you can think of a Field Group Section as the equivalent of a print atlas. You select a layer to iterate over, and the report will insert a section for each feature found. Selecting the new Field Group Section reveals a number of new related settings:
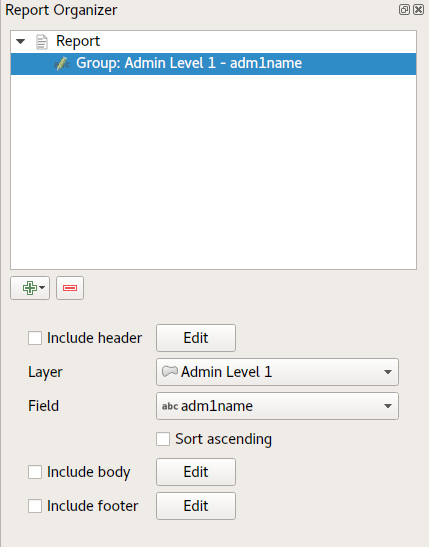
In this case we’ve setup our Field Group so that we iterate over all the states from the Admin Level 1 layer, using the values from the adm1name field. The same options for header and footer are present, together with a new option to include a body for this section. We’ll do that, and edit the body:
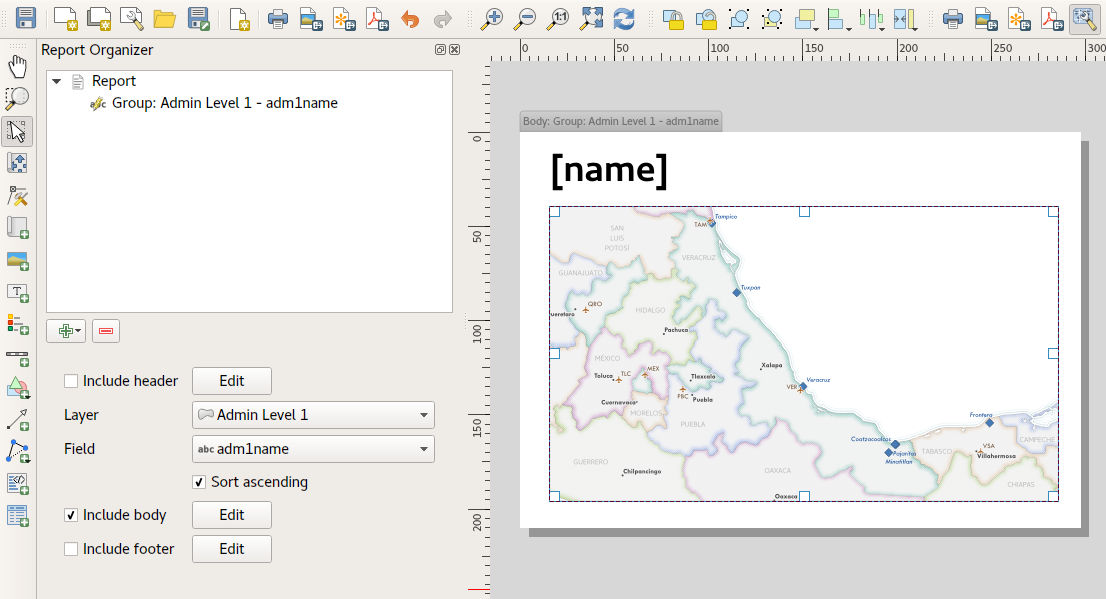
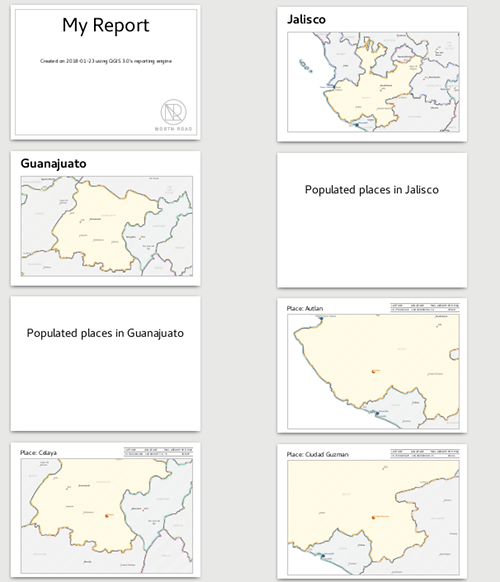
We’ve setup this body with a map (set to follow the current report feature – just like how a map item in an atlas can follow the current atlas feature), and a label showing the state’s name. If we went ahead and exported our report now, we’d get something like this:
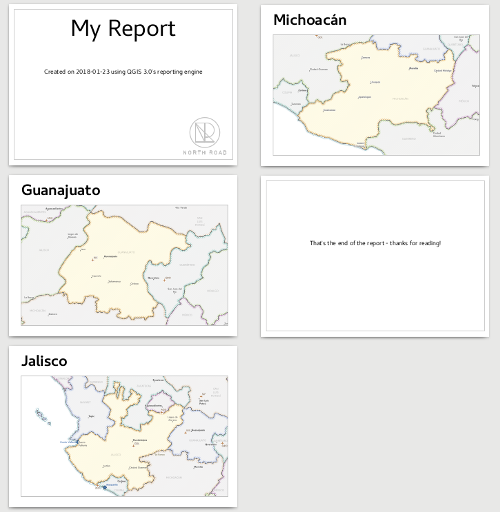
First, the report header, then a page for each state, and finally the report
footer. So more or less an atlas, but with a header and footer page. Let’s make
things more interesting by adding a subsection to our state group. We do this by
first selecting the state field group in the organizer, then hitting the
Field Group Section button and adding a new Field Group Section:
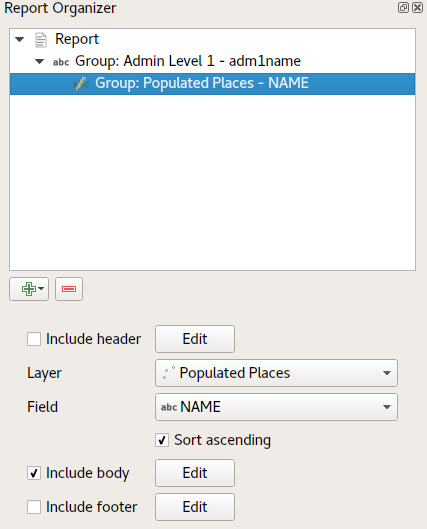
When a Field Group Section is iterating over its features, it will automatically filter these features to match the feature attributes from its parent groups. In this case, the subsection we added will iterate over a Populated Places layer, including a body section for each place encountered. The magic here is that the Populated Places layer has an attribute named adm1name, tagging each place with the state it’s contained within (if you’re lucky your data will already be structured like this – if not, run the Processing Join Attributes by Location algorithm and create your own field). When we export this report, QGIS will grab the first state from the Admin Level 1 layer, and then iterate over all the Populated Places with a matching adm1name value. Here’s what we get:
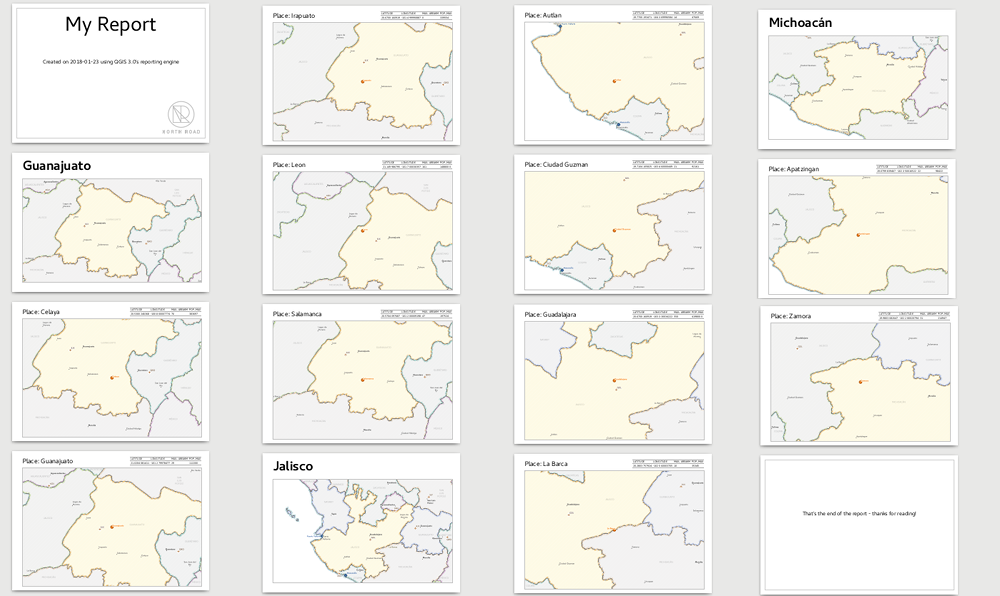
Here we created a basic body for the Populated Places group, including a map of the place and a table of some place attributes. So our report is now a report header, a page for each state followed by a page for every populated place within that state, and finally the report footer. If we were to add a header for the Populated Places group, it would be included just before listing the populated places for each state:
Similarly, a footer for the Populated Places group would be inserted after the final place for each state is included.
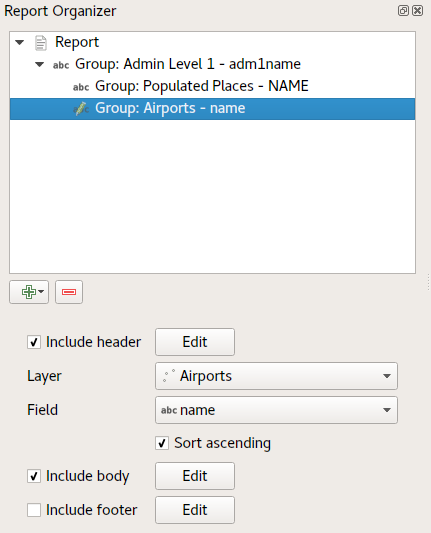
In addition to nested subsections, subsections in a report can also be included consecutively. If we add a second subsection to the Admin Level 1 group for Airports, then our report will first list ALL the populated places for each state, followed by all the airports within that state, before proceeding to the next state. In this case our report would be structured like this:
Report Output
The key point here is that our Airports group is a subsection of the Admin Level 1 group – not the Populated Places group. Here’s what our report could look like now:
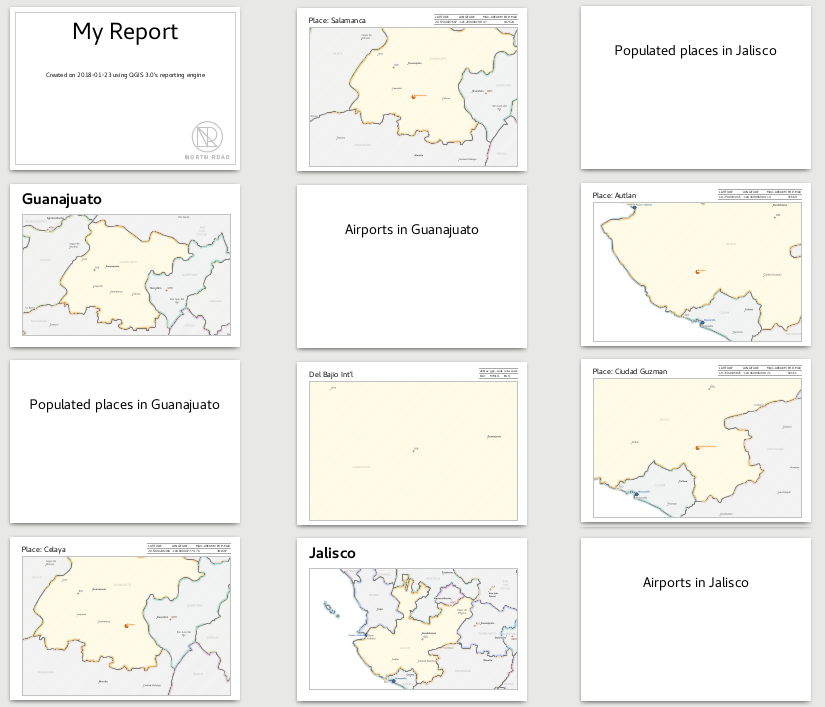
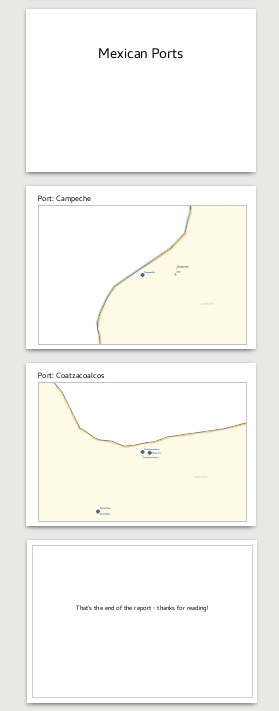
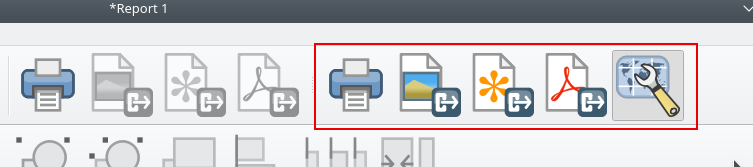
Combining nested and consecutive sections, together with section headers and footers allows for tons of flexibility. For instance, in the below report we add another field group as a child of the main report for the :guilabel`Ports` layer. Now, after listing the states together with their populated places and airports, we’ll get a summary list of all the ports in the region:
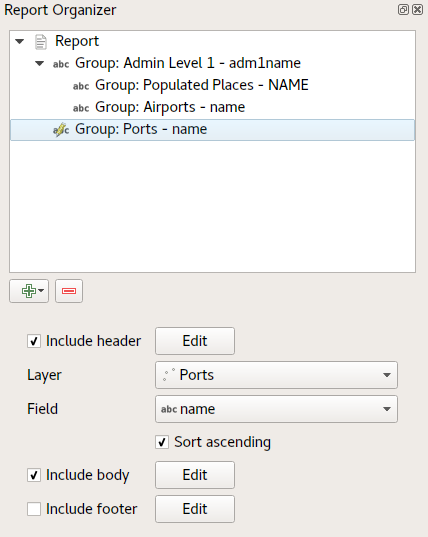
This results in the last part of our report exporting as:
Export settings
Whenever you export a report, there is a selection of export settings QGIS needs to check in order to return the most appropriate output. As you can start to imagine, reports in QGIS are extremely powerful and flexible!
Note
When you are exporting a report to the available formats please choose the options (Print, SVG, Image, PDF) that have the labels saying Export Report as… otherwise you will print the current active map.
The current information was adapted from the blog of North Road, Exploring Reports in QGIS 3.0 - the Ultimate Guide!