4.2. Lesson: Labels
Des étiquettes peuvent être ajoutées à une carte pour afficher de l’information sur un objet. N’importe quelle couche vecteur peut avoir des étiquettes qui lui sont associées. Le contenu de ces étiquettes repose sur les données attributaires de la couche.
Le but de ce cours: Appliquer des étiquettes utiles, jolies et lisibles à une couche.
4.2.1.  Follow Along: Utilisation d’étiquettes
First, ensure that the  button is visible in the GUI:
Go to the menu item
Ensure that the Label Toolbar item has a check mark next to it. If it doesn’t, click on the Label Toolbar item to activate it.
Click on the
placeslayer in the Layers panel so that it is highlightedClick on the
toolbar button to open the
Labels tab of the Layer Styling panelSwitch from No Labels to
Single LabelsYou’ll need to choose which field in the attributes will be used for the labels. In the previous lesson, you decided that the
namefield was the most suitable one for this purpose.Select
namefrom the Value list: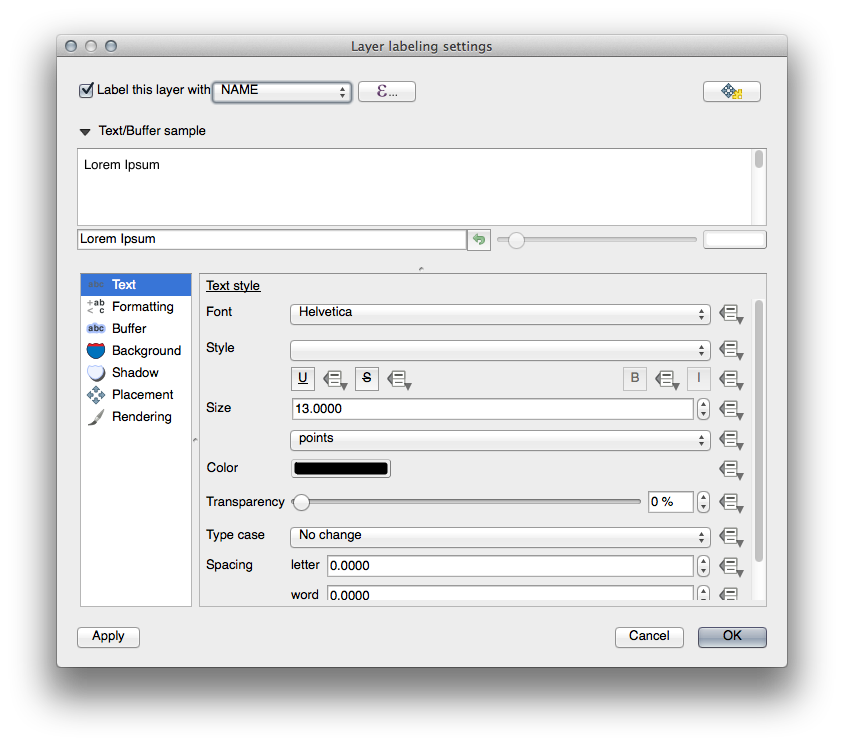
Click Apply
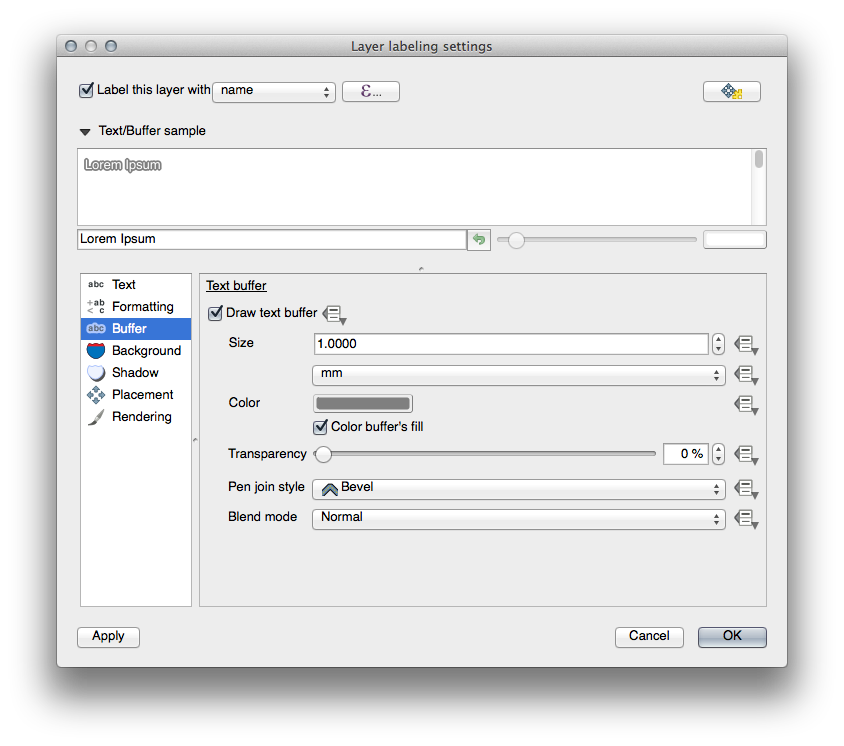
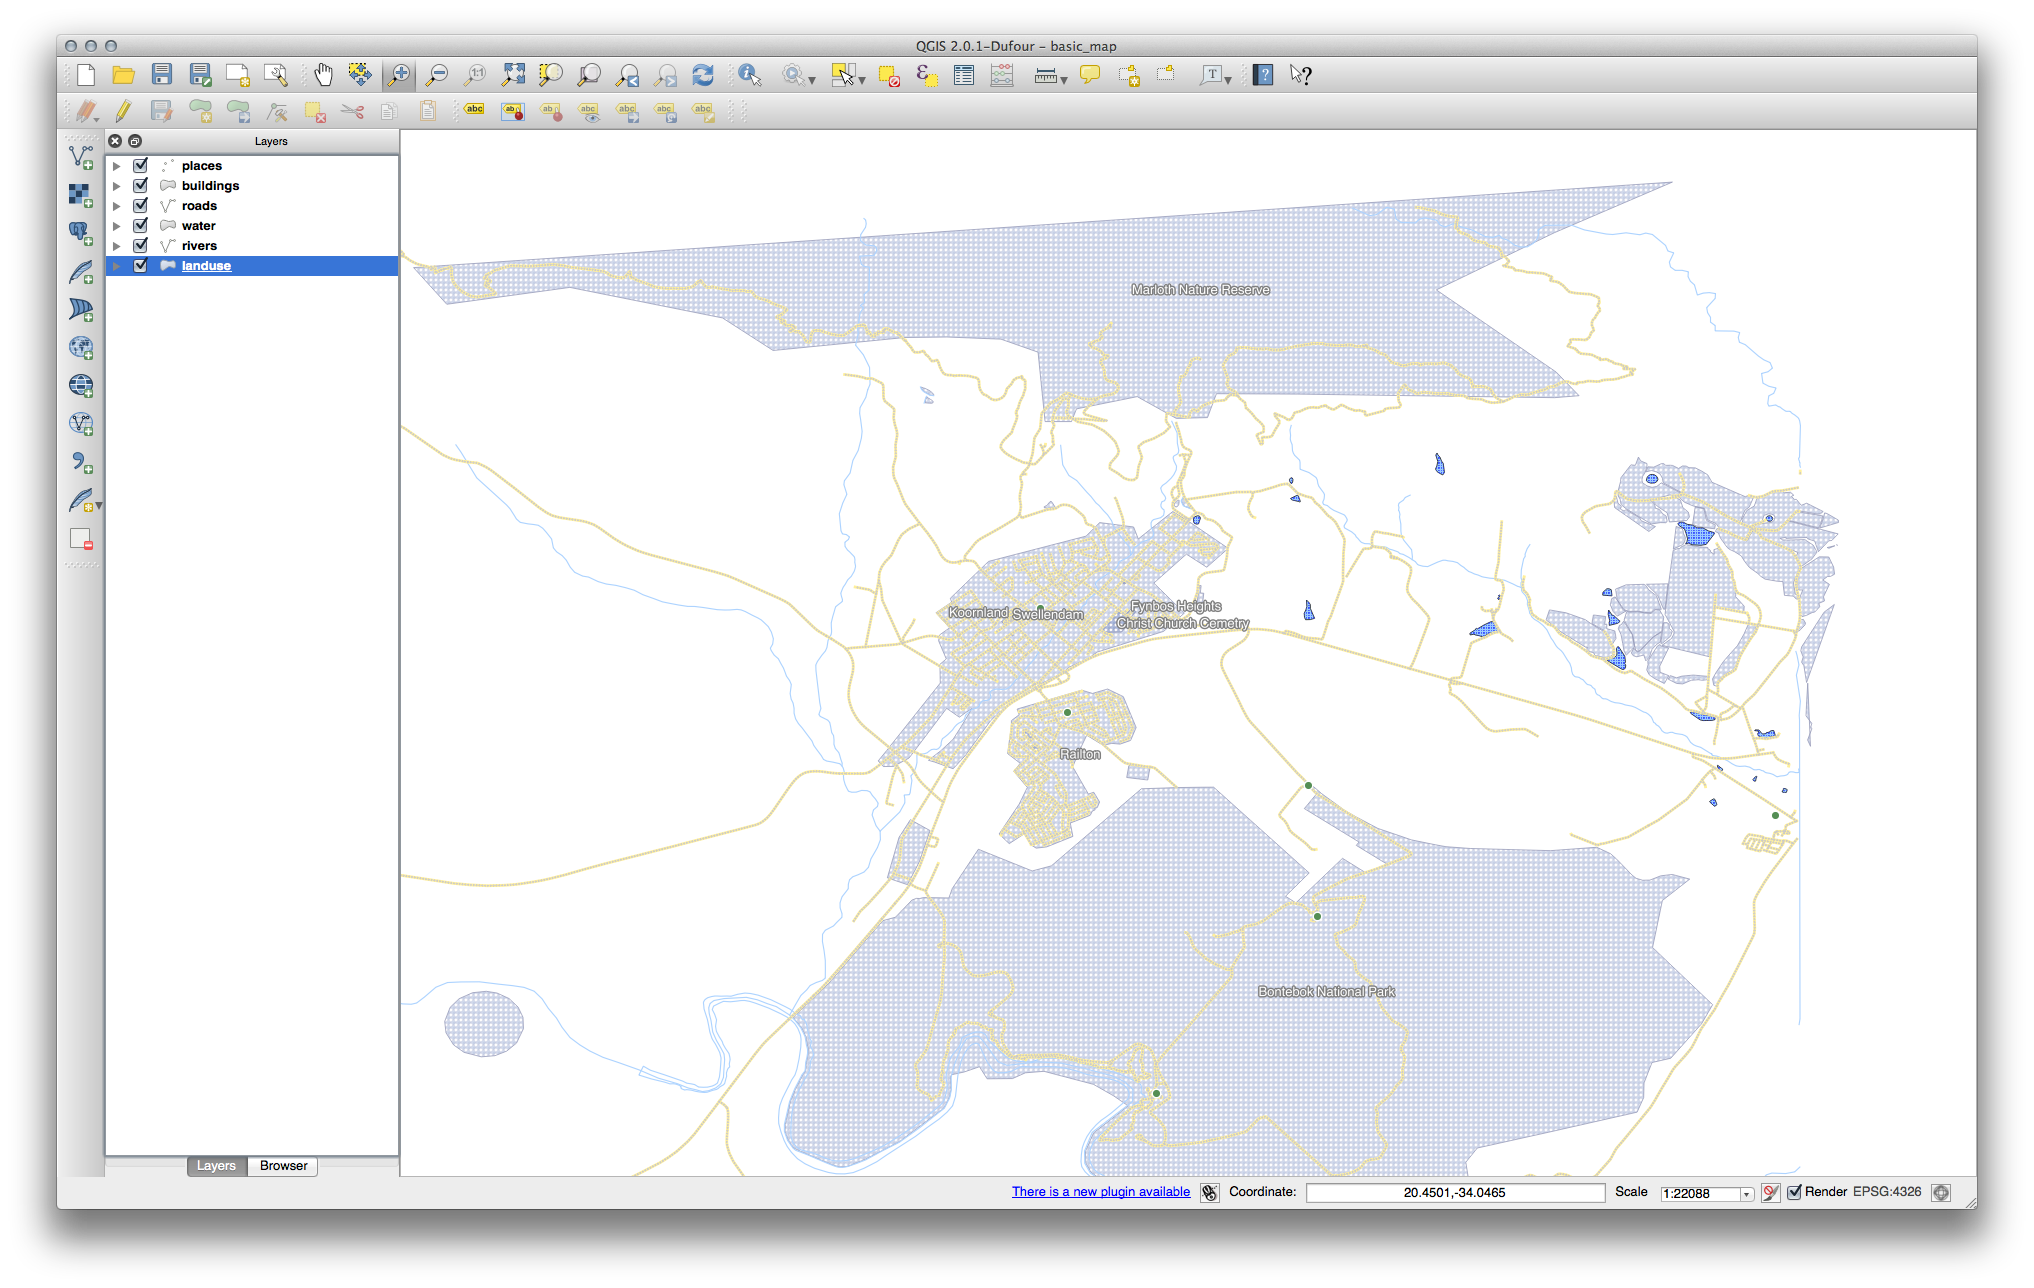
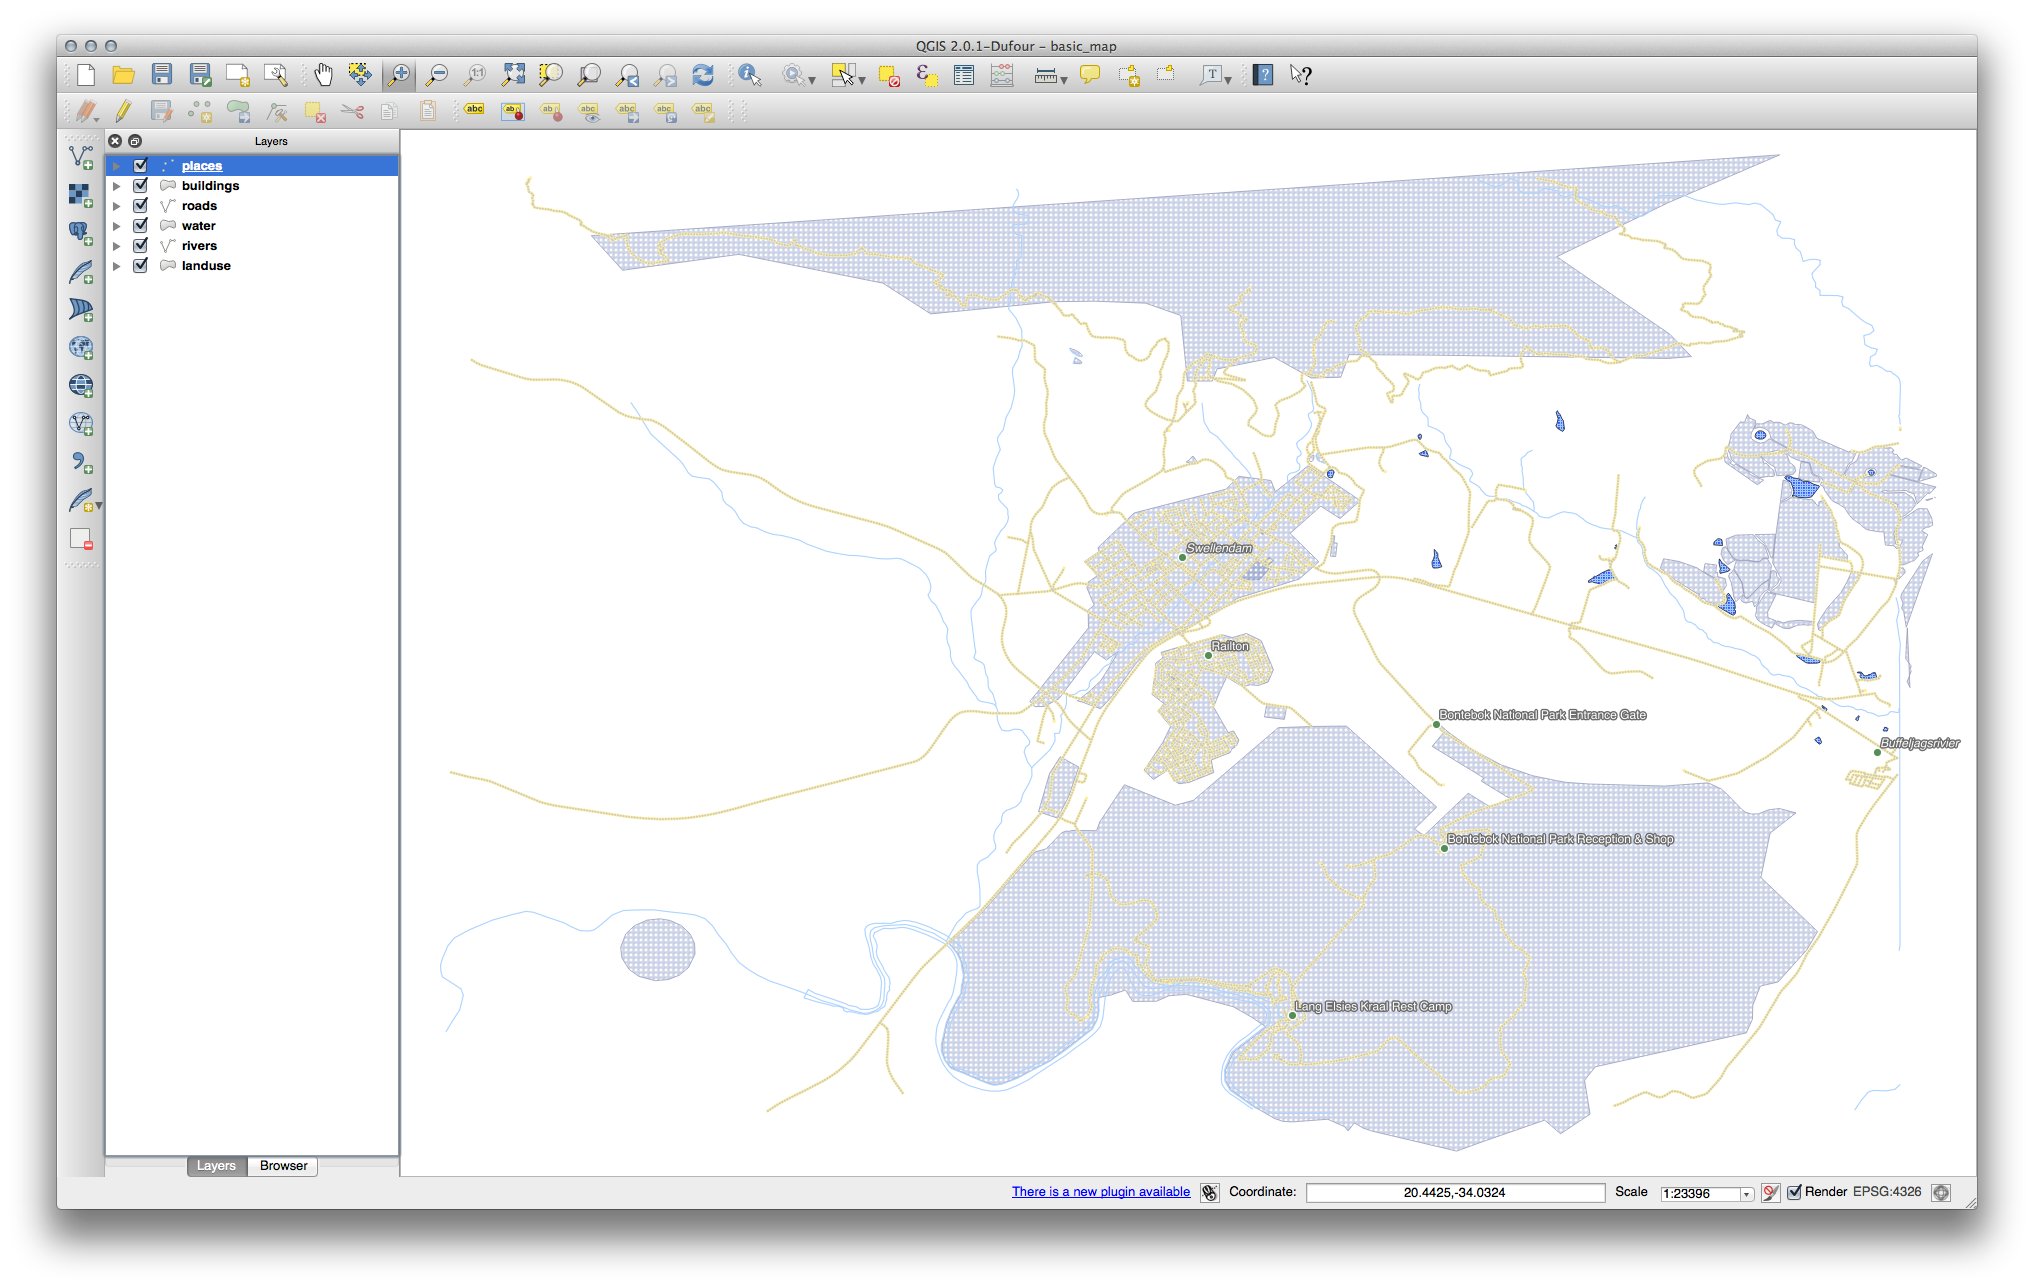
La carte devrait maintenant afficher des étiquettes comme ceci:
4.2.2. Follow Along: Modification des Options d’Étiquetage
Depending on the styles you chose for your map in earlier lessons, you might find that the labels are not appropriately formatted and either overlap or are too far away from their point markers.
Note
Above, you used the button in the
Label Toolbar to open the Layer Styling panel. As
with Symbology, the same label options are available via both
the Layer Styling panel and the Layer Properties
dialog. Here, you’ll use the Layer Properties dialog.
Open the Layer Properties dialog by double-clicking on the
placeslayerSelect the
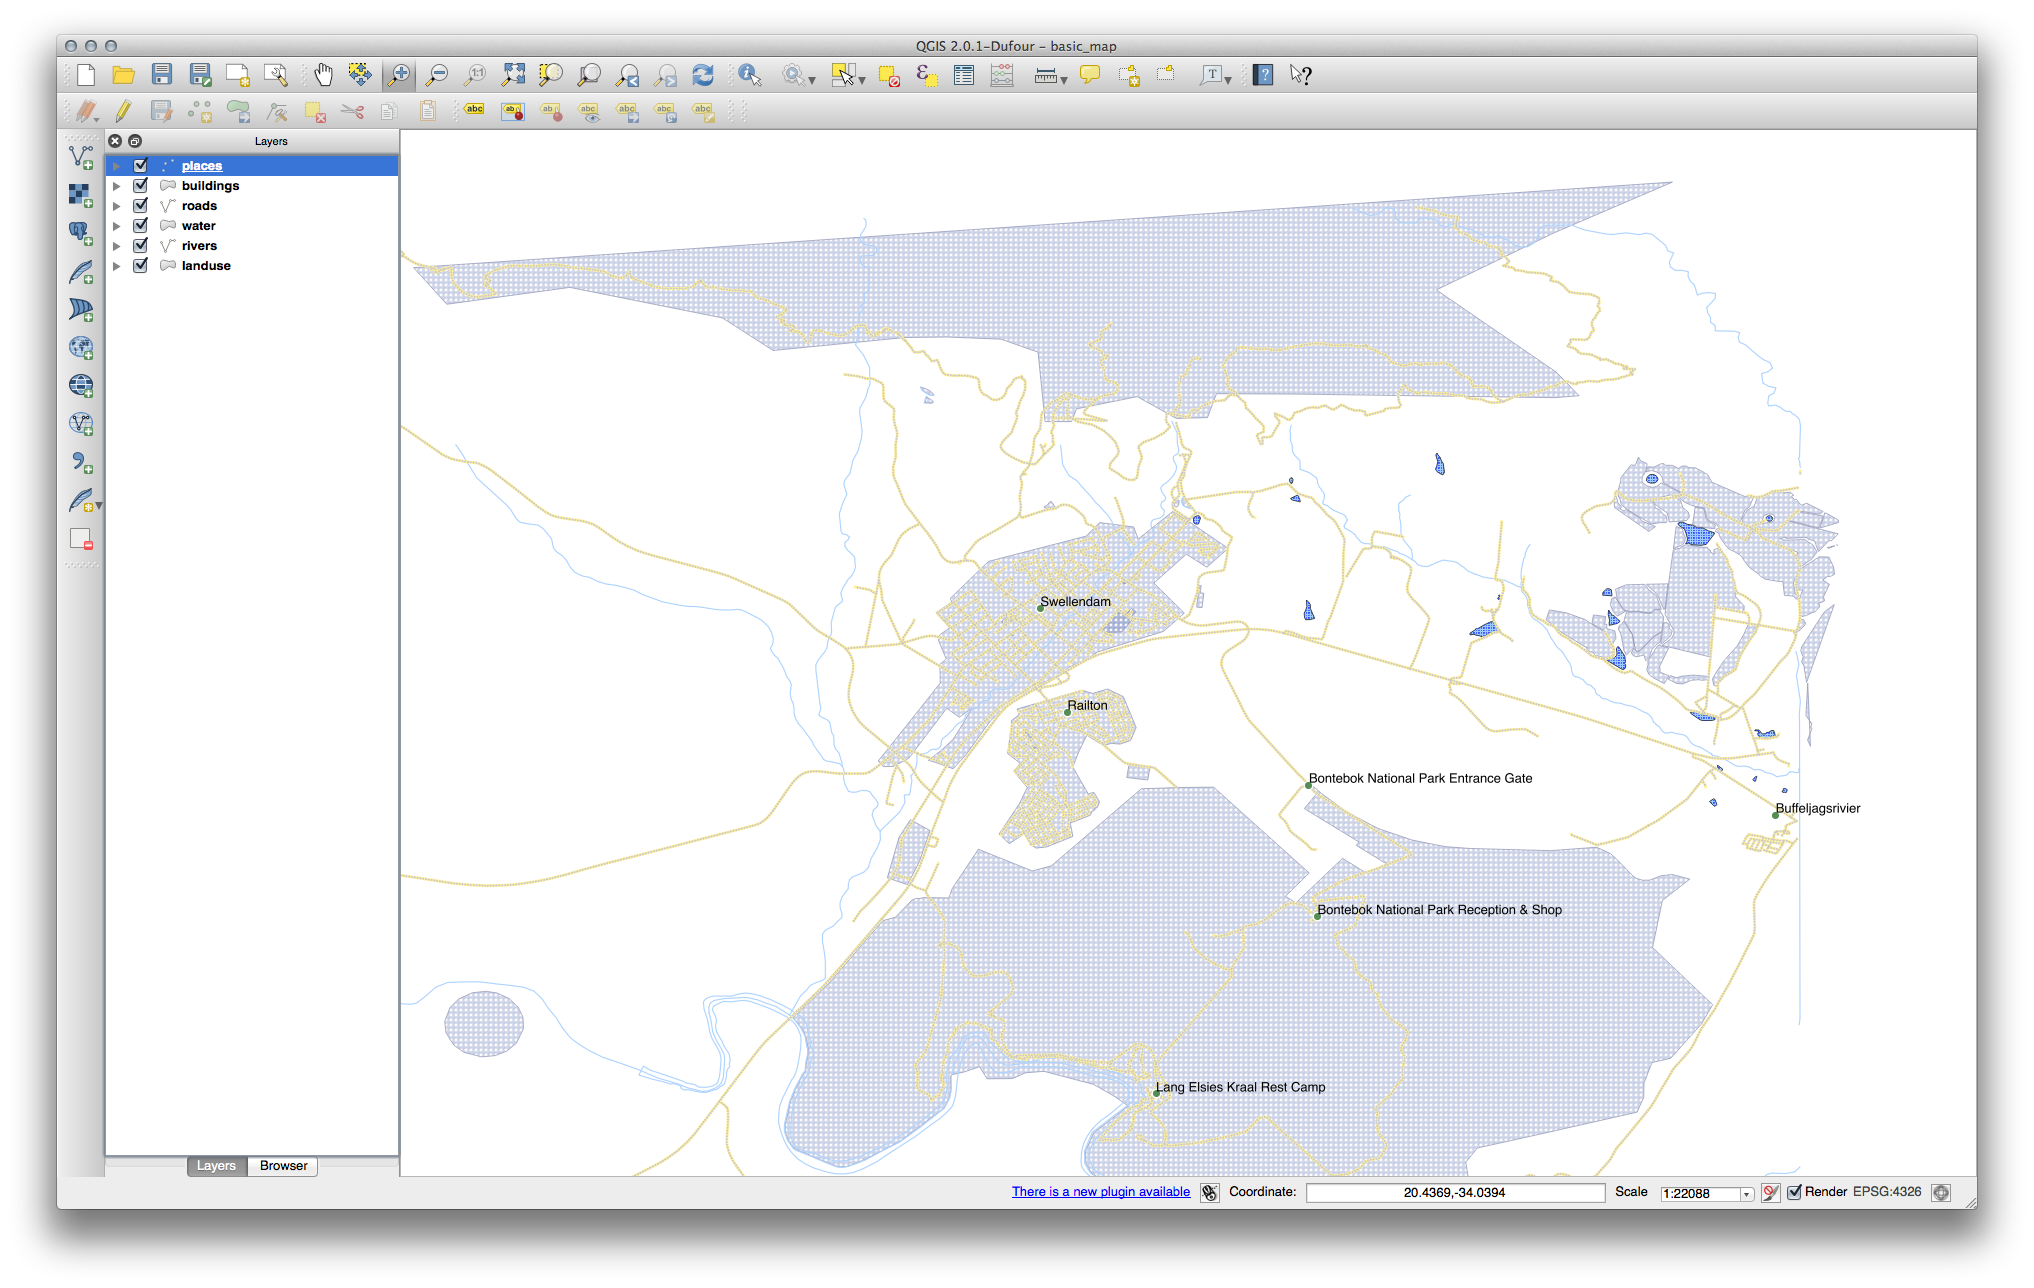
Labels tabAssurez-vous que Texte est sélectionné dans la liste d’options à gauche, puis mettez à jour les options de formattage de texte pour les faire correspondre à celles montrées ci-dessous:
Click Apply
That font may be larger and more familiar to users, but its readability is still dependent on what layers are rendered beneath it. To solve this, let’s take a look at the Buffer option.
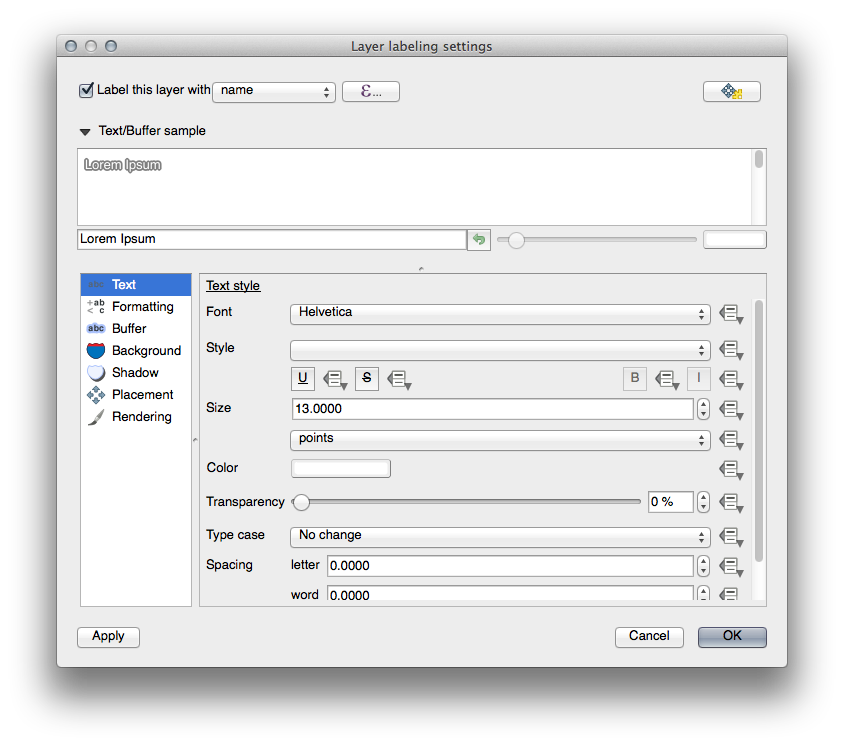
Select Buffer from the left-hand options list
Sélectionnez la case à cocher à côté de Affiche un tampon, puis choisissez les options qui correspondent aux suivantes:
Click Apply
Vous constaterez que cela ajoute une bordure ou un tampon coloré autour des étiquettes des places, les rendant plus faciles à repérer sur la carte:
Maintenant, nous pouvons aborder le positionnement des étiquettes par rapport à leurs points de repères.
Select Placement from the left-hand options list
Select Around point and change the value of Distance to
2.0Millimeters:
Click Apply
Vous verrez que les étiquettes ne chevauchent plus désormais les points.
4.2.3.  Follow Along: Utiliser des étiquettes à la place de symboles de couche
In many cases, the location of a point doesn’t need to be very specific. For
example, most of the points in the places layer refer to entire
towns or suburbs, and the specific point associated with such features is not
that specific on a large scale. In fact, giving a point that is too specific is
often confusing for someone reading a map.
Par exemple: sur une carte du monde, le point indiquant l’Union Européenne peut être quelque part en Pologne, par exemple. Pour quelqu’un qui lit la carte, voir un point marqué Union Européenne en Pologne peut sembler vouloir dire que la capitale de l’Union Européenne est donc en Pologne.
Aussi, pour prévenir ce genre d’incompréhension, il est souvent utile de désactiver les symboles de points et les remplacer complètement par les étiquettes.
Dans QGIS, vous pouvez faire ça en positionnant l’étiquette directement à la place du point auquel elle se réfère.
Open the
Labels tab of the
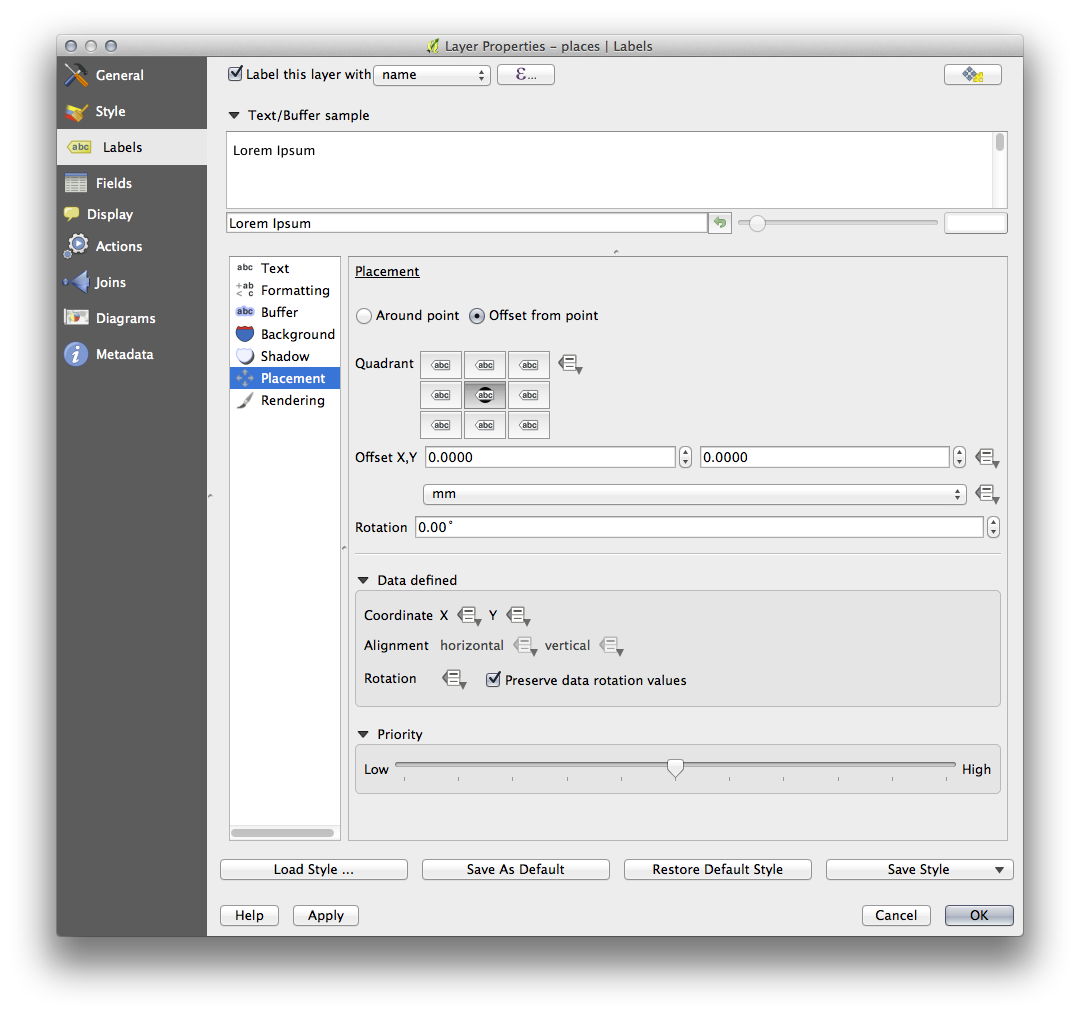
Layer Properties dialog for the placeslayerSelect the Placement option from the options list
Click on the Offset from point button
Ceci va révéler les options Quadrant que vous pourrez utiliser pour définir la position de l’étiquette par rapport au marqueur de point. Dans le cas-ci, nous souhaitons centrer l’étiquette sur le point donc choisissez le centre du quadrant:
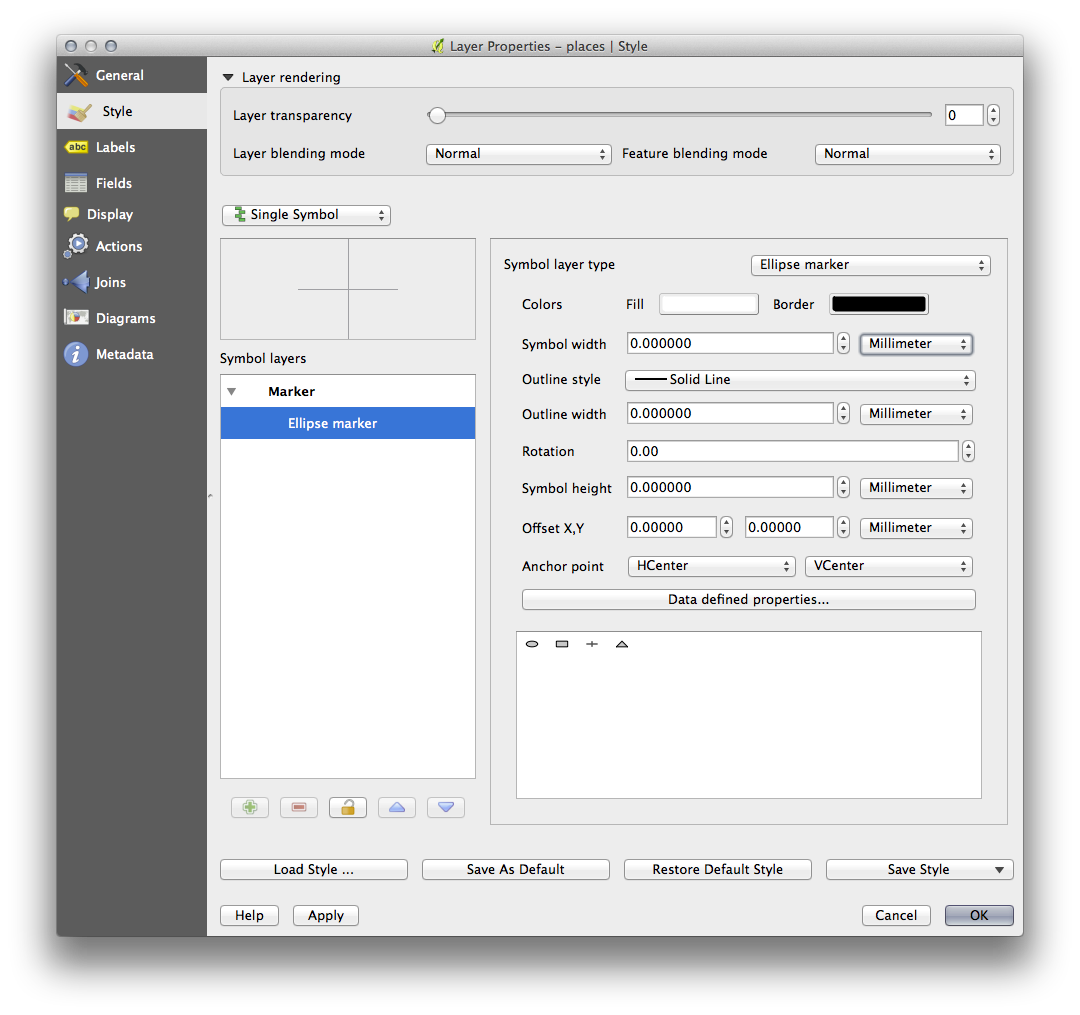
Hide the point symbols by editing the layer Symbology as usual, and setting the size of the Marker size to
0.0:
Click Apply and you’ll see this result:
If you were to zoom out on the map, you would see that some of the labels
disappear at larger scales to avoid overlapping. Sometimes this is what you
want when dealing with datasets that have many points, but at other times
you will lose useful information this way. There is another possibility for
handling cases like this, which we’ll cover in a later exercise in this lesson.
For now, zoom out and click on the  button in the toolbar
and see what happens.
button in the toolbar
and see what happens.
4.2.4. Try Yourself Personnaliser les étiquettes
Reset the label and symbol settings to have a point marker and a label offset of
2.0Millimeters.
Set the map to the scale
1:100000. You can do this by typing it into the Scale box in the Status Bar. Modify your labels to be suitable for viewing at this scale.
4.2.5. Follow Along: Étiquetage de Lignes
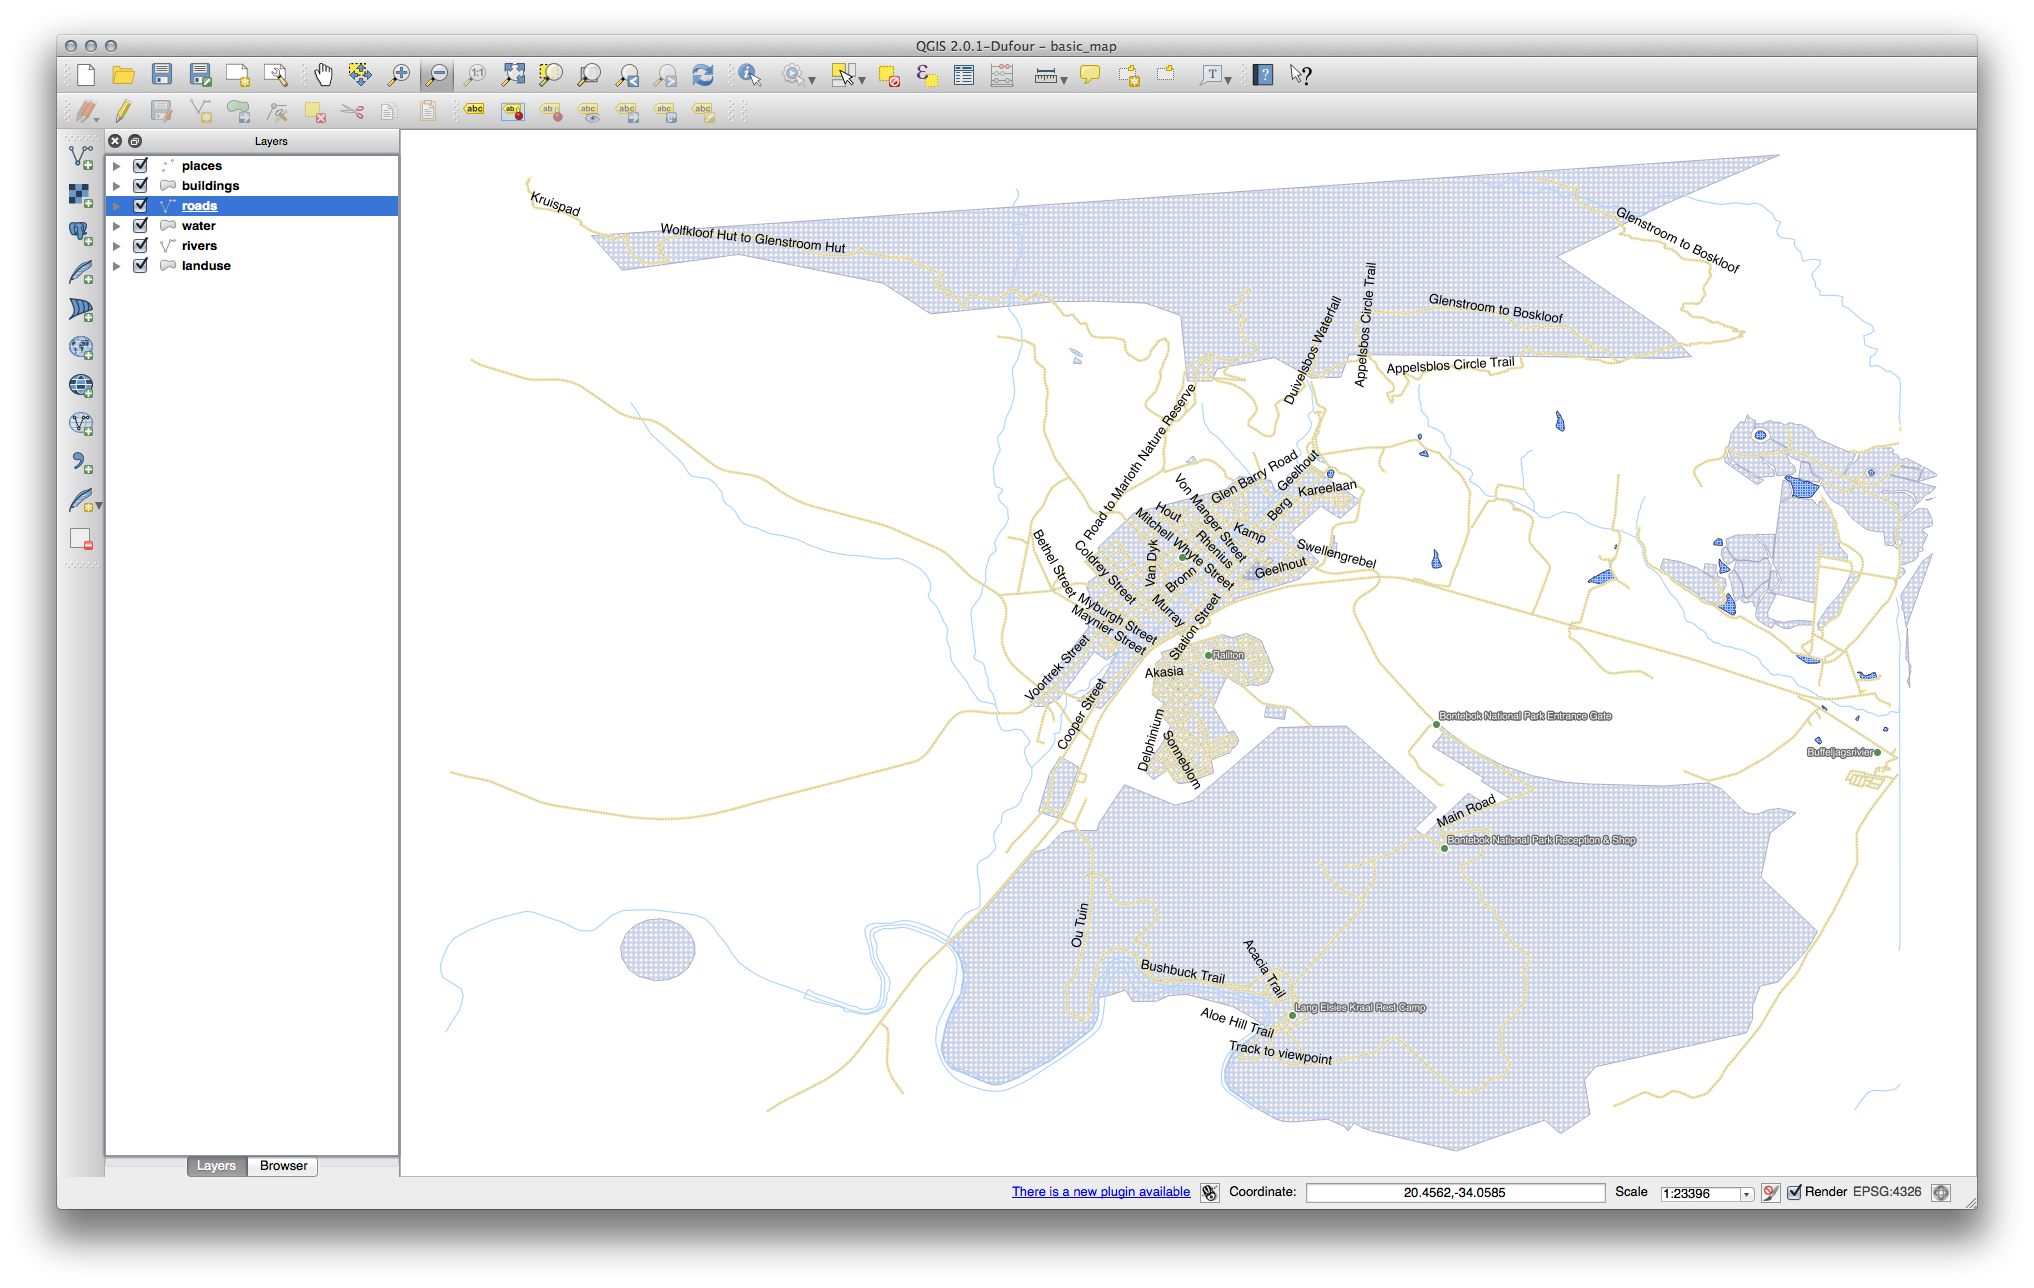
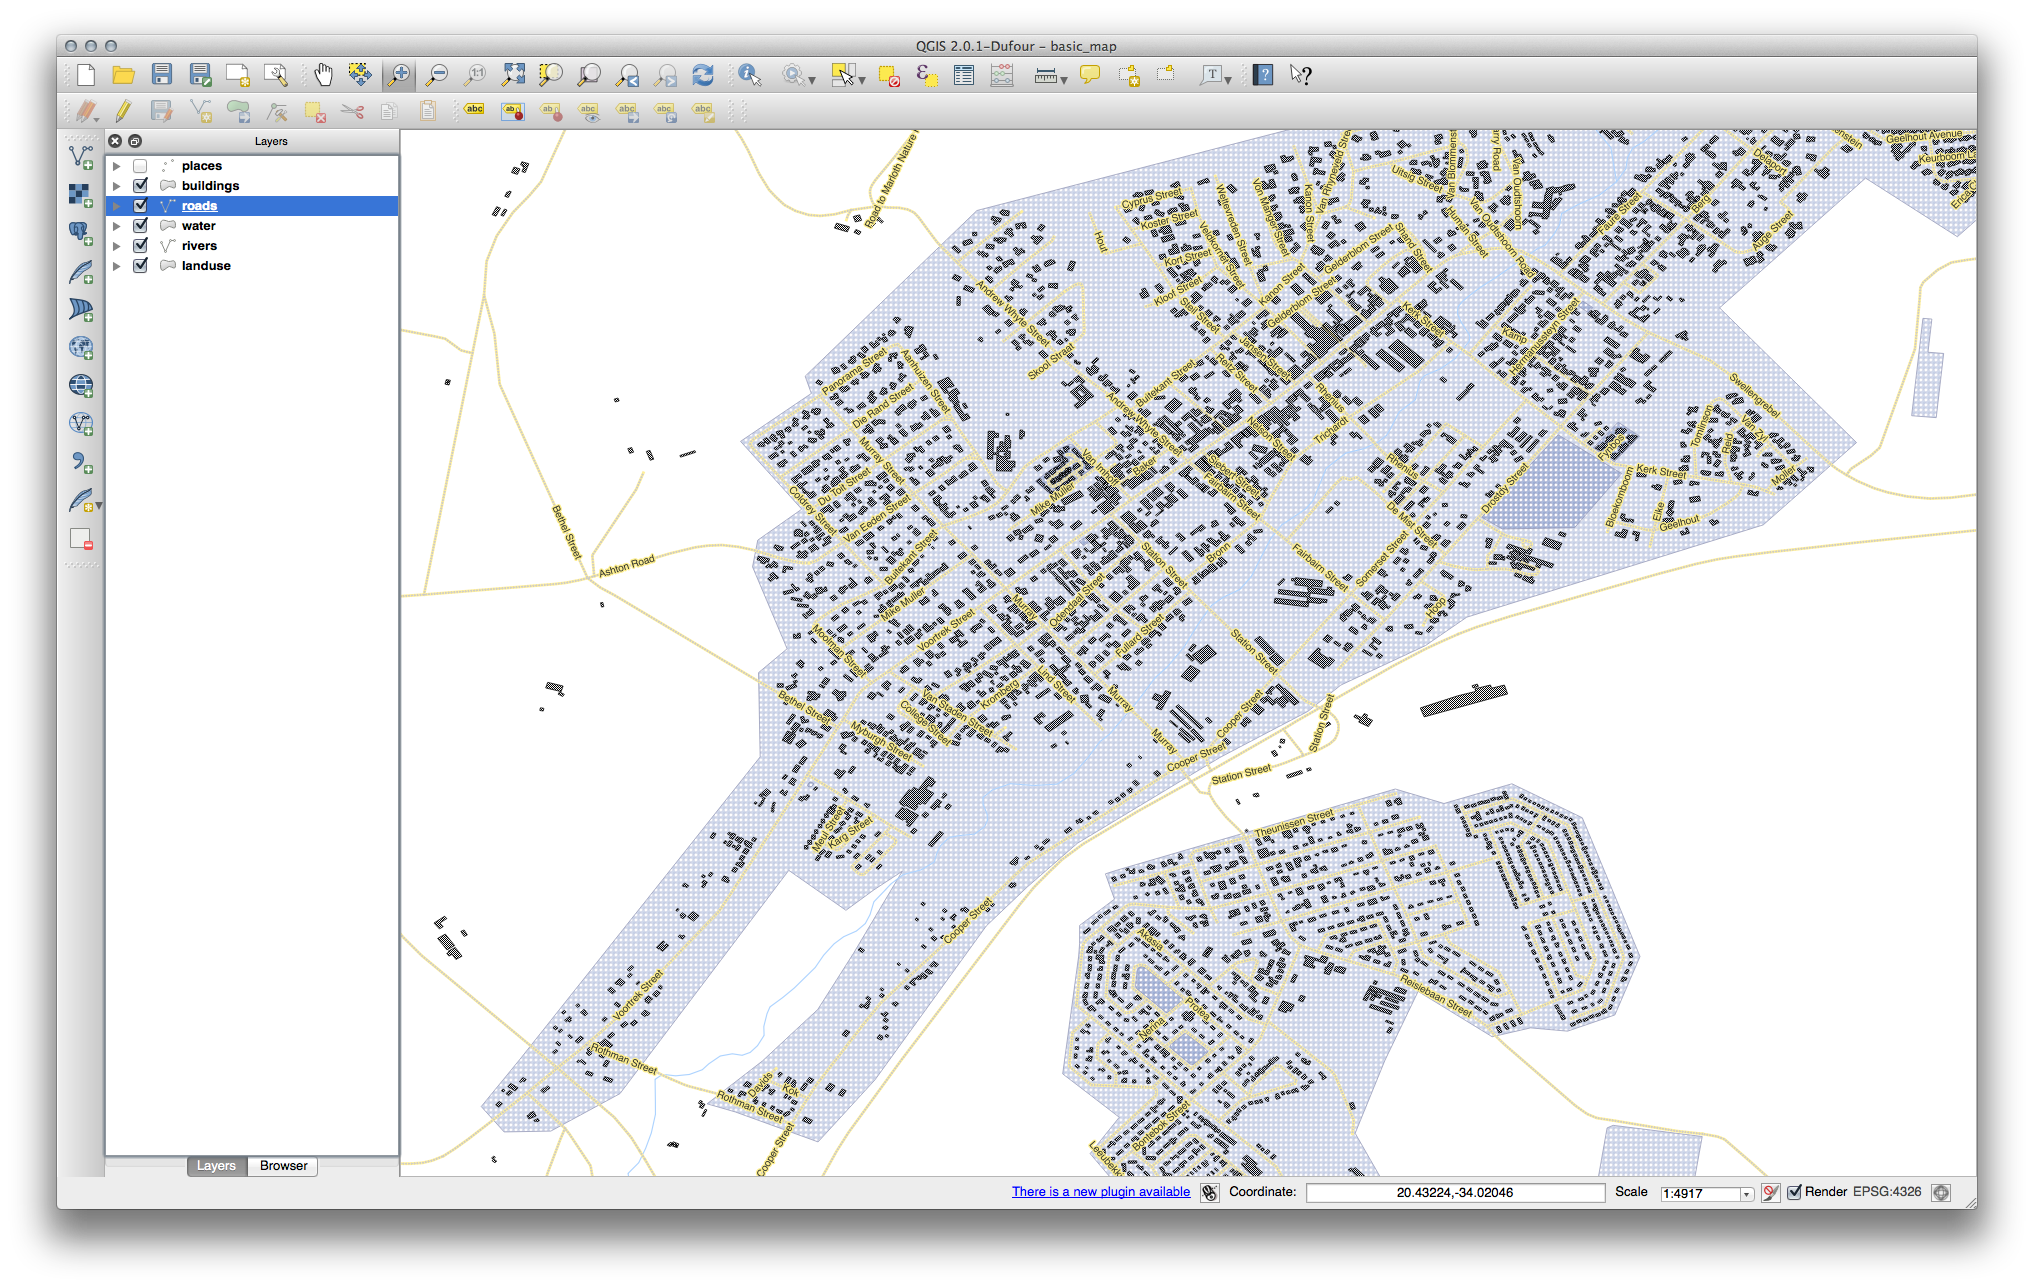
Maintenant que vous comprenez le fonctionnement de l’étiquetage, il y a un nouveau problème. Points et polygones sont faciles à étiqueter, mais qu’en est-il des lignes? Si vous les étiquetez de la même manière que les points, vos résultats devraient ressembler à quelque chose comme ceci:
We will now reformat the roads layer labels so that they are easy to
understand.
Hide the
placeslayer so that it doesn’t distract youActivate
Single Labels for the roadslayer as you did above forplacesSet the font Size to
10so that you can see more labelsZoom in on the Swellendam town area
In the Labels tab’s Placement tab, choose the following settings:

You’ll probably find that the text styling has used default values and the labels are consequently very hard to read. Update the Text to use a dark-grey or black Color and the Buffer to use a light-yellow Color.
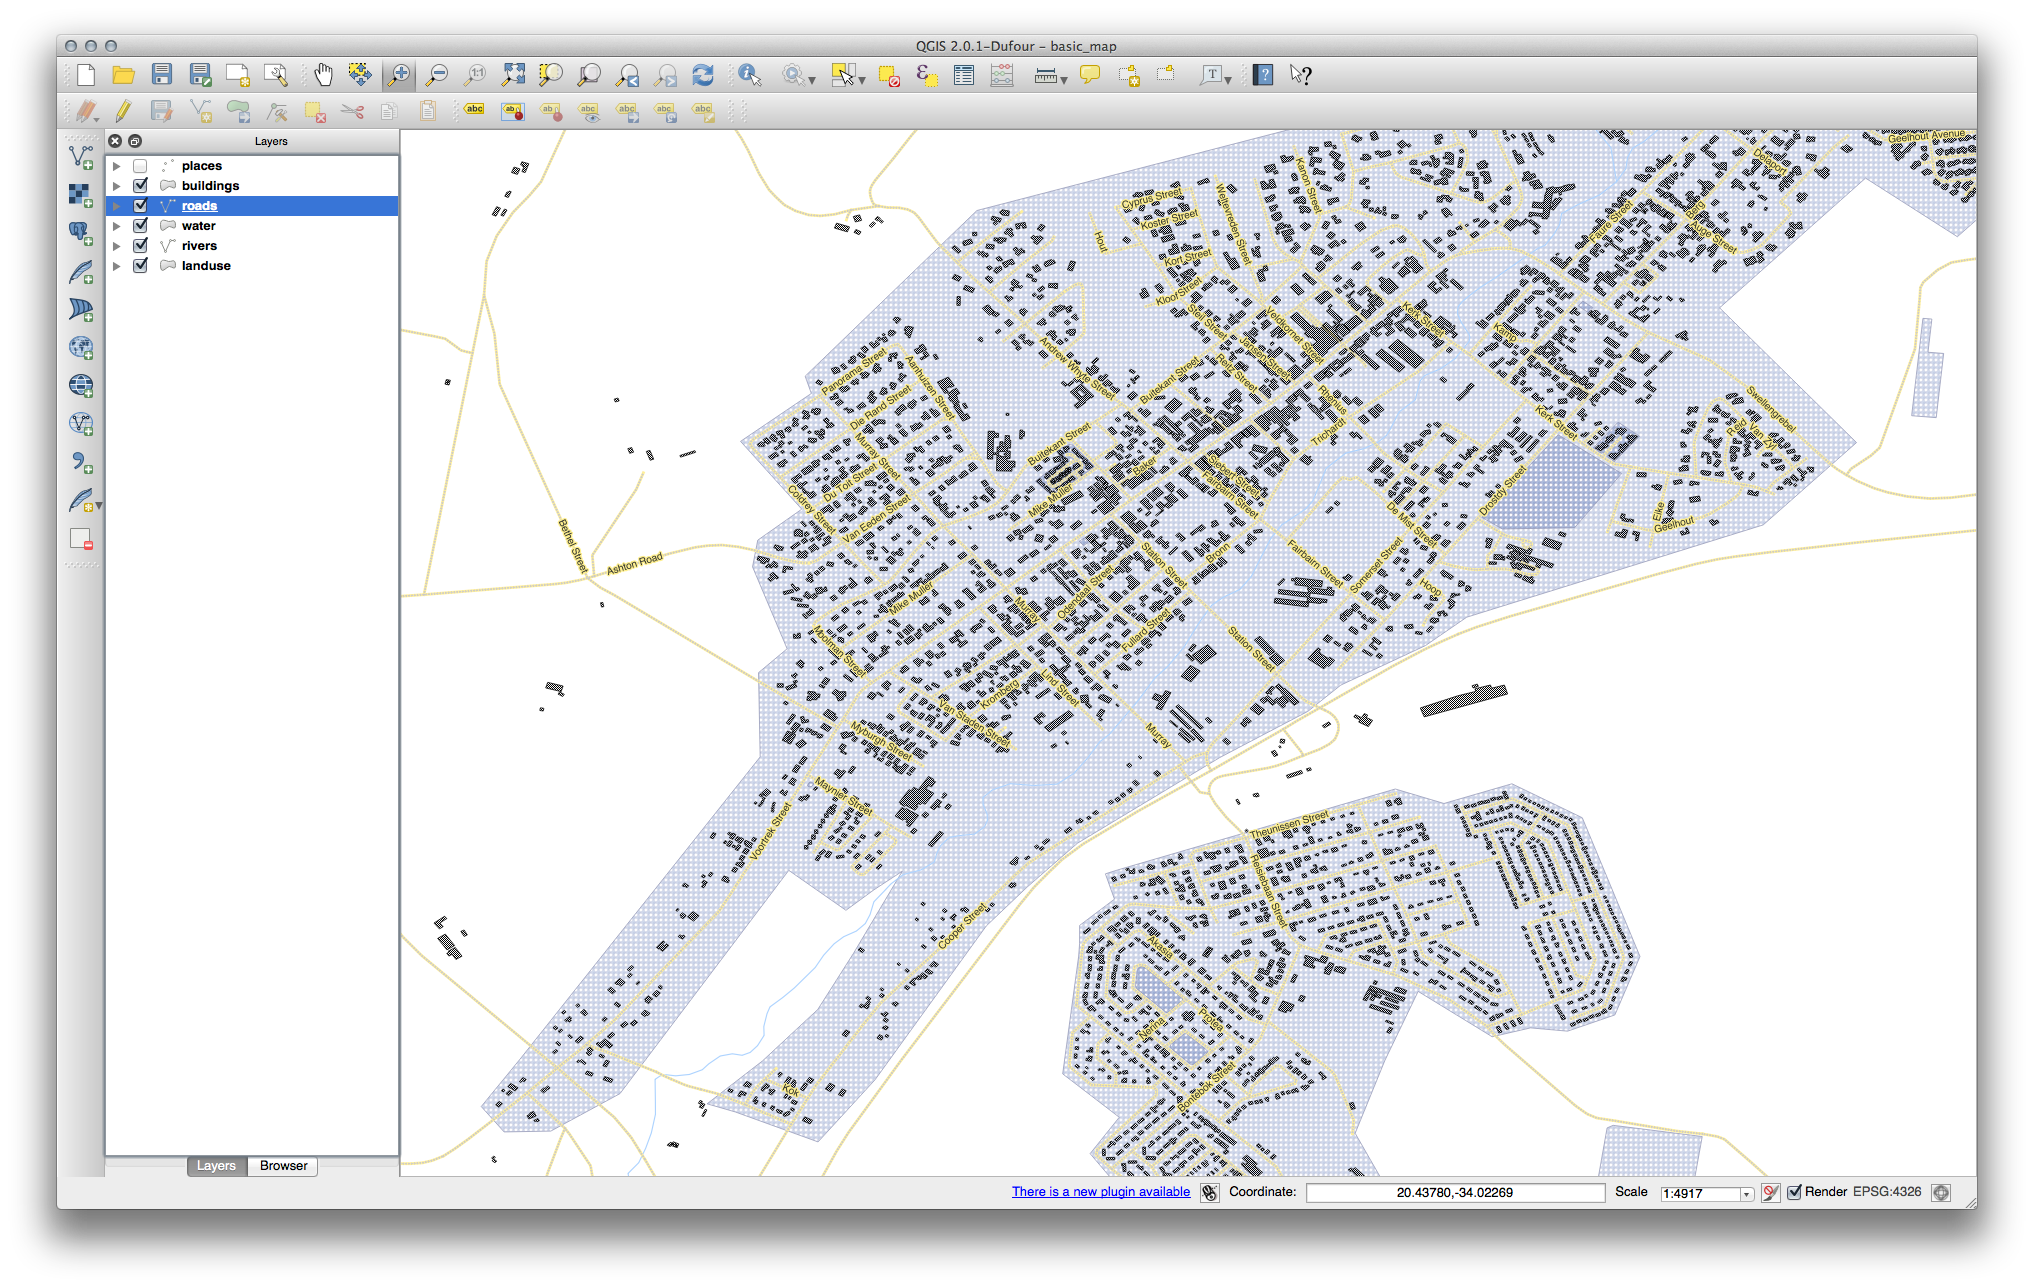
Selon l’échelle, la carte devrait ressembler à peu près à ceci:
Vous verrez que certains noms de voies apparaissent plus d’une fois sans que ce ne soit toujours nécessaire. Pour empêcher cela:
In the Labels tab of the Layer Properties dialog, choose the Rendering option and select Merge connected lines to avoid duplicate labels as shown:
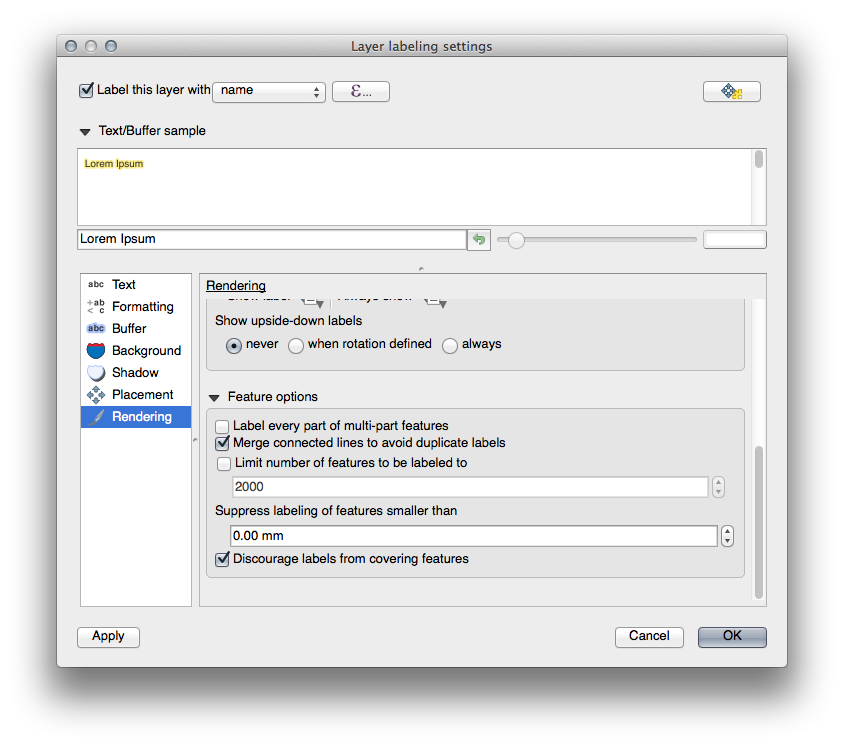
Cliquez sur OK.
Une autre fonction utile permet d’empêcher l’affichage des entités trop courtes pour être indiquées.
In the same Rendering panel, set the value of Suppress labeling of features smaller than … to
5.00 mmand note the results when you click ApplyTry out different Placement settings as well. As we’ve seen before, the Horizontal option is not a good idea in this case, so let’s try the Curved option instead.
Select the Curved option in the Placement panel of the Layers tab
Voici le résultat:
As you can see, this hides some labels that were previously visible, because of the difficulty of making some of them follow twisting street lines while still being legible. It makes other labels much more useful since they track the roads rather than float in space between them. You can decide which of these options to use, depending on what you think seems more useful or what looks better.
4.2.6.  Follow Along: Valeurs définies par des données
Deactivate labeling for the
roadslayerReactivate labeling for the
placeslayerOpen the attribute table for
placesvia the button
It has one field which is of interest to us now:
placewhich defines the type of urban area for each record. We can use this data to influence the label styles.Navigate to the Text panel in the
placesLabels panelClick the
 button next to the Italic text button beneath
Style and select to open the
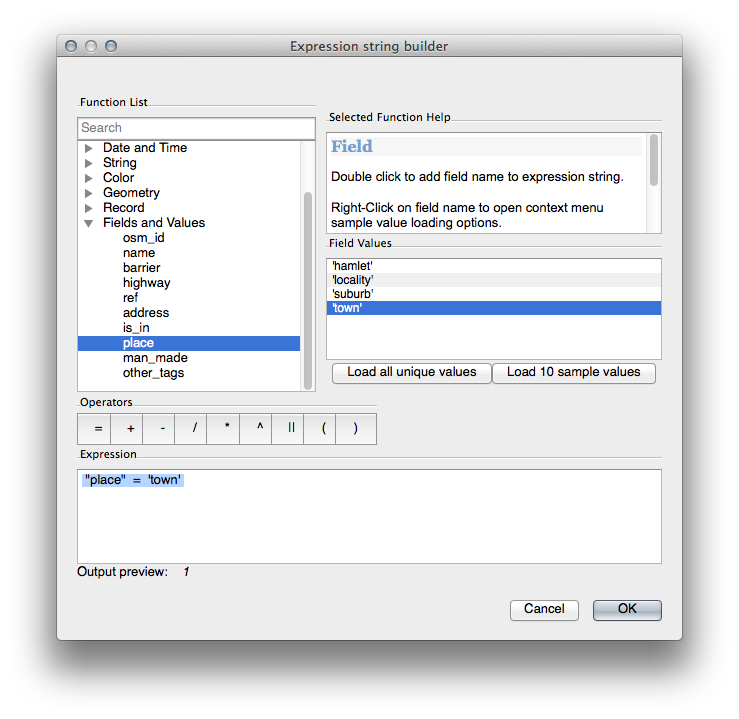
Expression String Builder:
button next to the Italic text button beneath
Style and select to open the
Expression String Builder: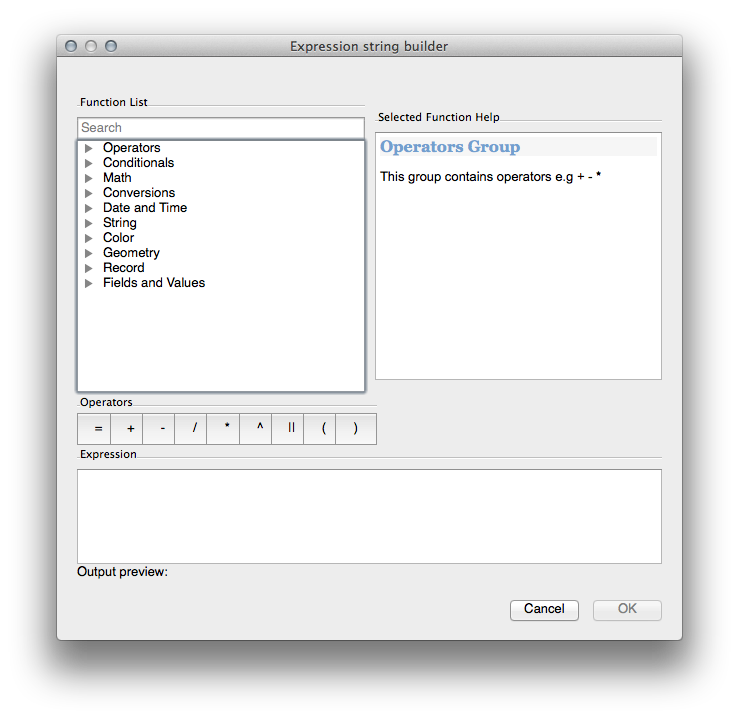
Under , double click on
placeand then click All Unique. This will list all unique values of theplacefield of this layer. Add a=in the text editor and then double click ontown.Alternatively, you can type:
"place" = 'town'directly in the text editor.Click OK twice:
Notice that the labels for all places whose place
field matches town are displayed in italics.
4.2.7. Try Yourself Utiliser les Valeurs définies par des données
Note
Nous allons aller un peu plus loin ici pour vous présenter quelques paramètres avancés d’étiquetage. A ce niveau avancé, nous assumons que vous avez suffisamment de connaissances sur le sujet pour comprendre ce qui va suivre. Si ce n’est pas le cas, quittez cette section et revenez plus tard lorsque vous aurez étudiez les pré-requis.
Open the Attribute Table for
placesEnter edit mode by clicking the
 button
Add a new column with the
 button
Configurez-le comme ceci:
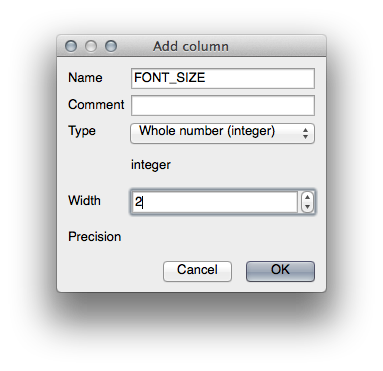
Use this to set custom font sizes for each different type of place (each key in the
placefield)
4.2.8. Possibilités Avancées de l’étiquetage
We can’t cover every option in this course, but be aware that the Label tab has many other useful functions. You can set scale-based rendering, alter the rendering priority for labels in a layer, and set every label option using layer attributes. You can even set the rotation, XY position, and other properties of a label (if you have attribute fields allocated for the purpose), then edit these properties using the tools adjacent to the main Layer Labeling Options button:


(Ces outils seront actifs tant que les champs requis existent dans la table d’attributs et que vous êtes en mode édition.)
N’hésitez pas à explorer les diverses possibilités offertes par le système d’étiquetage.
4.2.9. In Conclusion
Vous avez appris comment utiliser les attributs d’une couche pour créer des étiquettes dynamiques. Cela peut rendre votre carte plus informative et plus élégante.
4.2.10. What’s Next?
Maintenant que vous savez comment les attributs peuvent apporter une différence visuelle à votre carte, que diriez-vous de les utiliser pour changer la symbologie des objets eux-mêmes ? C’est l’objet de la leçon suivante!