18.33. Utilisation de scripts R avec Processing
Module contributed by Matteo Ghetta - funded by Scuola Superiore Sant’Anna
Processing (with the Processing R Provider plugin) makes it possible to write
and run R scripts inside QGIS.
Avertissement
R has to be installed on your computer and the PATH has to be correctly set up. Moreover Processing just calls the external R packages, it is not able to install them. So be sure to install external packages directly in R. See the related chapter in the user manual.
Note
If you have package problems, it may be related to missing
mandatory packages required by Processing, like sp, rgdal and raster.
18.33.1. Ajout de scripts
Adding a script is simple.
The easiest way is to open the Processing toolbox and choose
from the R menu (labelled with an
R icon) at the top of the Processing Toolbox.
You can also create the script in for instance a text editor and save it in
your R scripts folder (processing/rscripts).
When it has been saved there, it will be available for editing by
right-clicking on the script name in the processing toolbox and then choose
).

Note
Si vous ne pouvez pas voir R dans Processing, vous devez l’activer dans
Il ouvre une fenêtre d’édition de script dans laquelle vous devez fournir quelques paramètres avant de pouvoir ajouter le corps du script.

18.33.2. Création de graphiques
Dans ce tutoriel nous allons créer une boîte à moustaches à partir d’un champ d’une couche vertorielle.
Ouvrir le r_intro.qgs projet QGIS sous exercise_data/processing/r_intro/ folder.
18.33.2.1. Paramètres du script
Ouvrez l’éditeur et commencez l’écriture au début.
Vous devez définir certains paramètres avant le corps du script :
The name of the group (plots in this case) in which you want to put your script (if the group does not exist, it will be created):
##plots=groupYou will find your script in the plots R group in the Processing toolbox.
You have to tell Processing that you want to display a plot (in this example):
##showplotsYou will then find a link to the plot in the Result Viewer panel (can be turned on / off in and with ).
You also need to tell Processing about your input data. In this example we want to create a plot from a field of a vector layer:
##Layer=vectorProcessing now knows that the input is a vector. The name Layer is not important, what matters is the vector parameter.
Finally, you have to specify the input field of the vector layer (using the name you have provided above - Layer):
##X=Field LayerProcessing now knows that you need a field of Layer, and that you will call it X.
It is also possible to define the name of your script using
name:##My box plot script=nameIf not defined, the file name will be used as the name of the script.
18.33.2.2. Corps du script
Maintenant que vous avez établi l’en-tête du script vous pouvez ajouter la fonction
boxplot(Layer[[X]])
boxplot is the name of the R function, the parameter Layer is the name that you have defined for the input dataset and X is the name you have defined for the field of that dataset.
Avertissement
The parameter X has to be within double square brackets ([[]]).
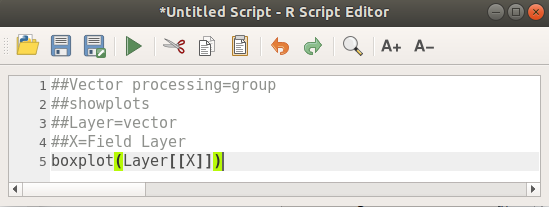
Le script complet se présente ainsi
##Vector processing=group
##showplots
##Layer=vector
##X=Field Layer
boxplot(Layer[[X]])
Save the script in the default path suggested by Processing (processing/rscripts).
If you have not defined a name in the script heading, the file name you
choose will become the name of the script in the Processing toolbox.
Note
You can save the script wherever you like, but Processing will then not be able to include it in the processing toolbox automatically, so you have to upload it manually.
Maintenant exécutez le en utilisant le bouton en haut de la fenêtre de l’éditeur :

Once the editor window has been closed, use the text box of Processing to find your script:
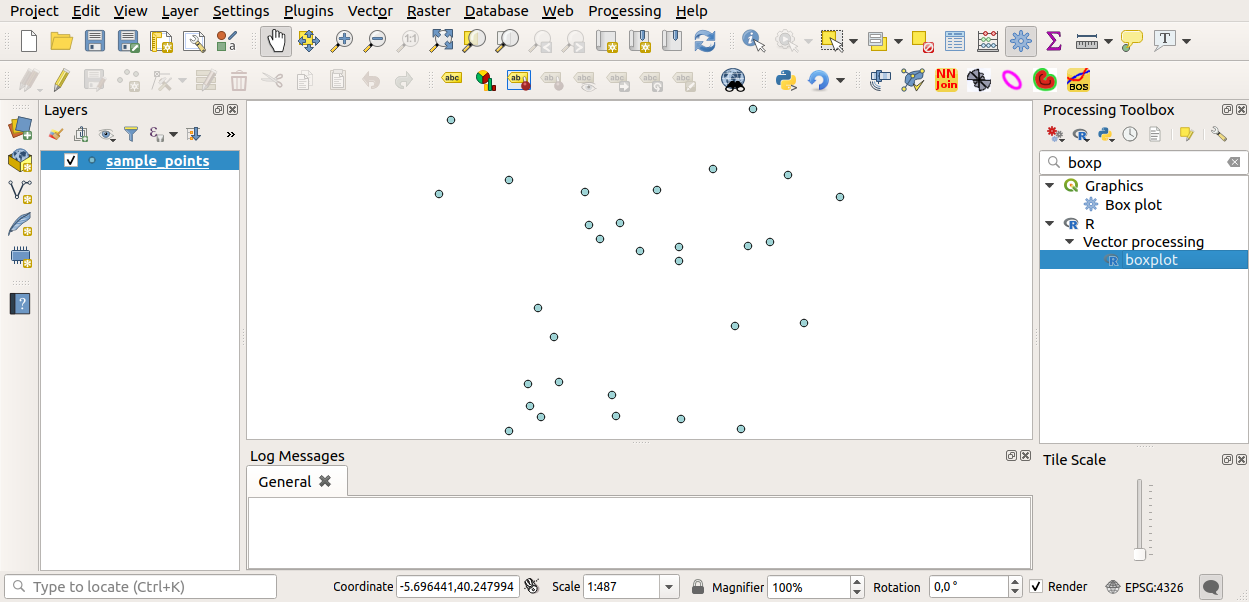
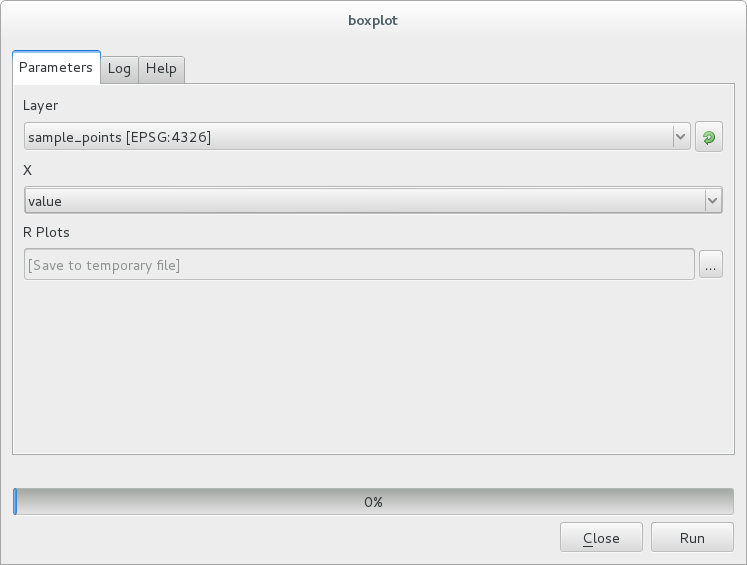
You can now fill the parameters required in the Processing algorithm window:
for Layer choose sample_points
for the X field choose value
Cliquez sur Lancer
La Fenêtre des résultats devrait s’ouvrir automatiquement, sinon, cliquez simplement sur .
Click on the link in the viewer and you will see:
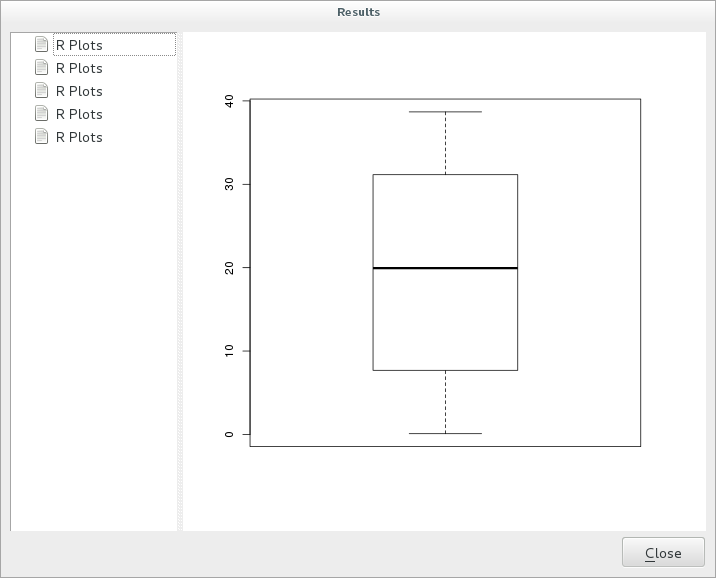
Note
You can open, copy and save the image by right clicking on the plot.
18.33.3. Créer un vecteur
You can also create a vector layer and have it automatically loaded into QGIS.
The following example has been taken from the Random sampling grid
script that you can download from the online collection
(the scripts in the on-line collection can be found on
https://github.com/qgis/QGIS-Processing/tree/master/rscripts).
The aim of this exercise is to create a random point vector layer
using an input vector layer to restrict the extent using the spsample
function of the sp package.
18.33.3.1. Paramètres du script
Comme auparavant, nous devons définir certains paramètres avant le corps du script :
Specify the name of the group in which you want to put your script, in this case Point pattern analysis:
##Point pattern analysis=groupDefine an input parameter (a vector layer) that will contstrain the placement of the random points:
##Layer=vectorSet an input parameter for the number of points that are going to be created (
Size, with a default value of10):##Size=number 10Note
Since a default value (
10) is defined, the user can change this number or can leave the parameter without a number.Specify that there is an output vector layer (called
Output):##Output=output vector
18.33.3.2. Corps du script
Vous pouvez maintenant ajouter le corps de la fonction :
Use the
spsamplefunction:pts=spsample(Layer, Size, type="random")
The function uses the Layer to constrain the placement of the points (if it is a line layer, a points will have to be on one of the lines in the layer, if it is a polygon layer, a point will have to be within a polygon). The number of points is taken from the Size parameter. The sampling method is random.
Generate the output (the
Outputparameter):Output=SpatialPointsDataFrame(pts, as.data.frame(pts))
Le script complet se présente ainsi
##Point pattern analysis=group
##Layer=vector
##Size=number 10
##Output=output vector
pts=spsample(Layer, Size, type="random")
Output=SpatialPointsDataFrame(pts, as.data.frame(pts))

Save it and run it, clicking on the run button.
Dans la nouvelle fenêtre, entrez les bons paramètres :
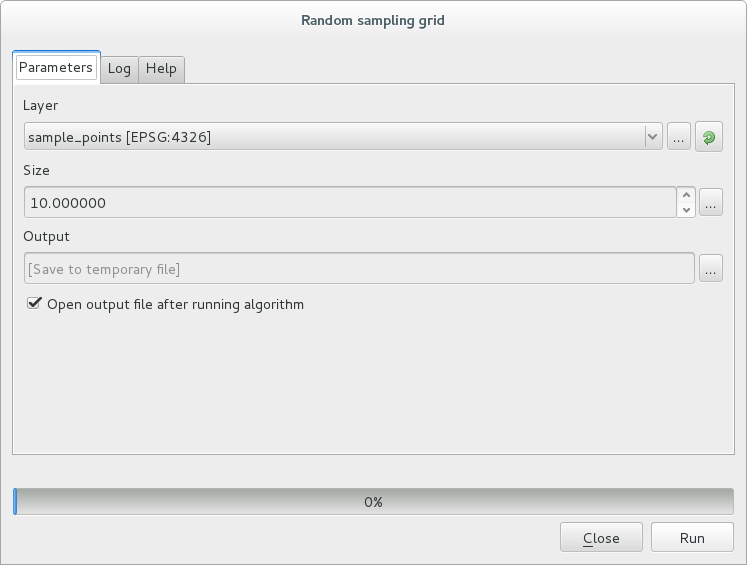
et cliquez sur Lancer.
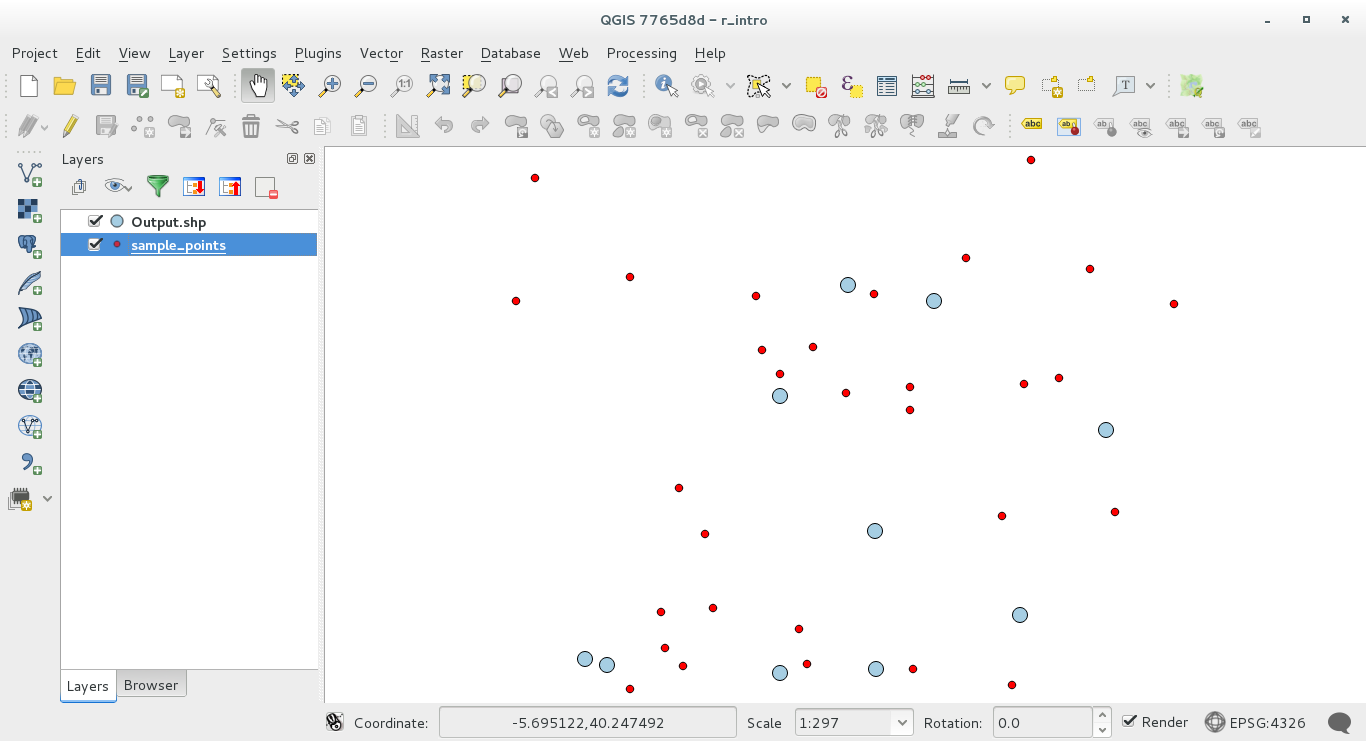
The result layer will be added to the table of contents and its points will be displayed on the map canvas:
18.33.4. Text and graph output from R - syntax
Processing (with the Processing R Provider plugin) uses special
syntax to get the results out of R:
>avant votre commande, comme pour>lillie.test(Couche[[Champ]])qui veut dire que le résultat devrait être envoyé sur la sortie de R (Visionneur de Résultat)+after a plot enables overlay plots. For exampleplot(Layer[[X]], Layer[[Y]]) + abline(h=mean(Layer[[X]]))