1.2. Préparation des données d’exercice
Note
Ce processus est prévu pour les formateurs ou les utilisateurs plus expérimentés de QGIS qui souhaitent créer des jeux de données locaux pour leur formation. Les jeux de données par défaut sont fournis avec le manuel d’exercice mais vous pouvez suivre les instructions qui suivent si vous désirez les remplacer.
Les données exemples fournies avec le manuel d’apprentissage concernent la ville de Swellendam et ses abords. Swellendam est située à environ 2 heures à l’est de Cape Town dans l’ouest de l’Afrique du Sud. Les noms des entités contenues dans le jeu de données sont en Anglais et en Afrikaans.
Tout le monde peut utiliser ce jeu de données sans aucune difficulté mais vous préférerez sans doute utiliser les données de votre propre pays ou votre propre ville. Si vous choisissez cette voie, vos données propres seront utilisées dans toutes les leçons du module 3 au module 7.2. D’autres modules utilisent des sources de données plus complexes qui ne seront peut-être pas disponibles pour votre région.
Note
Ces instructions supposent que vous avez une bonne connaissance de QGIS et n’ont pas vocation à être utilisées comme ressource pédagogique.
1.2.1.  Try Yourself Create OSM based vector Files
Si vous voulez remplacer le jeu de données par défaut avec le votre pour la formation, vous pouvez le faire facilement avec les outils inclus dans QGIS. La région que vous choisissez devrait avoir un mélange correct entre les zones urbaines et rurales, contenir des routes de différentes classes, des limites administratives (comme les réserves naturelles ou les fermes) et des surfaces en eau telles que les ruisseaux et les rivières.
Ouvrez un nouveau projet QGIS
Select to open the Data Source Manager dialog
In the Browser tab, expand the XYZ Tiles drop-down menu and double-click the OpenStreetMap item.
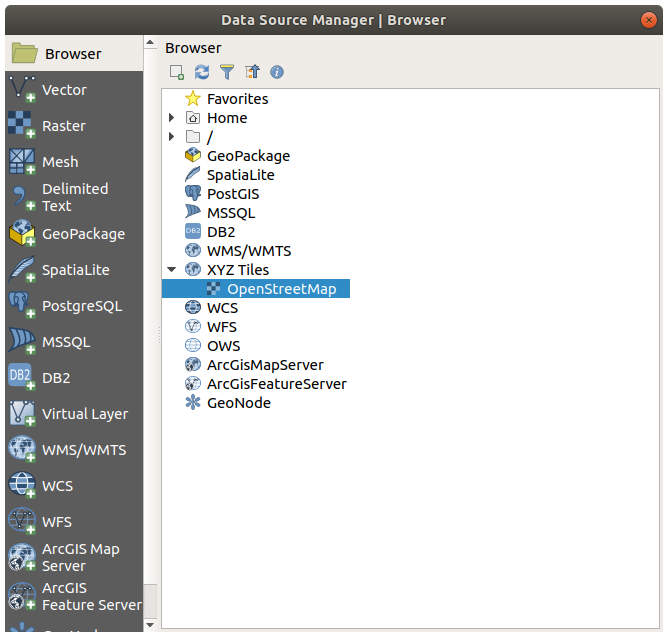
A map of the world is now visible on the map canvas.
Close the Data Source Manager dialog
Move to the area you’d like to use as study area
Now that we have the area we’ll extract the data from, let’s enable the extraction tools.
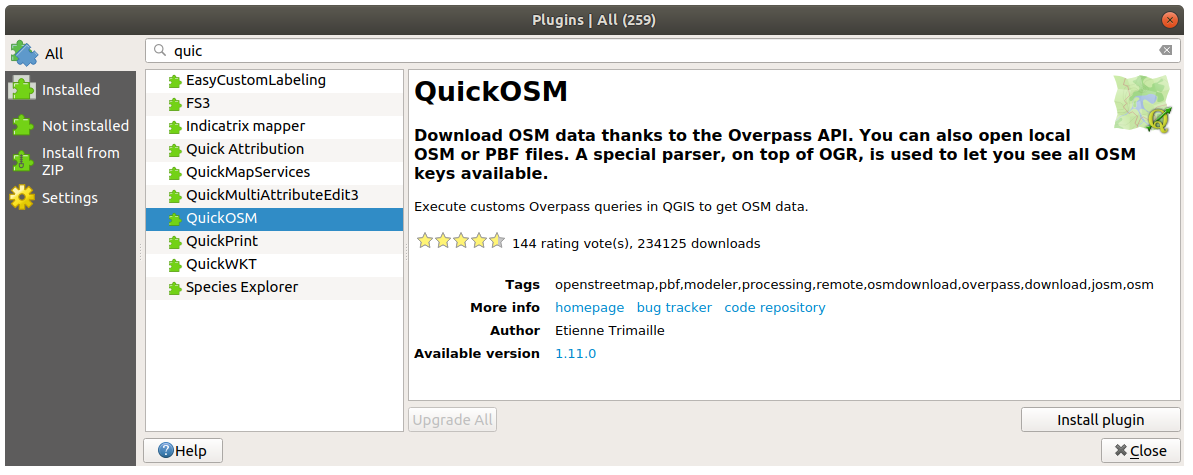
Go to
In the All tab, type
QuickOSMin the search boxSelect the QuickOSM plugin, press Install Plugin and then Close the dialog.
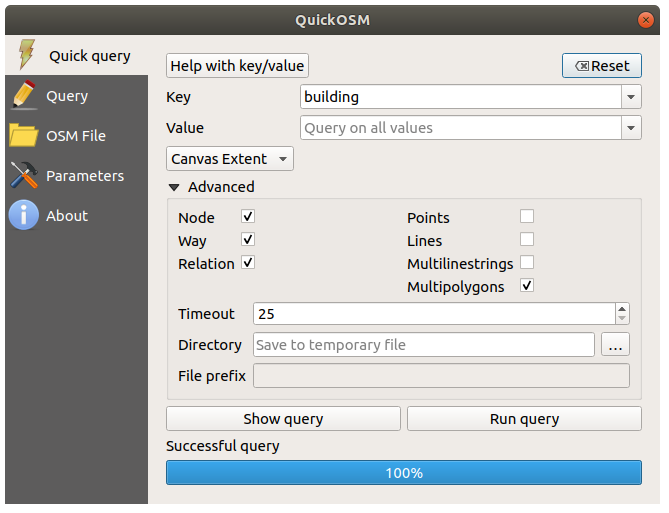
Execute the new plugin from menu
In the Quick query tab, select
buildingin the Key drop-down menuLeave the Value field empty, meaning that you are querying all buildings.
Select Canvas Extent in the next drop-down menu
Expand the Advanced group below and uncheck all geometry types on the right except Multipolygons.
Press Run query
A new
buildinglayer is added to the Layers panel, showing buildings in the selected extent.Proceed as above to extract other data:
Key = landuseandMultipolygonsgeometry type.Key = boundary,Value = protected_areaandMultipolygonsgeometry type.Key = natural,Value = waterandMultipolygonsgeometry type.Key = highwayand checkLinesandMultilinesgeometry types.Key = waterway,Value = riverand checkLinesandMultilinesgeometry types.Key = placeandPointsgeometry type.
This process adds the layers as temporary files (indicated by the
 icon next to their name).
You can sample the data your region contains in order to see what kind of results your region will yield.
We now need to save the resulting data to use during your course. We’ll be using ESRI Shapefile, GeoPackage and SpatiaLite formats depending on the data.
To convert the place temporary layer to another format:
Click the
icon next to the place layer
to open the Save Scratch Layer dialog.Note
If you need to change any of the temporary layer’s properties (CRS, extent, fields…), use the contextual menu instead, and ensure the Add saved file to map option is checked. This adds a new layer.
Select the ESRI Shapefile format
Use the … button to browse to the
exercise_data/shapefile/folder and save the file asplaces.shp.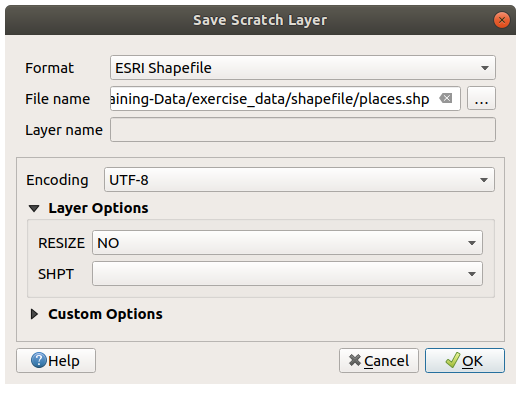
Press OK
In the Layers panel, the temporary place layer is replaced with the saved places shapefile layer and the temporary icon next to it removed.
Double-click the layer to open its tab and update the Layer name property to match the file name.
Repeat the process for other layers, renaming them as follows:
natural_waterintowaterwaterway_riverintoriversboundary_protected_areaintoprotected_areas
Each resulting data set should be saved in the
exercise_data/shapefile/directory.
The next step is to create a GeoPackage file from the building layer to use during the course:
Click the
icon next to the building layerSelect the GeoPackage format
Save the file as
training_data.gpkgunder theexercise_data/folderBy default, the Layer name is filled as the file name. Replace it with
buildings.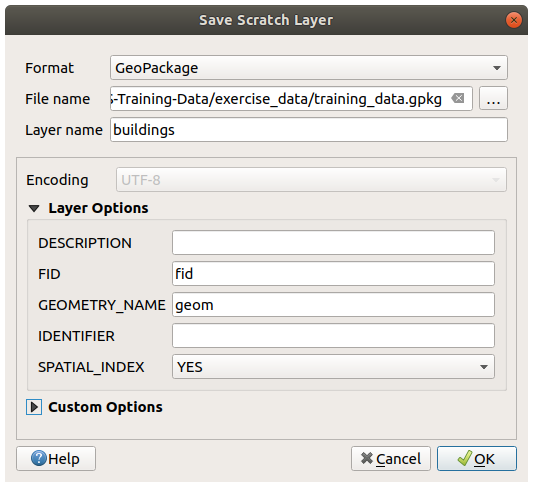
Press OK
Rename the layer in its properties dialog
Repeat the process with the highway layer, saving it as
roadsin the same GeoPackage database.
The last step is to save the remaining temporary file as a SpatiaLite file.
Click the
icon next to the landuse layerSelect the SpatiaLite format
Save the file as
landuse.sqliteunder theexercise_data/folder. By default, the Layer name is filled as the file name. Do not change it.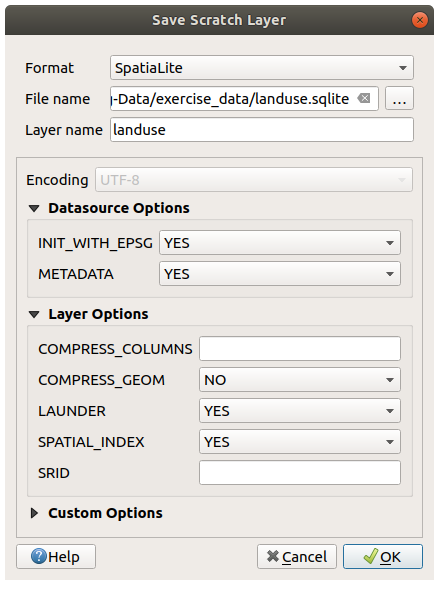
Press OK
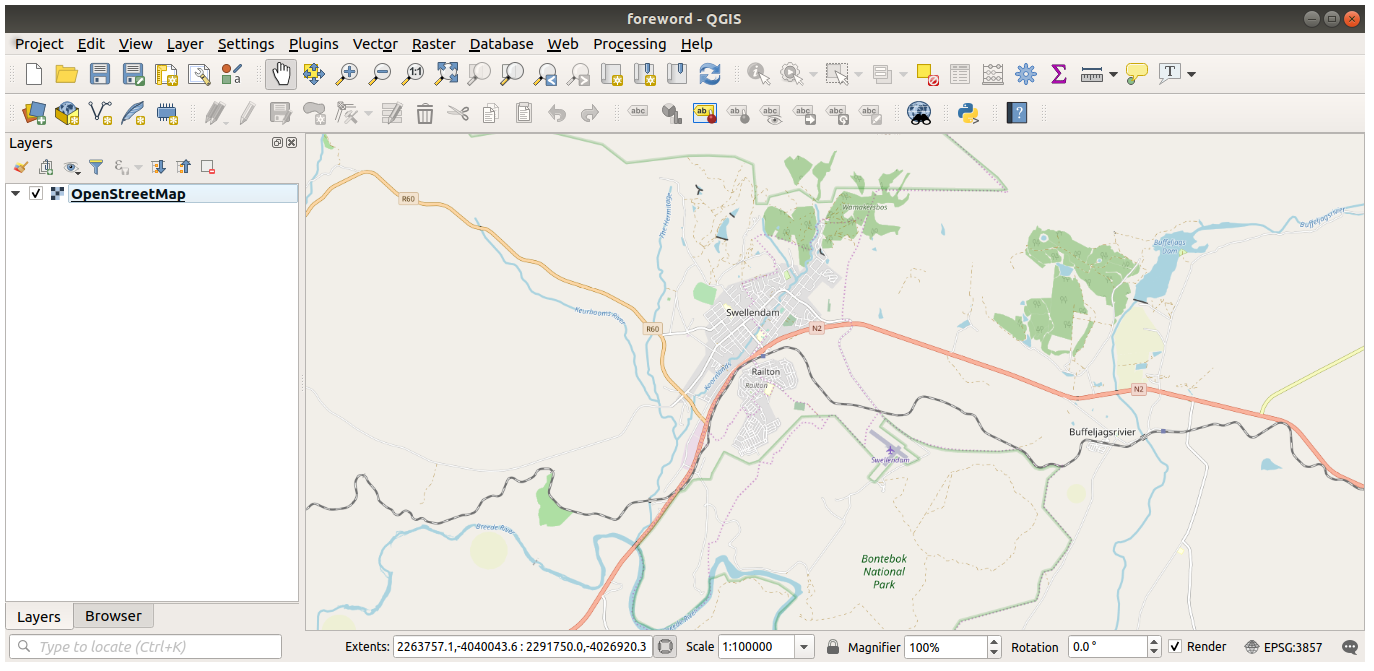
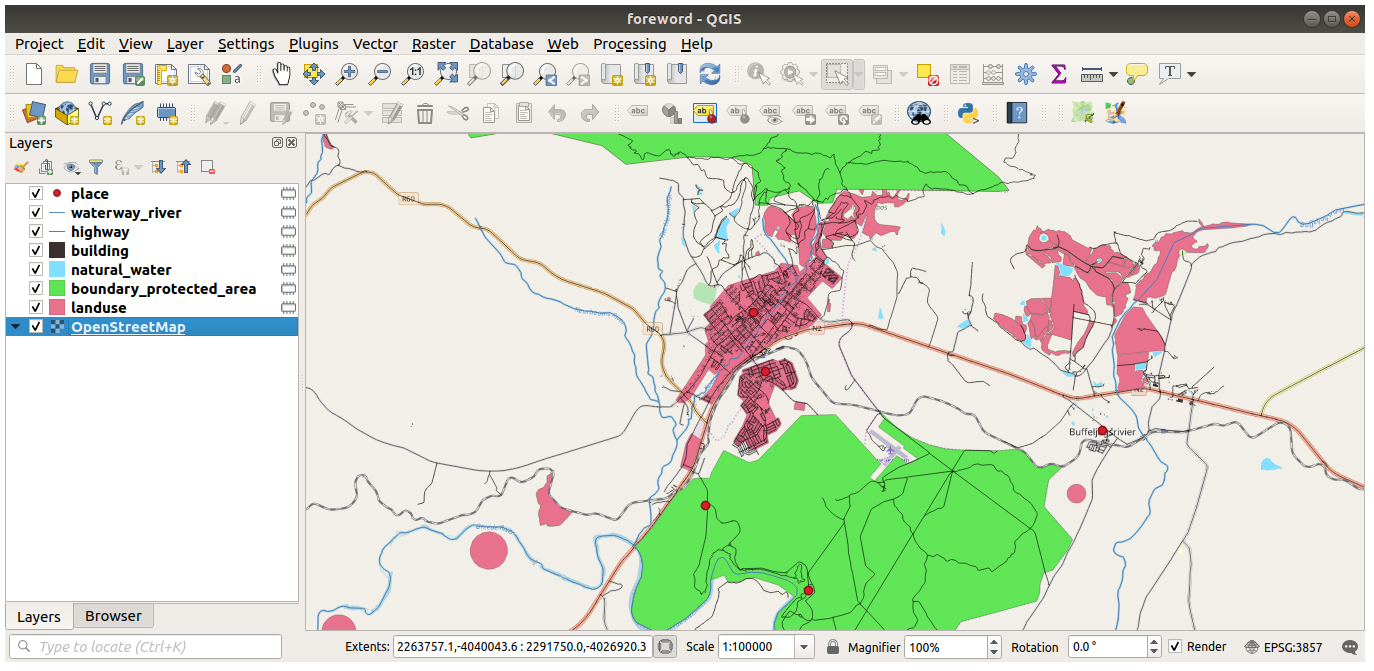
You should now have a map which looks something like this (the symbology will certainly be very different, because QGIS randomly assigns colors when layers are added to the map):
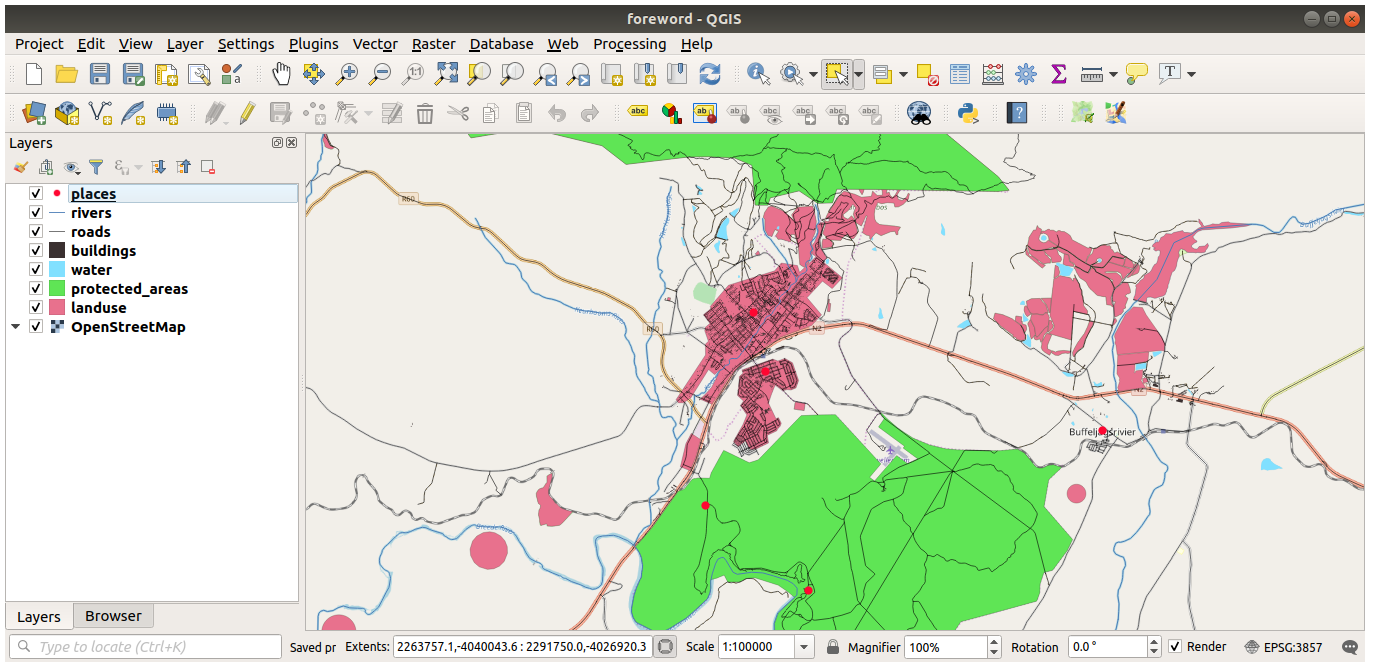
The important thing is that you have 7 vector layers matching those shown above and that all those layers have some data.
1.2.2. Try Yourself Créer des fichiers Tiff du MEN SRTM
For modules Module: Créer des données vectorielles and Module: Rasters, you’ll also need raster images (SRTM DEM) which cover the region you have selected for your course.
Le CGIAR-CGI (http://srtm.csi.cgiar.org/) fournit des MNE SRTM que vous pouvez télécharger depuis http://srtm.csi.cgiar.org/SELECTION/inputCoord.asp.
You’ll need images which cover the entire region you have chosen to use.
To find the extent coordinates, in QGIS ,  zoom to the extent of
the largest layer and pick the values in the
zoom to the extent of
the largest layer and pick the values in the  Extents
box of the status bar.
Keep the
Extents
box of the status bar.
Keep the GeoTiff format. Once the form is filled, click on the
Click here to Begin Search >> button and download the file(s).
Une fois que vous avez téléchargé le/les fichier(s) requis, vous devriez les sauvegarder dans le répertoire exercise_data sous raster/SRTM.
1.2.3. Try Yourself Créer des fichiers Image Tiff
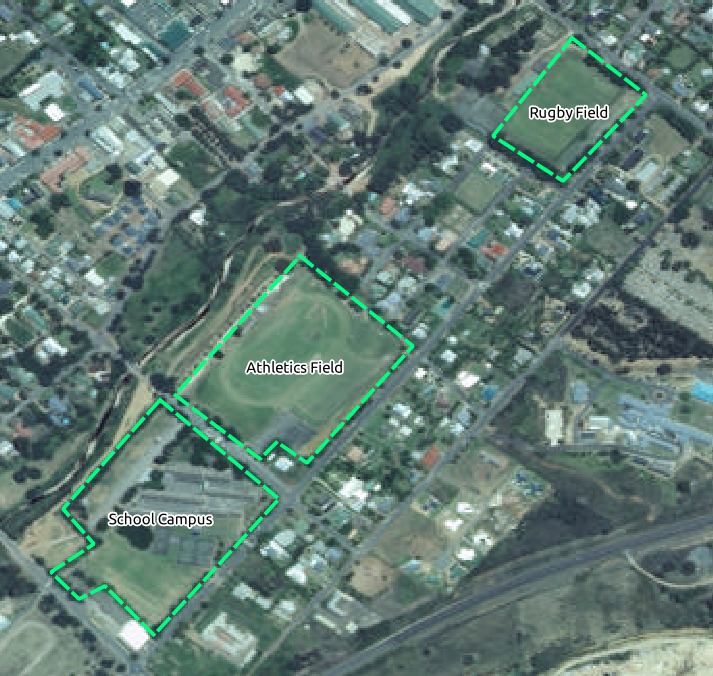
In Module Module: Créer des données vectorielles, Follow Along: Sources de Données lesson shows close-up images of three school sports fields which students are asked to digitize. You’ll therefore need to reproduce these images using your new SRTM DEM tiff file(s). There is no obligation to use school sports fields: any three school land-use types can be used (e.g. different school buildings, playgrounds or car parks).
For reference, the image in the example data is:
1.2.4.  Try Yourself Remplacement des variables
Having created your localised dataset, the final step is to replace the tokens
in the substitutions.txt file so that the appropriate names will appear
in your localised version of the Training Manual.
Les variables qui doivent être remplacées sont les suivantes:
majorUrbanName: this defaults to « Swellendam ». Replace with the name of the major town in your region.schoolAreaType1: this defaults to « athletics field ». Replace with the name of the largest school area type in your region.largeLandUseArea: this defaults to « Bontebok National Park ». Replace with the name of a large landuse polygon in your region.srtmFileName: this defaults tosrtm_41_19.tif. Replace this with the filename of your SRTM DEM file.localCRS: this defaults toWGS 84 / UTM 34S. You should replace this with the correct CRS for your region.