.
Instrumentarul
Bara de instrumente este elementul principal al GUI-ului de prelucrare, fiind cel cu care aveți cele mai multe șanse de a vă întâlni în munca de zi cu zi. Acesta prezintă lista, grupată în diferite blocuri, a tuturor algoritmilor disponibilii, fiind punctul de acces pentru rularea lor, fie ca proces individual, fie ca proces aparținând unei serii, care implică mai multe execuții ale aceluiași algoritm utilizând diferite seturi de intrare.
Figure Processing 5:
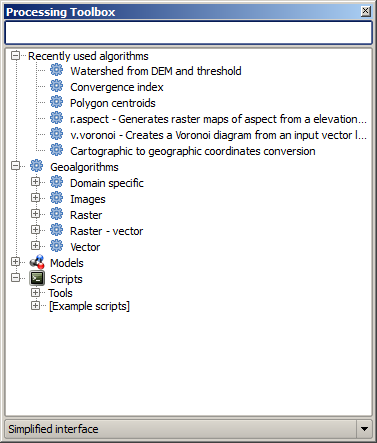
Processing Toolbox 
The toolbox contains all the available algorithms, divided into predefined groups. All these groups are found under a single tree entry named Geoalgorithms.
Additionally, two more entries are found, namely Models and Scripts. These include user-created algorithms, and they allow you to define your own workflows and processing tasks. We will devote a full section to them a bit later.
În partea de sus a setului de instrumente, veți găsi o casetă de text. Pentru a reduce numărul de algoritmi prezentați în caseta de instrumente și pentru a găsi mai ușor unul de care aveți nevoie, puteți introduce orice cuvânt sau o expresie în caseta de text. Observați că, pe măsură ce tastați, numărul de algoritmi din setul de instrumente se reduce doar la acei algoritmi care conțin în numele lor textul pe care l-ați introdus.
In the lower part, you will find a box that allows you to switch between the simplified algorithm list (the one explained above) and the advanced list. If you change to the advanced mode, the toolbox will look like this:
Figure Processing 6:
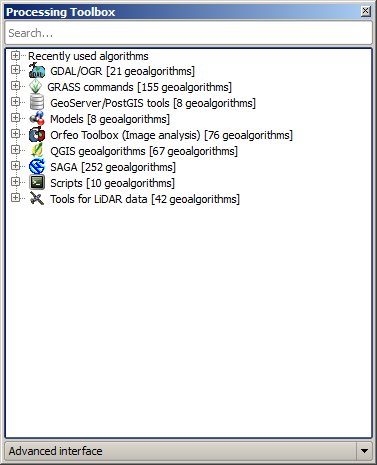
Processing Toolbox (advanced mode)
In the advanced view, each group represents a so-called ‘algorithm provider’, which is a set of algorithms coming from the same source, for instance, from a third-party application with geoprocessing capabilities. Some of these groups represent algorithms from third-party applications like SAGA, GRASS or R, while others contain algorithms directly coded as part of the processing plugin, not relying on any additional software.
This view is recommended to those users who have a certain knowledge of the applications that are backing the algorithms, since they will be shown with their original names and groups.
Also, some additional algorithms are available only in the advanced view, such as LiDAR tools and scripts based on the R statistical computing software, among others. Independent QGIS plugins that add new algorithms to the toolbox will only be shown in the advanced view.
In particular, the simplified view contains algorithms from the following providers:
- GRASS
- SAGA
- OTB
- Native QGIS algorithms
In the case of running QGIS under Windows, these algorithms are fully-functional in a fresh installation of QGIS, and they can be run without requiring any additional installation. Also, running them requires no prior knowledge of the external applications they use, making them more accesible for first-time users.
If you want to use an algorithm not provided by any of the above providers, switch to the advanced mode by selecting the corresponding option at the bottom of the toolbox.
Pentru a executa un algoritm, este suficient să faceți dublu-clic pe numele său, în bara de instrumente.
Dialogul algoritmului
Once you double-click on the name of the algorithm that you want to execute, a dialog similar to that in the figure below is shown (in this case, the dialog corresponds to the SAGA ‘Convergence index’ algorithm).
Figure Processing 7:
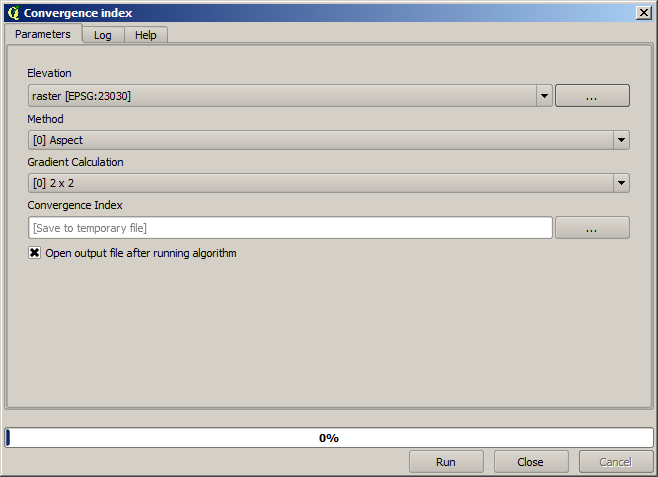
Parameters Dialog
This dialog is used to set the input values that the algorithm needs to be executed. It shows a table where input values and configuration parameters are to be set. It of course has a different content, depending on the requirements of the algorithm to be executed, and is created automatically based on those requirements. On the left side, the name of the parameter is shown. On the right side, the value of the parameter can be set.
Deși numărul și tipul de parametri depind de caracteristicile algoritmului, structura este similară pentru toate. Parametrii din tabel pot avea unul din tipurile de mai jos.
A raster layer, to select from a list of all such layers available (currently opened) in QGIS. The selector contains as well a button on its right-hand side, to let you select filenames that represent layers currently not loaded in QGIS.
A vector layer, to select from a list of all vector layers available in QGIS. Layers not loaded in QGIS can be selected as well, as in the case of raster layers, but only if the algorithm does not require a table field selected from the attributes table of the layer. In that case, only opened layers can be selected, since they need to be open so as to retrieve the list of field names available.
Veți vedea un buton pentru fiecare selector de strat vectorial, așa cum se arată în figura de mai jos.
Figure Processing 8:
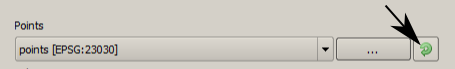
Vector iterator button
În cazul în care algoritmul conține mai mulți, se va putea alege doar unul. Dacă este apăsat butonul corespunzător unei intrări vectoriale, algoritmul va fi executat iterativ pentru fiecare dintre entitățile sale, în loc de o singură dată pentru întregul strat, generându-se un număr de rezultate identic cu numărul de execuții ale algoritmului. Acest lucru permite automatizarea procesului, atunci când toate entitățile dintr-un strat trebuie să fie procesate separat.
- A table, to select from a list of all available in QGIS. Non-spatial tables are loaded into QGIS like vector layers, and in fact they are treated as such by the program. Currently, the list of available tables that you will see when executing an algorithm that needs one of them is restricted to tables coming from files in dBase (.dbf) or Comma-Separated Values (.csv) formats.
Opțiunea de a alege dintr-o listă de selecție a variantelor posibile.
- A numerical value, to be introduced in a text box. You will find a button by its side. Clicking on it, you will see a dialog that allows you to enter a mathematical expression, so you can use it as a handy calculator. Some useful variables related to data loaded into QGIS can be added to your expression, so you can select a value derived from any of these variables, such as the cell size of a layer or the northernmost coordinate of another one.
Figure Processing 9:
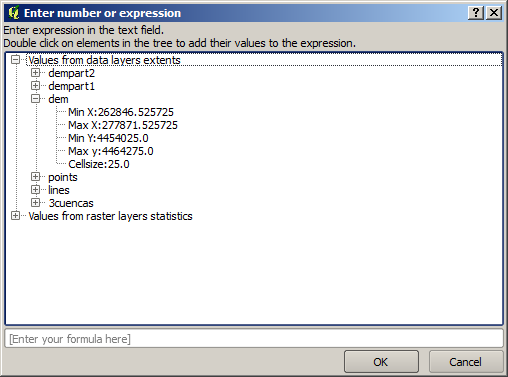
Number Selector
Un interval, cu valori min și max care vor fi introduse în două casete de text.
Un șir, care urmează să fie introdus într-o casetă de text.
Un câmp, de ales din tabelul atribute al unui strat vectorial, sau un singur tabel selectat dintr-un alt parametru.
Un sistem de coordonate de referință. Aveți posibilitatea să tastați codul EPSG direct în caseta de text, sau să-l selectați din dialogul de selecție a CRS-ului, care apare atunci când faceți clic pe butonul din partea dreaptă.
An extent, to be entered by four numbers representing its xmin, xmax, ymin, ymax limits. Clicking on the button on the right-hand side of the value selector, a pop-up menu will appear, giving you two options: to select the value from a layer or the current canvas extent, or to define it by dragging directly onto the map canvas.
Figure Processing 10
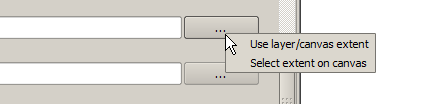
Extent selector
Dacă selectați prima opțiune, veți vedea o fereastră similară cu cea următoare.
Figure Processing 11
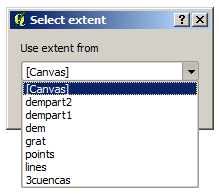
Extent List
Dacă o selectați pe a doua, fereastra parametrilor se va ascunde, astfel încât să puteți faceți clic pe ea și să o trageți pe pânză. După ce ați definit dreptunghiul selectat, dialogul va reapărea, având valorile în caseta de text a extinderii.
Figure Processing 12:
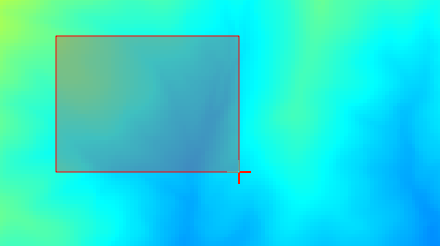
Extent Drag
A list of elements (whether raster layers, vector layers or tables), to select from the list of such layers available in QGIS. To make the selection, click on the small button on the left side of the corresponding row to see a dialog like the following one.
Figure Processing 13:
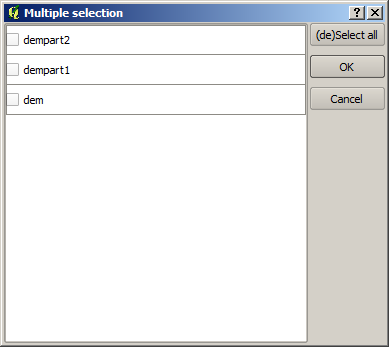
Multiple Selection
Un mic tabel care va fi editat de către utilizator. Acesta este folosit pentru a defini parametri, cum ar fi tabele de căutare sau nucleele de convoluție, printre altele.
Faceți clic pe butonul din partea dreapta pentru a vedea tabelul și pentru a-i edita valorile.
Figure Processing 14:
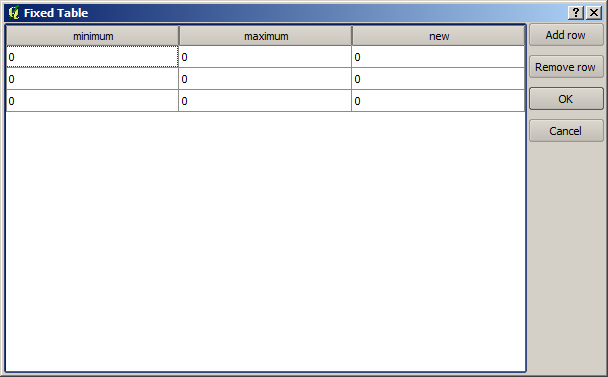
Fixed Table
În funcție de algoritm, numărul de rânduri poate fi modificat sau nu, cu ajutorul butoanelor din pe partea dreaptă a ferestrei.
You will find a [Help] tab in the the parameters dialog. If a help file is available, it will be shown, giving you more information about the algorithm and detailed descriptions of what each parameter does. Unfortunately, most algorithms lack good documentation, but if you feel like contributing to the project, this would be a good place to start.
O notă privind proiecțiile
Algorithms run from the processing framework — this is also true of most of the external applications whose algorithms are exposed through it. Do not perform any reprojection on input layers and assume that all of them are already in a common coordinate system and ready to be analized. Whenever you use more than one layer as input to an algorithm, whether vector or raster, it is up to you to make sure that they are all in the same coordinate system.
Note that, due to QGIS‘s on-the-fly reprojecting capabilities, although two layers might seem to overlap and match, that might not be true if their original coordinates are used without reprojecting them onto a common coordinate system. That reprojection should be done manually, and then the resulting files should be used as input to the algorithm. Also, note that the reprojection process can be performed with the algorithms that are available in the processing framework itself.
By default, the parameters dialog will show a description of the CRS of each layer along with its name, making it easy to select layers that share the same CRS to be used as input layers. If you do not want to see this additional information, you can disable this functionality in the processing configuration dialog, unchecking the Show CRS option.
Dacă încercați să executați un algoritm folosind ca intrare două sau mai multe straturi, cu CRS-uri nepotrivite, va fi afișat un dialog de avertizare.
Puteți încă să executați algoritmul, dar fiți conștienți de faptul că, în cele mai multe cazuri se vor produce rezultate greșite, cum ar fi straturile goale datorate straturilor de intrare care nu se suprapun.
Obiecte de date generate de algoritmi
Obiectele de date generate de un algoritm pot fi oricare din următoarele tipuri:
Un strat raster
Un strat vectorial
O tabelă
Un fișier HTML (folosit pentru ieșiri de text și grafice)
These are all saved to disk, and the parameters table will contain a text box corresponding to each one of these outputs, where you can type the output channel to use for saving it. An output channel contains the information needed to save the resulting object somewhere. In the most usual case, you will save it to a file, but the architecture allows for any other way of storing it. For instance, a vector layer can be stored in a database or even uploaded to a remote server using a WFS-T service. Although solutions like these are not yet implemented, the processing framework is prepared to handle them, and we expect to add new kinds of output channels in a near feature.
To select an output channel, just click on the button on the right side of the text box. That will open a save file dialog, where you can select the desired file path. Supported file extensions are shown in the file format selector of the dialog, depending on the kind of output and the algorithm.
The format of the output is defined by the filename extension. The supported formats depend on what is supported by the algorithm itself. To select a format, just select the corresponding file extension (or add it, if you are directly typing the file path instead). If the extension of the file path you entered does not match any of the supported formats, a default extension (usually .dbf` for tables, .tif for raster layers and .shp for vector layers) will be appended to the file path, and the file format corresponding to that extension will be used to save the layer or table.
If you do not enter any filename, the result will be saved as a temporary file in the corresponding default file format, and it will be deleted once you exit QGIS (take care with that, in case you save your project and it contains temporary layers).
You can set a default folder for output data objects. Go to the configuration dialog (you can open it from the Processing menu), and in the General group, you will find a parameter named Output folder. This output folder is used as the default path in case you type just a filename with no path (i.e., myfile.shp) when executing an algorithm.
When running an algorithm that uses a vector layer in iterative mode, the entered file path is used as the base path for all generated files, which are named using the base name and appending a number representing the index of the iteration. The file extension (and format) is used for all such generated files.
Apart from raster layers and tables, algorithms also generate graphics and text as HTML files. These results are shown at the end of the algorithm execution in a new dialog. This dialog will keep the results produced by any algorithm during the current session, and can be shown at any time by selecting Processing ‣ Results viewer from the QGIS main menu.
Some external applications might have files (with no particular extension restrictions) as output, but they do not belong to any of the categories above. Those output files will not be processed by QGIS (opened or included into the current QGIS project), since most of the time they correspond to file formats or elements not supported by QGIS. This is, for instance, the case with LAS files used for LiDAR data. The files get created, but you won’t see anything new in your QGIS working session.
Pentru toate celelalte tipuri de rezultate, veți găsi o casetă de selectare, pe care o puteți folosi pentru a indica algoritmului dacă să încarce fișierul după ce este generat de către algoritm, sau nu. În mod implicit, toate fișierele vor fi deschise.
Optional outputs are not supported. That is, all outputs are created. However, you can uncheck the corresponding checkbox if you are not interested in a given output, which essentially makes it behave like an optional output (in other words, the layer is created anyway, but if you leave the text box empty, it will be saved to a temporary file and deleted once you exit QGIS).
Configurarea cadrului de procesare
După cum s-a menționat, meniul de configurare oferă acces la un nou dialog în care puteți configura modul în care funcționează algoritmii. Parametrii de configurare sunt structurați în blocuri separate pe care le puteți selecta în partea stângă a dialogului.
Along with the aforementioned Output folder entry, the General block contains parameters for setting the default rendering style for output layers (that is, layers generated by using algorithms from any of the framework GUI components). Just create the style you want using QGIS, save it to a file, and then enter the path to that file in the settings so the algorithms can use it. Whenever a layer is loaded by SEXTANTE and added to the QGIS canvas, it will be rendered with that style.
Stilurile de randare pot fi configurate în mod individual pentru fiecare algoritm și pentru fiecare dintre rezultatele sale. Doar faceți clic dreapta pe numele algoritmului din caseta de instrumente și selectați Edit rendering styles. Veți vedea un dialog similar cu cel care urmează.
Figure Processing 15:
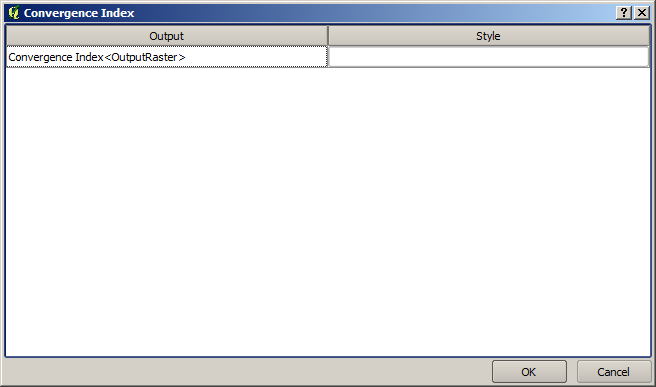
Rendering Styles
Selectați fișierul de stil (.qml) pe care îl bdoriți pentru fiecare ieșire, apoi apăsați [OK].
Alți parametri de configurare din grupul General sunt listați mai jos:
- Use filename as layer name. The name of each resulting layer created by an algorithm is defined by the algorithm itself. In some cases, a fixed name might be used, meaning that the same output name will be used, no matter which input layer is used. In other cases, the name might depend on the name of the input layer or some of the parameters used to run the algorithm. If this checkbox is checked, the name will be taken from the output filename instead. Notice that, if the output is saved to a temporary file, the filename of this temporary file is usually a long and meaningless one intended to avoid collision with other already existing filenames.
- Use only selected features. If this option is selected, whenever a vector layer is used as input for an algorithm, only its selected features will be used. If the layer has no selected features, all features will be used.
- Pre-execution script file and Post-execution script file. These parameters refer to scripts written using the processing scripting functionality, and are explained in the section covering scripting and the console.
Apart from the General block in the settings dialog, you will also find a block for algorithm providers. Each entry in this block contains an Activate item that you can use to make algorithms appear or not in the toolbox. Also, some algorithm providers have their own configuration items, which we will explain later when covering particular algorithm providers.