.
Instrumente generale
Combinații de taste
QGIS provides default keyboard shortcuts for many features. You can find them in section Bara de Meniuri. Additionally, the menu option Settings ‣ Configure Shortcuts.. allows you to change the default keyboard shortcuts and to add new keyboard shortcuts to QGIS features.
Figure Shortcuts 1:
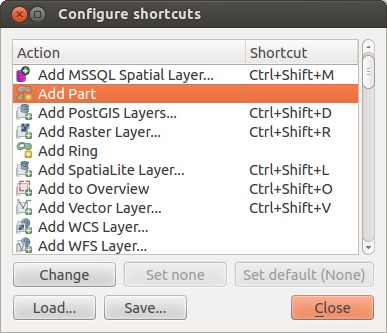
Define shortcut options  (Gnome)
Configuration is very simple. Just select a feature from the list and click on [Change], [Set none] or [Set default]. Once you have finished your configuration, you can save it as an XML file and load it to another QGIS installation.
Ajutor contextual
Când aveți nevoie de ajutor pe un anumit subiect, puteți accesa ajutorul contextual prin intermediul butonului [Ajutor], disponibil in cele mai multe dialoguri — vă rugăm să rețineți că plugin-urile terțe pot avea pagini web dedicate.
Randare
By default, QGIS renders all visible layers whenever the map canvas is refreshed. The events that trigger a refresh of the map canvas include:
Adăugarea unui strat
Deplasare și transfocare
- Resizing the QGIS window
Schimbarea vizibilității unuia sau mai multor straturi
QGIS allows you to control the rendering process in a number of ways.
Randarea Dependentă de Scară
Randarea dependentă de scară vă permite să specificați scările minimă și maximă la care un strat va fi vizibil. Pentru a seta o randare dependentă de scară, deschideți Properties printr-un dublu-clic pe stratul din legendă. În fila General, faceți clic pe caseta  :guilabel:`Scale dependent visibility`pentru a activa funcția, apoi setați valorile pentru scările minimă.și maximă.
You can determine the scale values by first zooming to the level you want to use and noting the scale value in the QGIS status bar.
Controarea Randării Hărților
Map rendering can be controlled in the various ways, as described below.
Suspendarea Randării
To suspend rendering, click the Render checkbox in the
lower right corner of the status bar. When the Render
checkbox is not checked, QGIS does not redraw the canvas in response to any of
the events described in section Randare. Examples of when you
might want to suspend rendering include:
Adăugarea mai multor straturi și simbolizarea lor înainte de desenare
Adăugarea unuia sau a mai multor straturi mari, și stabilirea dependenței de scară înainte de desenare
Adăugarea unuia sau a mai multe straturi mari, și transfocarea la o vizualizare specifică înainte de desenare
Orice combinație a celor de mai sus
Bifarea casetei Randare activează randarea și provoacă o reîmprospătare imediată a canevasului hărții.
Setarea Opțiunilor de Adăugare a Stratului
Puteți seta o opțiune pentru a încărca mereu noi straturi, fără a le desena. Acest lucru înseamnă că stratul va fi adăugat la hartă, dar caseta sa de vizibilitate din legendă va fi debifată din oficiu. Pentru a seta această opțiune, selectați opțiunea de meniu Settings ‣ Options, apoi faceți clic pe fila Rendering. Debifați caseta În mod implicit, straturile nou adăugate pe hartă ar trebui să fie vizibile. Orice strat adăugat ulterior pe harta va fi stins (invizibil), în mod implicit.
Oprirea Randării
Pentru a opri desenarea hărții, apăsați tasta ESC. Acest lucru va opri reîmprospătarea canevasului, lăsând harta parțial desenată. Este posibil să dureze ceva timp între apăsarea tastei ESC și momentul în care desenarea hărții se oprește.
Note
În acest moment nu este posibilă oprirea randării — acest lucru a fost dezactivat în portarea de Qt4, din cauza problemelor și a defectelor Interfeței cu Utilizatorul (UI).
Updating the Map Display During Rendering
You can set an option to update the map display as features are drawn. By default, QGIS does not display any features for a layer until the entire layer has been rendered. To update the display as features are read from the datastore, choose menu option Settings ‣ Options and click on the Rendering tab. Set the feature count to an appropriate value to update the display during rendering. Setting a value of 0 disables update during drawing (this is the default). Setting a value too low will result in poor performance, as the map canvas is continually updated during the reading of the features. A suggested value to start with is 500.
Influențarea Calității Randării
To influence the rendering quality of the map, you have two options. Choose menu option Settings ‣ Options, click on the Rendering tab and select or deselect following checkboxes:
- Make lines appear less jagged at the expense of some
drawing performance
- Fix problems with incorrectly filled polygons
Accelerează randarea
There are two settings that allow you to improve rendering speed. Open the QGIS options dialog using Settings ‣ Options, go to the Rendering tab and select or deselect the following checkboxes:
- Enable back buffer. This provides better graphics
performance at the cost of losing the possibility to cancel rendering and
incrementally draw features. If it is unchecked, you can set the
Number of features to draw before updating the display, otherwise
this option is inactive.
- Se folosește memoria tampon, acolo unde este posibil, pentru a se accelera redesenarea
Măsurarea
Measuring works within projected coordinate systems (e.g., UTM) and unprojected data. If the loaded map is defined with a geographic coordinate system (latitude/longitude), the results from line or area measurements will be incorrect. To fix this, you need to set an appropriate map coordinate system (see section Lucrul cu Proiecții). All measuring modules also use the snapping settings from the digitizing module. This is useful, if you want to measure along lines or areas in vector layers.
To select a measuring tool, click on  and select the tool you want
to use.
and select the tool you want
to use.
Measure length, areas and angles
Measure Line: QGIS is able to measure real distances
between given points according to a defined ellipsoid. To configure this,
choose menu option Settings ‣ Options, click on the
Map tools tab and select the appropriate ellipsoid. There, you can
also define a rubberband color and your preferred measurement units (meters or
feet) and angle units (degrees, radians and gon). The tool then allows you to
click points on the map. Each segment length, as well as the total, shows up in
the measure window. To stop measuring, click your right mouse button.
Note that you can interactively change the measurement units in the measurement
dialog. It overrides the Preferred measurement units in the options.
There is an info section in the dialog that shows which CRS settings are being used
during measurement calculations.
Figure Measure 1:
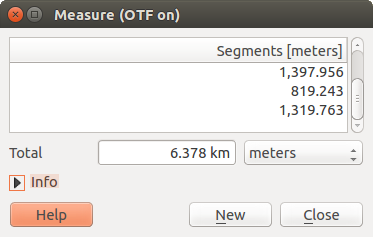
Measure Distance (Gnome)
 Measure Area: Areas can also be measured. In the
measure window, the accumulated area size appears. In addition, the measuring
tool will snap to the currently selected layer, provided that layer has its
snapping tolerance set (see section Setarea Toleranței Acroșării și Căutarea Razei). So, if you want
to measure exactly along a line feature, or around a polygon feature, first set
its snapping tolerance, then select the layer. Now, when using the measuring
tools, each mouse click (within the tolerance setting) will snap to that layer.
Measure Area: Areas can also be measured. In the
measure window, the accumulated area size appears. In addition, the measuring
tool will snap to the currently selected layer, provided that layer has its
snapping tolerance set (see section Setarea Toleranței Acroșării și Căutarea Razei). So, if you want
to measure exactly along a line feature, or around a polygon feature, first set
its snapping tolerance, then select the layer. Now, when using the measuring
tools, each mouse click (within the tolerance setting) will snap to that layer.
Figure Measure 2:
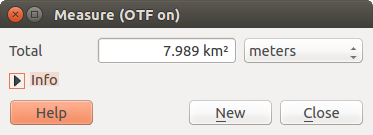
Measure Area (Gnome)
 Measure Angle: You can also measure angles. The
cursor becomes cross-shaped. Click to draw the first segment of the angle you
wish to measure, then move the cursor to draw the desired angle. The measure
is displayed in a pop-up dialog.
Measure Angle: You can also measure angles. The
cursor becomes cross-shaped. Click to draw the first segment of the angle you
wish to measure, then move the cursor to draw the desired angle. The measure
is displayed in a pop-up dialog.
Figure Measure 3:
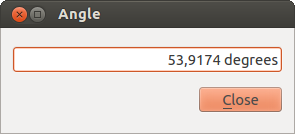
Measure Angle (Gnome)
Salvarea și deselectarea entităților
The QGIS toolbar provides several tools to select features in the map canvas.
To select one or several features, just click on  and select your
tool:
and select your
tool:
- Select Single Feature
 Select Features by Rectangle
 Select Features by Polygon
 Select Features by Freehand
 Select Features by Radius
To deselect all selected features click on  Deselect
features from all layers.
Deselect
features from all layers.
 Select feature using an expression allow user
to select feature using expression dialog. See Expresii
chapter for some example.
Select feature using an expression allow user
to select feature using expression dialog. See Expresii
chapter for some example.
Users can save features selection into a New Memory Vector Layer or a New Vector Layer using Edit ‣ Paste Feature as ... and choose the mode you want.
Identificare entități
The Identify tool allows you to interact with the map canvas and get information on features
in a pop-up window. To identify features, use View ‣ Identify
features or press Ctrl + Shift + I, or click on the  Identify features icon in the toolbar.
If you click on several features, the Identify results dialog will list information about all the selected features. The first item is the number of the layer in the list of results, followed by the layer name. Then, its first child will be the name of a field with its value. The first field is the one selected in Properties ‣ Display. Finally, all information about the feature is displayed.
Această fereastră poate fi setată pentru a afișa câmpuri personalizate, dar, în mod implicit, ea va afișa trei tipuri de informații:
- Actions: Actions can be added to the identify feature windows. When clicking on the action label, action will be run. By default, only one action is added, to view feature form for editing.
- Derived: This information is calculated or derived from other information. You can find clicked coordinate, X and Y coordinates, area in map units and perimeter in map units for polygons, length in map units for lines and feature ids.
- Data attributes: This is the list of attribute fields from the data.
Figure Identify 1:
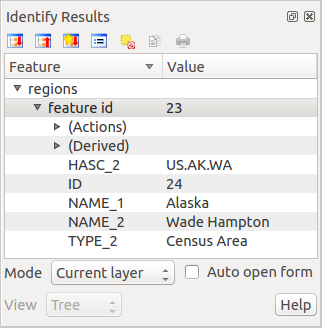
Identify feaures dialog (Gnome)
At the top of the window, you have five icons:
 Expand tree
 Collapse tree
 Default behaviour
 Copy attributes
 Print selected HTML response
At the bottom of the window, you have the Mode and View comboboxes. With the Mode combobox you can define the identify mode: ‘Current layer’, ‘Top down, stop at first’, ‘Top down’ and ‘Layer selection’. The View can be set as ‘Tree’, ‘Table’ and ‘Graph’.
The identify tool allows you to auto open a form. In this mode you can change the feautures attributes.
Alte funcții pot fi găsite în meniul contextual al elementului identificat. De exemplu, din meniul contextual puteți:
Vizualiza formularul entității
Transfocare pe entitate
Copia entități: Copierea tuturor entităților geometrice și a atributelor
- Toggle feature selection: adds identified feature to selection
Copia valoarea atributului: Copie doar valoarea atributului pe care faceți clic
- Copy feature attributes: Copy only attributes
Șterge rezultatele: Elimină rezultatele din fereastră
Elimina evidențierea: Anulează evidențierea entităților de pe hartă
Evidențiază tot
Evidențiere strat
Activa stratul: Alegeți un strat pentru a fi activat
Afișa proprietățile straturilor: Deschide fereastra de proprietăți a unui strat
Expandează tot
Restrânge tot
Decorațiuni
The Decorations of QGIS include the Grid, the Copyright Label, the North Arrow and the Scale Bar. They are used to ‘decorate’ the map by adding cartographic elements.
Grilă
 Grid vă permite să adăugați o rețea de coordonate și să coordonați adnotările din canevasul hărții.
Figure Decorations 1:
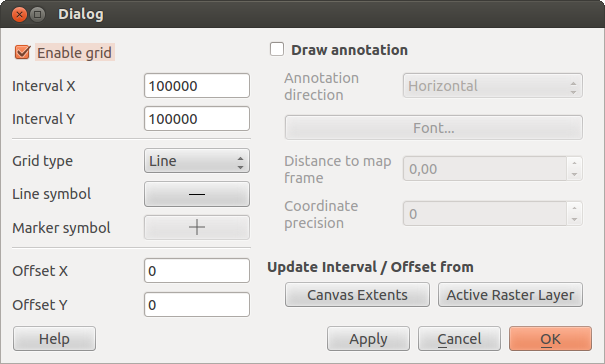
The Grid Dialog
Selectați din meniul View ‣ Decorations ‣ Grid. Se va lansa dialogul (vedeți figure_decorations_1).
Activează caseta
Enable grid și stabiliți definiții de grile în funcție de straturile încărcate în canevasul hărții.Activați caseta
Draw annotations și stabiliți definițiile adnotărilor în conformitate cu straturile încărcate în canevasul hărții.- Click [Apply] to verify that it looks as expected.
- Click [OK] to close the dialog.
Eticheta Drepturilor de Autor
 Copyright label adds a copyright label using the text
you prefer to the map.
Copyright label adds a copyright label using the text
you prefer to the map.
Figure Decorations 2:
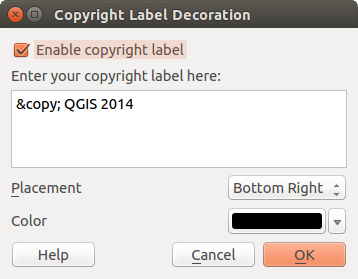
The Copyright Dialog
Selectați din meniul View ‣ Decorations ‣ Copyright Label. Se va lansa dialogul (see figure_decorations_2).
Introduceți textul pe care doriți să-l plasați pe hartă. Puteți folosi HTML, așa cum se arată în exemplu.
- Choose the placement of the label from the Placement
 combo box.
 Asigurați-vă că este bifată caseta
Enable Copyright Label.- Click [OK].
In the example above, which is the default, QGIS places a copyright symbol followed by the date in the lower right-hand corner of the map canvas.
Săgeata Nordului
![]() North Arrow places a simple north arrow on the map canvas.
At present, there is only one style available. You can adjust the angle of the
arrow or let QGIS set the direction automatically. If you choose to let QGIS
determine the direction, it makes its best guess as to how the arrow should be
oriented. For placement of the arrow, you have four options, corresponding to
the four corners of the map canvas.
North Arrow places a simple north arrow on the map canvas.
At present, there is only one style available. You can adjust the angle of the
arrow or let QGIS set the direction automatically. If you choose to let QGIS
determine the direction, it makes its best guess as to how the arrow should be
oriented. For placement of the arrow, you have four options, corresponding to
the four corners of the map canvas.
Figure Decorations 3:
The North Arrow Dialog
Scara Grafică
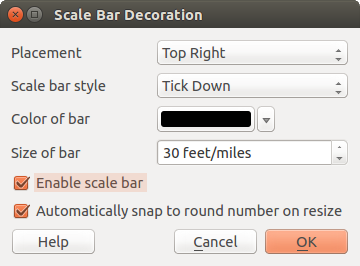
 Scale Bar adds a simple scale bar to the map canvas. You
can control the style and placement, as well as the labeling of the bar.
Scale Bar adds a simple scale bar to the map canvas. You
can control the style and placement, as well as the labeling of the bar.
Figure Decorations 4:
The Scale Bar Dialog
QGIS only supports displaying the scale in the same units as your map frame. So if the units of your layers are in meters, you can’t create a scale bar in feet. Likewise, if you are using decimal degrees, you can’t create a scale bar to display distance in meters.
Pentru a adăuga o scară grafică:
Selectați meniul View ‣ Decorations ‣ Scale Bar. Fereastra de dialog se lansează (vedeți figure_decorations_4).
- Choose the placement from the Placement combo box.
- Choose the style from the Scale bar style
combo box.
- Select the color for the bar Color of bar
 or use
the default black color.
or use
the default black color. - Set the size of the bar and its label Size of bar
 .
. Asigurați-vă că este bifată caseta
Enable scale bar.- Optionally, check Automatically snap to round number
on resize.
- Click [OK].
Tip
Setările Decorațiunilor
Când salvați un proiect .qgs, orice modificări pe care le-ați adus Grilei, Săgeții Nordului, Scării Grafice și drepturilor de autor, vor fi salvate în cadrul proiectului și vor fi restaurate data viitoare când încărcați proiectul.
Instrumente de Adnotare
The  Text Annotation tool in the attribute
toolbar provides the possibility to place formatted text in a balloon on the
QGIS map canvas. Use the Text Annotation tool and click into the
map canvas.
Text Annotation tool in the attribute
toolbar provides the possibility to place formatted text in a balloon on the
QGIS map canvas. Use the Text Annotation tool and click into the
map canvas.
Figure annotation 1:
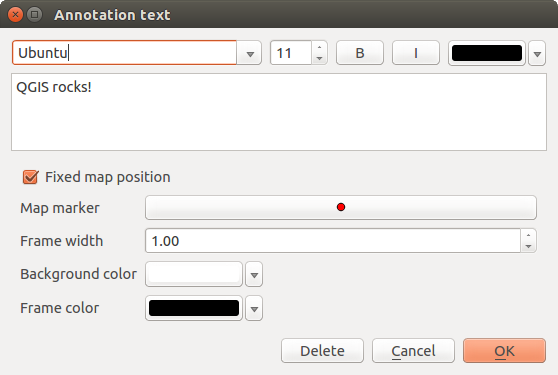
Annotation text dialog
Efectuând dublu clic pe element se va deschide un dialog cu diverse opțiuni. Cu ajutorul editorului de text se va introduce textul formatat și alte setări de elemente. De exemplu, apare opțiunea de a poziționa elementul pe hartă (atribuindu-i un simbol de marcare) sau de a-l poziționa pe ecran (neavând legătură cu harta). Elementul poate fi deplasat prin poziționarea pe hartă (prin glisarea marcajului) sau prin deplasarea numai a balonului. Pictogramele sunt parte a temei GIS, ele fiind utilizate, în mod implicit, și în alte teme.
The  Move Annotation tool allows you to move the
annotation on the map canvas.
Move Annotation tool allows you to move the
annotation on the map canvas.
Adnotări de tip html
The  Html Annotation tools in the attribute
toolbar provides the possibility to place the content of an html file in a
balloon on the QGIS map canvas. Using the Html Annotation tool, click
into the map canvas and add the path to the html file into the dialog.
Html Annotation tools in the attribute
toolbar provides the possibility to place the content of an html file in a
balloon on the QGIS map canvas. Using the Html Annotation tool, click
into the map canvas and add the path to the html file into the dialog.
Adnotări SVG
The  SVG Annotation tool in the attribute toolbar
provides the possibility to place an SVG symbol in a balloon on the QGIS map
canvas. Using the SVG Annotation tool, click into the map canvas and
add the path to the SVG file into the dialog.
SVG Annotation tool in the attribute toolbar
provides the possibility to place an SVG symbol in a balloon on the QGIS map
canvas. Using the SVG Annotation tool, click into the map canvas and
add the path to the SVG file into the dialog.
Adnotări de tip formular
Additionally, you can also create your own annotation forms. The
Form Annotation tool is useful to display
attributes of a vector layer in a customized Qt Designer form (see
figure_custom_annotation). This is similar to the designer forms for the
Identify features tool, but displayed in an annotation item.
Also see this video https://www.youtube.com/watch?v=0pDBuSbQ02o from
Tim Sutton for more information.
Figure annotation 2:
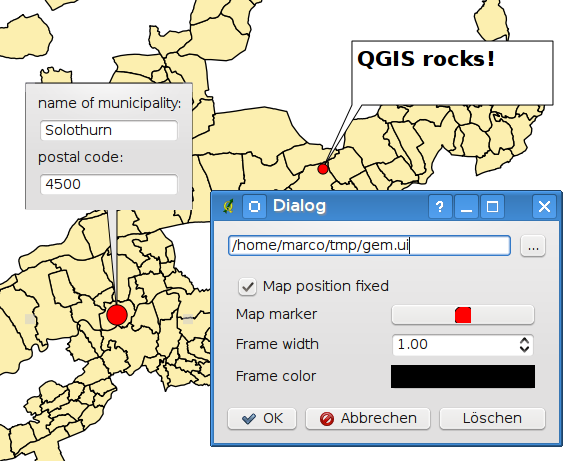
Customized qt designer annotation form
Note
Dacă apăsați Ctrl+T, atât timp cât instrumentul Annotation este activ (deplasare adnotare, adnotare text, formular de adnotare), starea de vizibilitate a elementelor este inversată.
Semne de Carte Spațiale
Spatial Bookmarks allow you to “bookmark” a geographic location and return to it later.
Crearea unui Semn de Carte
Pentru a crea un semn de carte:
Deplasare sau transfocare în zona de interes.
- Select the menu option View ‣ New Bookmark or press Ctrl-B.
Introduceți un nume descriptiv pentru marcaj (până la 255 de caractere).
- Press Enter to add the bookmark or [Delete] to remove the bookmark.
Rețineți că puteți avea mai multe marcaje cu același nume.
Lucrul cu Marcaje
To use or manage bookmarks, select the menu option View ‣ Show Bookmarks. The Geospatial Bookmarks dialog allows you to zoom to or delete a bookmark. You cannot edit the bookmark name or coordinates.
Zooming to a Bookmark
From the Geospatial Bookmarks dialog, select the desired bookmark by clicking on it, then click [Zoom To]. You can also zoom to a bookmark by double-clicking on it.
Deleting a Bookmark
To delete a bookmark from the Geospatial Bookmarks dialog, click on it, then click [Delete]. Confirm your choice by clicking [Yes], or cancel the delete by clicking [No].
Import or export a bookmark
To share or transfer your bookmarks between computers you can use the Share pull down menu in the Geospatial Bookmarks dialog.
Imbricarea Proiectelor
Dacă doriți să încorporați conținutul din alte fișiere de proiect în proiectul dumneavoastră, puteți alege Layer ‣ Embed Layers and Groups.
Încapsularea straturilor
Urmatorul dialog vă permite să încorporați straturile din alte proiecte. Iată un mic exemplu:
- Press
 to look for another project from the Alaska dataset.
 - Select the project file grassland. You can see the content of the project (see figure_embed_dialog).
- Press Ctrl and click on the layers grassland and regions. Press [OK]. The selected layers are embedded in the map legend and the map view now.
Figure Nesting 1:
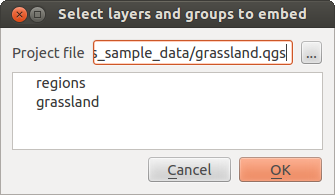
Select layers and groups to embed
Atât timp cât straturile încapsulate sunt editabile, nu le puteți schimba proprietățile, cum ar fi stilul și etichetarea.
Eliminare straturi încapsulate
Right-click on the embedded layer and choose  Remove.