.
QGIS GUI
When QGIS starts, you are presented with the GUI as shown in the figure (the numbers 1 through 5 in yellow circles are discussed below).
Figure QGIS GUI 1:
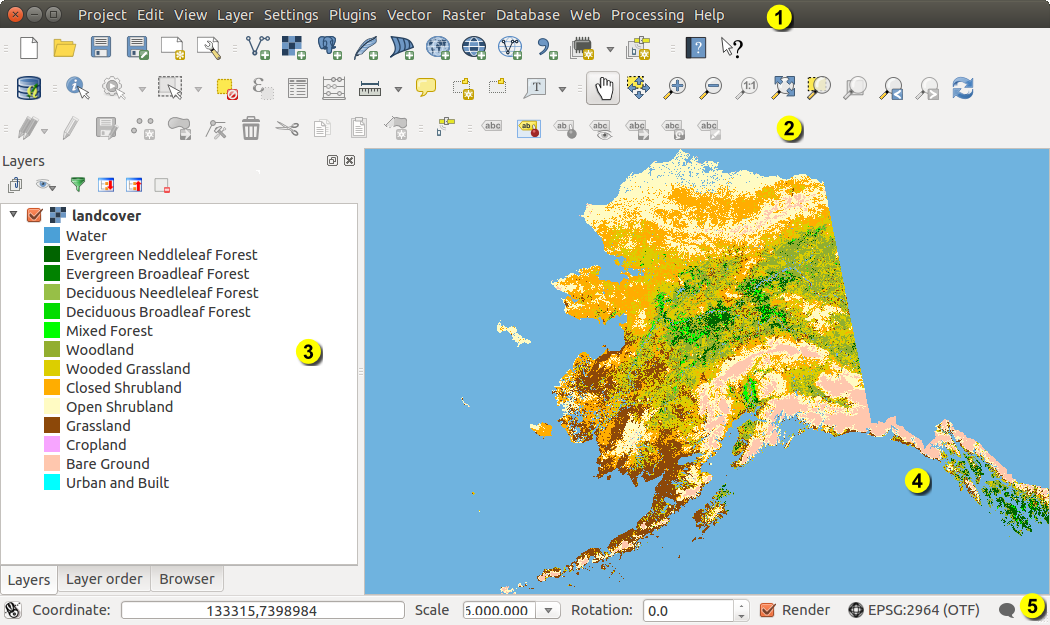
QGIS GUI with Alaska sample data 
ノート
ウィンドウの装飾(タイトルバーとか)は利用している オペレーティングシステムやウィンドウマネージャによって見かけが異なります.
The QGIS GUI is divided into five areas:
メニューバー
- Tool Bar
- Map Legend
地図ビュー
ステータスバー
These five components of the QGIS interface are described in more detail in the following sections. Two more sections present keyboard shortcuts and context help.
メニューバー
The menu bar provides access to various QGIS features using a standard hierarchical menu. The top-level menus and a summary of some of the menu options are listed below, together with the associated icons as they appear on the toolbar, and keyboard shortcuts. The shortcuts presented in this section are the defaults; however, keyboard shortcuts can also be configured manually using the Configure shortcuts dialog, opened from Settings ‣ Configure Shortcuts....
ほとんどのメニューオプションはツールに対応しているけど,逆に対応していないこともあります,メニューはツールバーのようには構成されていません.ツールバーはそれぞれのチェックボックスエントリとしてあらわされているメニューオプションのリストツールを含んでいます.いくつかのメニューオプションは対応するプラグインがロードされている時のみ表示されます.ツールとツールバーについてのさらに詳しい情報は ツールバー 節を参照して下さい.
プロジェクト
メニューオプション |
ショートカット |
リファレンス |
ツールバー |
|---|---|---|---|
 New New |
Ctrl+N |
see プロジェクト | プロジェクト |
 Open Open |
Ctrl+O |
see プロジェクト | プロジェクト |
テンプレートを基に新規作成 ‣ |
see プロジェクト | プロジェクト |
|
| Open Recent ‣ | see プロジェクト | ||
 Save Save |
Ctrl+S |
see プロジェクト | プロジェクト |
 Save As... Save As... |
Ctrl+Shift+S |
see プロジェクト | プロジェクト |
 Save as Image... Save as Image... |
see 出力 | ||
| DXF Export ... | see 出力 | ||
 New Print Composer New Print Composer |
Ctrl+P |
see プリントコンポーザ | プロジェクト |
 Composer manager ... Composer manager ... |
see プリントコンポーザ | プロジェクト |
|
プリントコンポーザ ‣ |
see プリントコンポーザ | ||
 Exit QGIS Exit QGIS |
Ctrl+Q |
編集
メニューオプション |
ショートカット |
リファレンス |
ツールバー |
|---|---|---|---|
 Undo Undo |
Ctrl+Z |
see 高度なデジタイジング | 先進的なデジタイズ |
 Redo Redo |
Ctrl+Shift+Z |
see 高度なデジタイジング | 先進的なデジタイズ |
 Cut Features Cut Features |
Ctrl+X |
see 既存レイヤのデジタイズ | デジタジング |
 Copy Features Copy Features |
Ctrl+C |
see 既存レイヤのデジタイズ | デジタジング |
 Paste Features Paste Features |
Ctrl+V |
see 既存レイヤのデジタイズ | デジタジング |
新規レイヤへの地物貼り付け ‣ |
|||
 Add Feature Add Feature |
Ctrl+. |
see 既存レイヤのデジタイズ | デジタジング |
 Move Feature(s) Move Feature(s) |
see 既存レイヤのデジタイズ | デジタジング |
|
 Delete Selected Delete Selected |
see 既存レイヤのデジタイズ | デジタジング |
|
 Rotate Feature(s) Rotate Feature(s) |
see 高度なデジタイジング | 先進的なデジタイズ |
|
 Simplify Feature Simplify Feature |
see 高度なデジタイジング | 先進的なデジタイズ |
|
 Add Ring Add Ring |
see 高度なデジタイジング | 先進的なデジタイズ |
|
 Add Part Add Part |
see 高度なデジタイジング | 先進的なデジタイズ |
|
 Fill Ring Fill Ring |
see 高度なデジタイジング | 先進的なデジタイズ |
|
 Delete Ring Delete Ring |
see 高度なデジタイジング | 先進的なデジタイズ |
|
 Delete Part Delete Part |
see 高度なデジタイジング | 先進的なデジタイズ |
|
 Reshape Features Reshape Features |
see 高度なデジタイジング | 先進的なデジタイズ |
|
 Offset Curve Offset Curve |
see 高度なデジタイジング | 先進的なデジタイズ |
|
 Split Features Split Features |
see 高度なデジタイジング | 先進的なデジタイズ |
|
 Split Parts Split Parts |
see 高度なデジタイジング | 先進的なデジタイズ |
|
 Merge Selected Features Merge Selected Features |
see 高度なデジタイジング | 先進的なデジタイズ |
|
| Merge Attr. of Selected Features |
see 高度なデジタイジング | 先進的なデジタイズ |
|
 Node Tool Node Tool |
see 既存レイヤのデジタイズ | デジタジング |
|
| Rotate Point Symbols |
see 高度なデジタイジング | 先進的なデジタイズ |
After activating  Toggle editing mode for a layer,
you will find the
Toggle editing mode for a layer,
you will find the Add Feature icon in the Edit menu
depending on the layer type (point, line or polygon).
編集(おまけ)
メニューオプション |
ショートカット |
リファレンス |
ツールバー |
|---|---|---|---|
| Add Feature |
see 既存レイヤのデジタイズ | デジタジング |
|
 Add Feature Add Feature |
see 既存レイヤのデジタイズ | デジタジング |
|
 Add Feature Add Feature |
see 既存レイヤのデジタイズ | デジタジング |
ビュー
メニューオプション |
ショートカット |
リファレンス |
ツールバー |
|---|---|---|---|
 Pan Map Pan Map |
地図ナビゲーション |
||
 Pan Map to Selection Pan Map to Selection |
地図ナビゲーション |
||
 Zoom In Zoom In |
Ctrl++ |
地図ナビゲーション |
|
 Zoom Out Zoom Out |
Ctrl+- |
地図ナビゲーション |
|
選択 ‣ |
see 地物の選択と選択解除 | 属性 |
|
 Identify Features Identify Features |
Ctrl+Shift+I |
属性 |
|
計測 ‣ |
see 計測 | 属性 |
|
 Zoom Full Zoom Full |
Ctrl+Shift+F |
地図ナビゲーション |
|
 Zoom To Layer Zoom To Layer |
地図ナビゲーション |
||
 Zoom To Selection Zoom To Selection |
Ctrl+J |
地図ナビゲーション |
|
 Zoom Last Zoom Last |
地図ナビゲーション |
||
 Zoom Next Zoom Next |
地図ナビゲーション |
||
 Zoom Actual Size Zoom Actual Size |
地図ナビゲーション |
||
地図整飾 ‣ |
整飾 参照 |
||
| Preview mode ‣ | |||
 Map Tips Map Tips |
属性 |
||
 New Bookmark New Bookmark |
Ctrl+B |
see 空間ブックマーク | 属性 |
 Show Bookmarks Show Bookmarks |
Ctrl+Shift+B |
see 空間ブックマーク | 属性 |
 Refresh Refresh |
F5 |
地図ナビゲーション |
レイヤ
メニューオプション |
ショートカット |
リファレンス |
ツールバー |
|---|---|---|---|
| Create Layer ‣ | 新しいベクタレイヤの作成 を参照 |
レイヤの管理 |
|
| Add Layer ‣ | レイヤの管理 |
||
| Embed Layers and Groups ... | see プロジェクトの入れ子 | ||
| Add from Layer Definition File ... | |||
| Copy style |
see スタイルメニュー | ||
| Paste style |
see スタイルメニュー | ||
 Open Attribute Table Open Attribute Table |
属性 |
||
| Toggle Editing |
see 既存レイヤのデジタイズ | デジタジング |
|
| Save Layer Edits |
see 既存レイヤのデジタイズ | デジタジング |
|
 Current Edits ‣ Current Edits ‣ |
see 既存レイヤのデジタイズ | デジタジング |
|
| Save as... | |||
| Save as layer definition file... | |||
 Remove Layer/Group Remove Layer/Group |
Ctrl+D |
||
 Duplicate Layers (s) Duplicate Layers (s) |
|||
| Set Scale Visibility of Layers | |||
| Set CRS of Layer(s) | Ctrl+Shift+C |
||
| Set project CRS from Layer | |||
| Properties ... | |||
| Query... | |||
 Labeling Labeling |
|||
 Add to Overview Add to Overview |
Ctrl+Shift+O |
レイヤの管理 |
|
 Add All To Overview Add All To Overview |
|||
 Remove All From Overview Remove All From Overview |
|||
 Show All Layers Show All Layers |
Ctrl+Shift+U |
レイヤの管理 |
|
 Hide All Layers Hide All Layers |
Ctrl+Shift+H |
レイヤの管理 |
|
| Show selected Layers |
|||
| Hide selected Layers |
設定
メニューオプション |
ショートカット |
リファレンス |
ツールバー |
|---|---|---|---|
パネル ‣ |
see Panels and Toolbars | ||
ツールバー ‣ |
see Panels and Toolbars | ||
| Toggle Full Screen Mode | F 11 |
||
 Project Properties ... Project Properties ... |
Ctrl+Shift+P |
see プロジェクト | |
 Custom CRS ... Custom CRS ... |
see カスタム空間参照システム | ||
スタイルマネージャ... |
see Presentation | ||
 Configure shortcuts ... Configure shortcuts ... |
|||
| Customization ... |
see カスタマイゼーション | ||
| Options ... |
オプション 参照 |
||
| Snapping Options ... |
プラグイン
メニューオプション |
ショートカット |
リファレンス |
ツールバー |
|---|---|---|---|
 Manage and Install Plugins ... Manage and Install Plugins ... |
see プラグインダイアログ | ||
| Python Console | Ctrl+Alt+P |
When starting QGIS for the first time not all core plugins are loaded.
ベクタ
メニューオプション |
ショートカット |
リファレンス |
ツールバー |
|---|---|---|---|
オープンストリートマップ ‣ |
see OpenStreetMapベクタの読み込み | ||
|
see fToolsプラグイン | ||
|
see fToolsプラグイン | ||
|
see fToolsプラグイン | ||
|
see fToolsプラグイン | ||
|
see fToolsプラグイン |


When starting QGIS for the first time not all core plugins are loaded.
ラスタ
メニューオプション |
ショートカット |
リファレンス |
ツールバー |
|---|---|---|---|
| Raster calculator ... | see ラスタ計算機 |
When starting QGIS for the first time not all core plugins are loaded.
Database
メニューオプション |
ショートカット |
リファレンス |
ツールバー |
|---|---|---|---|
| Database ‣ | see DB マネージャプラグイン | Database |
When starting QGIS for the first time not all core plugins are loaded.
Web
メニューオプション |
ショートカット |
リファレンス |
ツールバー |
|---|---|---|---|
| Metasearch | see MetaSearch Catalogue Client | Web |
When starting QGIS for the first time not all core plugins are loaded.
プロセシング
メニューオプション |
ショートカット |
リファレンス |
ツールバー |
|---|---|---|---|
 Toolbox Toolbox |
see ツールボックス | ||
 Graphical Modeler ... Graphical Modeler ... |
グラフィカルモデラー 参照 |
||
 History and log ... History and log ... |
see 履歴マネージャ | ||
 Options ... Options ... |
|||
 Results viewer ... Results viewer ... |
see 外部アプリケーションの設定 | ||
 Commander Commander |
Ctrl+Alt+M |
QGISコマンダー 参照 |
When starting QGIS for the first time not all core plugins are loaded.
ヘルプ
メニューオプション |
ショートカット |
リファレンス |
ツールバー |
|---|---|---|---|
 Help Contents Help Contents |
F1 |
ヘルプ |
|
 What’s This? What’s This? |
Shift+F1 |
ヘルプ |
|
| API Documentation | |||
| Need commercial support? | |||
 QGIS Home Page QGIS Home Page |
Ctrl+H |
||
 Check QGIS Version Check QGIS Version |
|||
 About About |
|||
 QGIS Sponsors QGIS Sponsors |
Please note that for Linux , the menu bar items listed above are the
default ones in the KDE window manager. In GNOME, the Settings menu
has different content and its items have to be found here:
| Custom CRS |
Edit |
| Style Manager | Edit |
| Configure Shortcuts |
Edit |
| Customization |
Edit |
| Options |
Edit |
| Snapping Options ... | Edit |
ツールバー
ツールバーではメニューのほとんどと同じ機能を提供している上に対話的に地図を操作する機能を提供しています.ツールバーのそれぞれのアイテムではポップアップヘルプが提供されています.マウスでアイテムの上を動かすとツールの簡単な説明が表示されます.
Every menu bar can be moved around according to your needs. Additionally, every menu bar can be switched off using your right mouse button context menu, holding the mouse over the toolbars (read also Panels and Toolbars).
ちなみに
ツールバーの復元
If you have accidentally hidden all your toolbars, you can get them
back by choosing menu option Settings ‣ Toolbars ‣.
If a toolbar disappears under Windows, which seems to be a problem in
QGIS from time to time, you have to remove key
\HKEY_CURRENT_USER\Software\QGIS\qgis\UI\state in the registry.
When you restart QGIS, the key is written again with the default state,
and all toolbars are visible again.
Map Legend
The map legend area lists all the layers in the project. The checkbox in each legend entry can be used to show or hide the layer. The Legend toolbar in the map legend are list allow you to Add group, Manage Layer Visibility of all layers or manage preset layers combination, Filter Legend by Map Content, Expand All or Collapse All and Remove Layer or Group.
Figure Layer tools Bar:
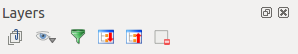
Layer Tool Bar in Map Legend
The button  allows you to add Presets views in the legend. It means that you can choose to display some layer with specific categorization and add this view to the Presets list. To add a preset view just click on , choose Add Preset... from the drop down menu and give a name to the preset. After that you will see a list with all the presets that you can recall pressing on the button.
All the added presets are also present in the map composer in order to allow you to create a map layout based on your specific views (see メインプロパティ).
レイヤは選択してドラッグで上下に移動することによってZオーダリングを変えることができます.Zオーダリングとは,凡例のリストでの表示順が地図表示のレイヤ表示順になることです.
ノート
This behaviour can be overridden by the ‘Layer order’ panel.
Layers in the legend window can be organised into groups. There are two ways to do this:
- Press the
 icon to add a new group. Type in a name for
the group and press
icon to add a new group. Type in a name for
the group and press Enter. Now click on an existing layer and drag it onto the group. 凡例ウィンドウでいくつかのレイヤを選択してマウス右ボタンをクリックして Group Selected を選択して下さい.選択されたレイヤで自動的に新しいグループが作られます.
あるレイヤをグループからはずしたい場合はレイヤ名をドラッグしてグループ外に持っていくかマウス右ボタンクリックして Make to toplevel item を選択して下さい.グループは他のグループからネストすることができます.
グループ用チェックボックスを使うとグループ内全レイヤの表示,非表示を1回のクリックで行えます.
The content of the right mouse button context menu depends on whether the
selected legend item is a raster or a vector layer. For GRASS vector layers,
Toggle editing is not available. See section
GRASSベクタレイヤのデジタイジングと編集 for information on editing GRASS vector layers.
Right mouse button menu for raster layers
- Zoom to Layer
- Show in overview
- Zoom to Best Scale (100%)
- Remove
- Duplicate
- Set Layer Scale Visibility
- Set Layer CRS
レイヤのCRS をプロジェクトに設定する
- Styles ‣
- Save as ...
- Save As Layer Definition File ...
プロパティ
改名
Additionally, according to layer position and selection
- Move to Top-level
選択されたレイヤをグループにする
Right mouse button menu for vector layers
- Zoom to Layer
- Show in overview
- Remove
- Duplicate
- Set Layer Scale Visibility
- Set Layer CRS
レイヤのCRS をプロジェクトに設定する
- Styles ‣
- Open Attribute Table
- Toggle Editing (not available for GRASS layers)
- Save As ...
- Save As Layer Definition Style
フィルター
- Show Feature Count
プロパティ
改名
Additionally, according to layer position and selection
- Move to Top-level
選択されたレイヤをグループにする
Right mouse button menu for layer groups
- Zoom to Group
- Remove
- Set Group CRS
改名
- Add Group
It is possible to select more than one layer or group at the same time by
holding down the Ctrl key while selecting the layers with the left mouse
button. You can then move all selected layers to a new group at the same time.
You may also delete more than one layer or group at once by selecting
several layers with the Ctrl key and pressing Ctrl+D afterwards.
This way, all selected layers or groups will be removed from the layers list.
レイヤの標示順序から独立した凡例の操作
There is a panel that allows you to define an independent drawing order for the map legend.
You can activate it in the menu Settings ‣ Panels ‣ Layer
order. This feature allows you to, for instance, order your layers in order of importance,
but still display them in the correct order (see figure_layer_order).
Checking the  Control rendering order box underneath the
list of layers will cause a revert to default behavior.
Control rendering order box underneath the
list of layers will cause a revert to default behavior.
Figure Layer Order:
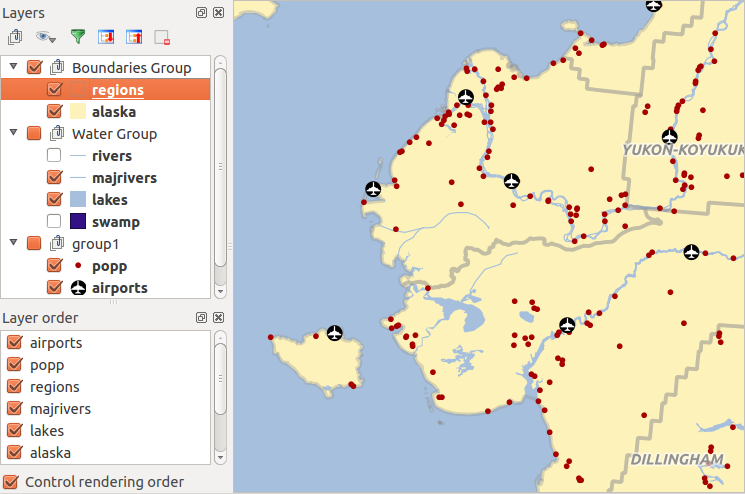
Define a legend independent layer order
地図ビュー
This is the “business end” of QGIS — maps are displayed in this area! The map displayed in this window will depend on the vector and raster layers you have chosen to load (see sections that follow for more information on how to load layers). The map view can be panned, shifting the focus of the map display to another region, and it can be zoomed in and out. Various other operations can be performed on the map as described in the toolbar description above. The map view and the legend are tightly bound to each other — the maps in view reflect changes you make in the legend area.
ちなみに
マウスホィールを使って地図をズームします
マウスホィールを使って地図のズームインとズームアウトを行うことができます. マウスカーソルを地図エリアの中に置きホィールを前方(あなたの側から)ロールするとズームインを行えます,そして手前に(あなたの側に)ロールするとズームアウトします. マウスカーソルの位置がズームの中心になります. マウスホィールのズーム動作については Settings ‣ Options メニューの Map tools タブでカスタマイズができます.
ちなみに
矢印キーとスペースバーを使った地図パンニング
矢印キーを使ってパンを行うことができます. マウスカーソルを地図エリアにおきクリックした後右矢印キーを押すと東にパンします,左矢印キーを押すと西にパンします,上矢印キーを押すと北にパンします.下矢印キーを押すと南にパンします.またスペースバーかマウスホィールを使ってパンを行うことができます.この場合スペースバーを押しながらマウスを動かすかマウスホィールをクリックして下さい.
ステータスバー
The status bar shows you your current position in map coordinates (e.g., meters or decimal degrees) as the mouse pointer is moved across the map view. To the left of the coordinate display in the status bar is a small button that will toggle between showing coordinate position or the view extents of the map view as you pan and zoom in and out.
Next to the coordinate display you will find the scale display. It shows the scale of the map view. If you zoom in or out, QGIS shows you the current scale. There is a scale selector, which allows you to choose between predefined scales from 1:500 to 1:1000000.
To the right of the scale display you can define a current clockwise rotation for your map view in degrees.
A progress bar in the status bar shows the progress of rendering as each layer is drawn to the map view. In some cases, such as the gathering of statistics in raster layers, the progress bar will be used to show the status of lengthy operations.
If a new plugin or a plugin update is available, you will see a message at the
far left of the status bar. On the right side of the status bar, there is a small
checkbox which can be used to temporarily prevent layers being rendered to the
map view (see section レンダリング below). The icon  immediately stops the current map rendering process.
To the right of the render functions, you find the EPSG code of the current project CRS and a projector icon. Clicking on this opens the projection properties for the current project.
ちなみに
マップキャンバスにおける正しい縮尺を計算する
When you start QGIS, the default units are degrees, and this means that QGIS will interpret any
coordinate in your layer as specified in degrees. To get correct scale values, you can
either change this setting to meters manually in the General tab
under Settings ‣ Project Properties, or you can select a
project CRS clicking on the  Current CRS: icon in the
lower right-hand corner of the status bar. In the last case, the units are set to what the
project projection specifies (e.g., ‘+units=m’).
Current CRS: icon in the
lower right-hand corner of the status bar. In the last case, the units are set to what the
project projection specifies (e.g., ‘+units=m’).