7.1. Lesson: Reprojeter et transformer des données
Parlons de nouveau des Systèmes de Coordonnées de Référence (SCR). Nous en avons touché quelques mots auparavant, mais nous n’avons pas discuté de ce que cela signifie en pratique.
Le but de cette leçon : Reprojeter et transformer des jeux des données.
7.1.1.  Follow Along: Projections
Le SCR that all the data as well as the map itself are in right now is called WGS84. C’est un Système de Coordonnées Géodésique (SCG) très fréquent pour représenter de la donnée. Mais comme nous allons le voir, il y a un problème.
- Save your current map.
- Then open the map of the world which you’ll find under
exercise_data/world/world.qgs. - Zoom in to South Africa by using the Zoom In tool.
- Try setting a scale in the Scale field, which is in the
Status Bar along the bottom of the screen. While over South
Africa, set this value to
1:5000000(one to five million). - Pan around the map while keeping an eye on the Scale field.
Notice the scale changing? That’s because you’re moving away from the one point
that you zoomed into at 1:5000000, which was at the center of your
screen. All around that point, the scale is different.
Pour comprendre pourquoi, pensez au globe terrestre. Il y a des lignes imaginaires s’étendant du Nord au Sud. Ce sont les lignes de longitude qui sont éloignées à l’équateur, mais qui se rejoignent aux pôles.
Dans un SCG, vous travaillez sur cette sphère, mais votre écran lui reste plat. Lorsque vous représentez une sphère sur une surface plane, de la distorsion apparaît, comme ce qu’il arriverait si vous coupiez une balle de tennis et que vous tentiez de l’aplatir. Sur une carte, cela signifierait que les lignes de longitude resteraient parallèles, même aux pôles (où elles sont supposées se rencontrer). Ce qui signifie qu’au fur et à mesure que vous vous éloignez de l’équateur, l’échelle des objets sera de plus en plus grande. Dans notre cas, cela signifie qu’il n’y a pas d’échelle constante sur notre carte !
Pour résoudre ce problème, utilisons à la place un Système de Coordonnées Projeté (SCP). Un SCP “projette” ou convertit la donnée de manière à prendre en compte les changements d’échelle et de les corriger. Par conséquent, pour garder une échelle constante, nous devrons reprojeter nos données et utiliser un SCP.
7.1.2.  Follow Along: La reprojection ‘à la volée’
QGIS allows you to reproject data “on the fly”. What this means is that even if the data itself is in another CRS, QGIS can project it as if it were in a CRS of your choice.
- To enable “on the fly” projection, click on the CRS Status button in the Status Bar along the bottom of the QGIS window:

- In the dialog that appears, check the box next to Enable ‘on the fly’ CRS transformation.
- Type the word
globalinto the Filter field. One CRS (NSIDC EASE-Grid Global) should appear in the list below. - Click on the NSIDC EASE-Grid Global to select it, then click
OK. Remarquez comment la forme de l’Afrique du Sud change. Toutes les projections fonctionnent en modifiant la forme apparente des objets sur Terre.
- Zoom in to a scale of
1:5000000again, as before. Déplacez vous sur la carte.
Notez que l’échelle reste fixe !
La reprojection ‘à la volée’ est également utilisée pour visualiser des jeux de données ayant des SCR différents.
- Deactivate “on the fly” re-projection again:
- Click on the CRS Status button again.
- Un-check the Enable ‘on the fly’ CRS transformation box.
- Clicking OK.
- In QGIS 2.0, the ‘on the fly’ reprojection is automatically activated when
layers with different CRSs are loaded in the map. To understand what
‘on the fly’ reprojection does, deactivate this automatic setting:
- Go to Settings ‣ Options...
- On the left panel of the dialog, select CRS.
- Un-check Automatically enable ‘on the fly’ reprojection if layers have different CRS.
- Click OK.
- Add another vector layer to your map which has the data for South Africa
only. You’ll find it as
exercise_data/world/RSA.shp.
Que remarquez-vous ?
The layer isn’t visible! But that’s easy to fix, right?
- Right-click on the RSA layer in the Layers list.
- Select Zoom to Layer Extent.
OK, so now we see South Africa... but where is the rest of the world?
It turns out that we can zoom between these two layers, but we can’t ever see
them at the same time. That’s because their Coordinate Reference Systems are so
different. The continents dataset is in degrees, but the
RSA dataset is in meters. So, let’s say that a given point in
Cape Town in the RSA dataset is about 4 100 000 meters away
from the equator. But in the continents dataset, that same point is
about 33.9 degrees away from the equator.
This is the same distance - but QGIS doesn’t know that. You haven’t told it to
reproject the data. So as far as it’s concerned, the version of South Africa
that we see in the RSA dataset has Cape Town at the correct
distance of 4 100 000 meters from the equator. But in the
continents dataset, Cape Town is only 33.9 meters away
from the equator! You can see why this is a problem.
QGIS doesn’t know where Cape Town is supposed to be - that’s what the data
should be telling it. If the data tells QGIS that Cape Town is 34 meters
away from the equator and that South Africa is only about 12 meters from
north to south, then that is what QGIS will draw.
To correct this:
- Click on the CRS Status button again and switch Enable ‘on the fly’ CRS transformation on again as before.
- Zoom to the extents of the RSA dataset.
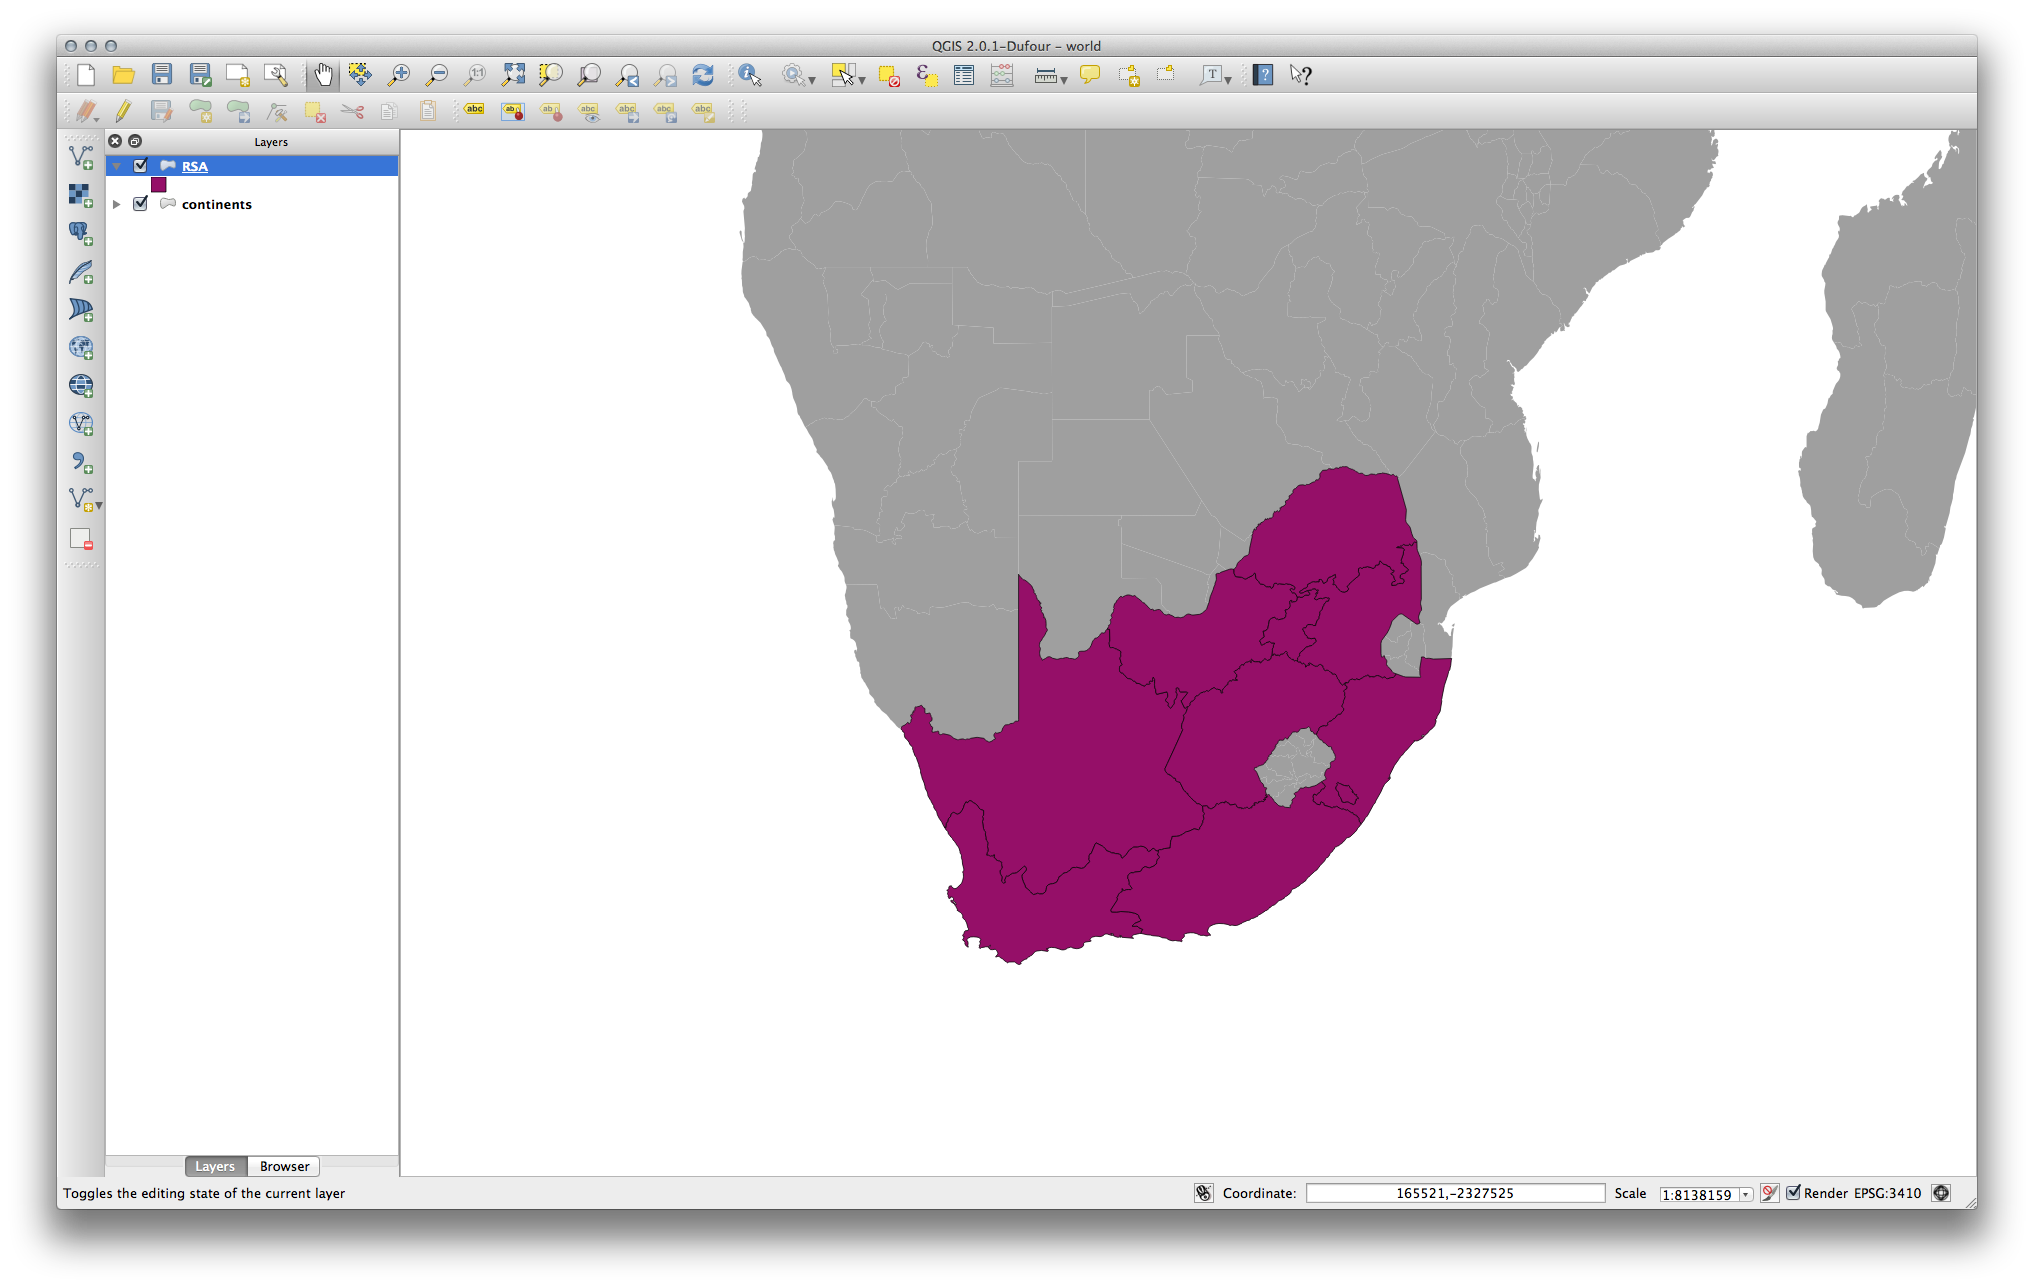
Now, because they’re made to project in the same CRS, the two datasets fit perfectly:

When combining data from different sources, it’s important to remember that they might not be in the same CRS. “On the fly” reprojection helps you to display them together.
Before you go on, you probably want to have the ‘on the fly’ reprojection to be automatically activated whenever you open datasets having different CRS:
- Open again Settings ‣ Options... and select CRS.
- Activate Automatically enable ‘on the fly’ reprojection if layers have different CRS.
7.1.3.  Follow Along: Enregistrer un jeu de données dans un autre SCR
Remember when you calculated areas for the buildings in the Classification lesson? You did it so that you could classify the buildings according to area.
- Open your usual map again (containing the Swellendam data).
- Open the attribute table for the buildings layer.
- Scroll to the right until you see the
AREAfield.
Notice how the areas are all very small; probably zero. This is because these areas are given in degrees - the data isn’t in a Projected Coordinate System. In order to calculate the area for the farms in square meters, the data has to be in square meters as well. So, we’ll need to reproject it.
But it won’t help to just use ‘on the fly’ reprojection. ‘On the fly’ does what it says - it doesn’t change the data, it just reprojects the layers as they appear on the map. To truly reproject the data itself, you need to export it to a new file using a new projection.
- Right-click on the buildings layer in the Layers list.
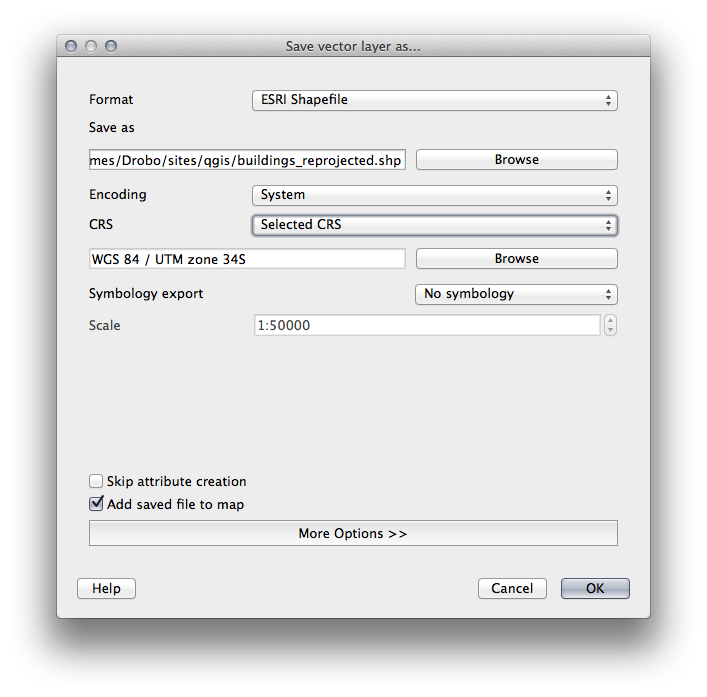
- Select Save As... in the menu that appears. You will be shown the Save vector layer as... dialog.
- Click on the Browse button next to the Save as field.
- Navigate to
exercise_data/and specify the name of the new layer asbuildings_reprojected.shp. - Leave the Encoding unchanged.
- Change the value of the Layer CRS dropdown to Selected CRS.
- Click the Browse button beneath the dropdown.
- The CRS Selector dialog will now appear.
- In its Filter field, search for
34S. - Choose WGS 84 / UTM zone 34S from the list.
- Leave the Symbology export unchanged.
The Save vector layer as... dialog now looks like this:

- Click OK.
- Start a new map and load the reprojected layer you just created.
Refer back to the lesson on Classification to remember how you calculated areas.
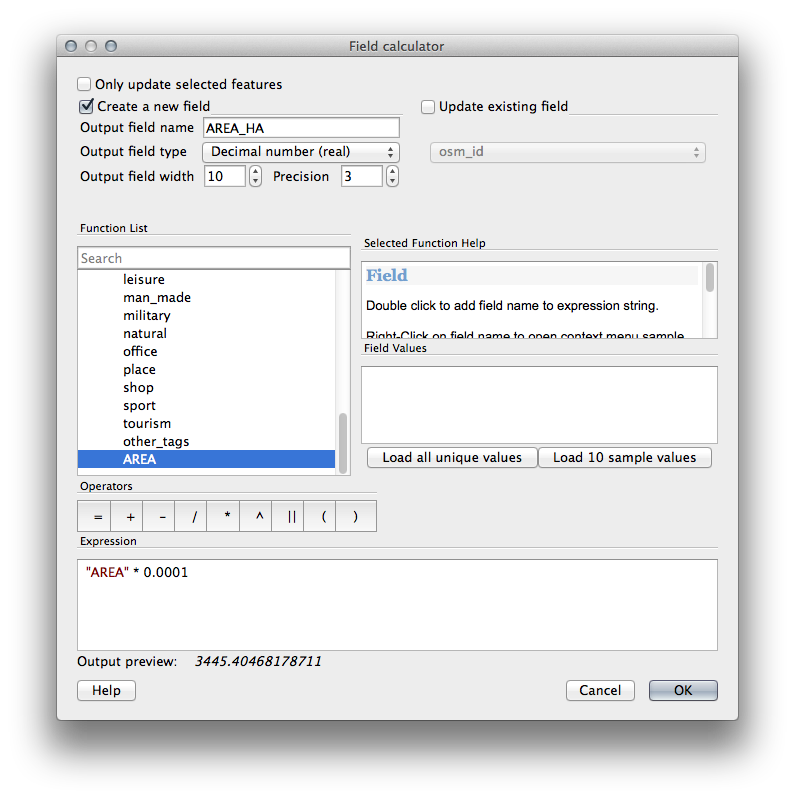
- Update (or add) the
AREAfield by running the same expression as before:

This will add an AREA field with the size of each building
in square meters
- To calculate the area in another unit of measurement, for example hectares,
use the
AREAfield to create a second column:

Look at the new values in your attribute table. This is much more useful, as people actually quote building size in meters, not in degrees. This is why it’s a good idea to reproject your data, if necessary, before calculating areas, distances, and other values that are dependent on the spatial properties of the layer.
7.1.4.  Follow Along: Créez votre propre projection
Il existe beaucoup plus de projections que celles incluses dans QGIS par défaut. Vous pouvez également créer vos propres projections.
- Start a new map.
- Load the
world/oceans.shpdataset. - Go to Settings ‣ Custom CRS... and you’ll see this dialog:

- Click on the Add new CRS button to create a new projection.
An interesting projection to use is called Van der Grinten I.
- Enter its name in the Name field.
Cette projection représente la Terre dans un champ circulaire plutôt que rectangulaire, comme la plupart des autres projections.
- For its parameters, use the following string:
+proj=vandg +lon_0=0 +x_0=0 +y_0=0 +R_A +a=6371000 +b=6371000 +units=m +no_defs

- Click OK.
- Enable “on the fly” reprojection.
- Choose your newly defined projection (search for its name in the Filter field).
En appliquant la projection, voici ce à quoi doit ressembler la carte :

7.1.5. In Conclusion
Différentes projections sont utiles à différentes fins. En choisissant une projection correcte, vous vous assurez que les entités de votre carte seront représentées de manière précise.
7.1.6. Further Reading
Materials for the Advanced section of this lesson were taken from this article.
Further information on Coordinate Reference Systems is available here.
7.1.7. What’s Next?
Dans la prochaine leçon, vous allez apprendre comment analyser des données vectorielles en utilisant les différents outils de QGIS.