QGIS GUI
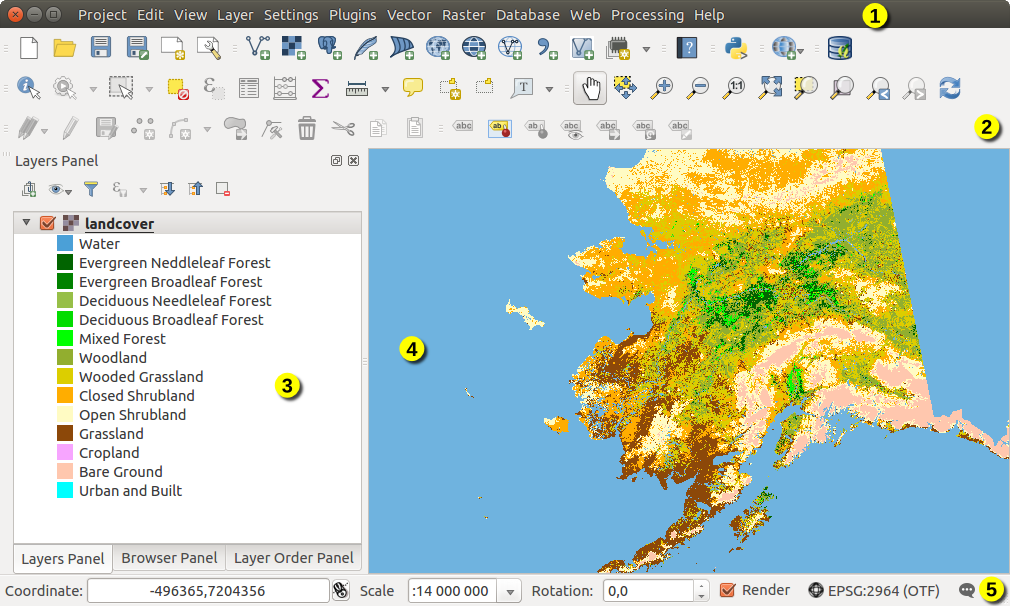
When QGIS starts, you are presented with the GUI as shown in the figure (the numbers 1 through 5 in yellow circles are discussed below).
Figure QGIS GUI 1:

Interfața QGIS cu datele eșantion pentru Alaska
Note
Aspectul ferestrelor (bara de titlu, etc) poate fi diferit, în funcție de sistemul de operare și de managerul de ferestre.
Interfața grafică a QGIS GUI este împărțită în cinci:
Bara de Meniuri
Bare de instrumente
Panouri
Vizualizare Hartă
Bara de Stare
Aceste cinci componente ale interfeței QGIS sunt descrise mai detaliat în următoarele secțiuni. Două secțiuni suplimentare vor prezenta combinațiile de taste pentru comenzile rapide și ajutorul contextual.
Panouri și Bare de Instrumente
From the View menu (Settings under KDE), you can switch on and off QGIS widgets (Panels ‣) or toolbars (Toolbars ‣). You can (de)activate any of them by right-clicking the menu bar or a toolbar and choose the item you want. Each panel or toolbar can be moved and placed wherever you feel comfortable with in QGIS interface. The list can also be extended with the activation of Core or external plugins.
Bare de instrumente
Bara de instrumente oferă acces la cele mai multe dintre funcții ca și meniurile, plus câteva instrumente suplimentare pentru a interacționa cu harta. Fiecare element din bara de instrumente are disponibilă o fereastră de tip pop-up. Țineți mouse-ul deasupra elementului și va fi afișată o scurtă descriere a funcționalității instrumentului.
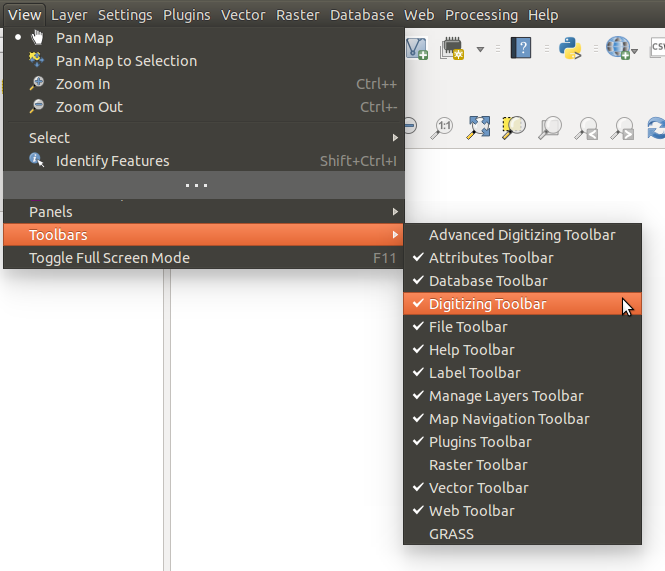
Every toolbar can be moved around according to your needs. Additionally, they can be switched off using the right mouse button context menu, or by holding the mouse over the toolbars.
Figure Toolbars:

Meniul barei de instrumente
Tip
Restaurare bare de instrumente
If you have accidentally hidden a toolbar, you can get it back by choosing menu option View ‣ Toolbars ‣ (or Settings ‣ Toolbars ‣ under Linux KDE). If for some reason a toolbar (or any other widget) totally disappears from the interface, you’ll find tips to get it back at restoring initial GUI.
Panouri
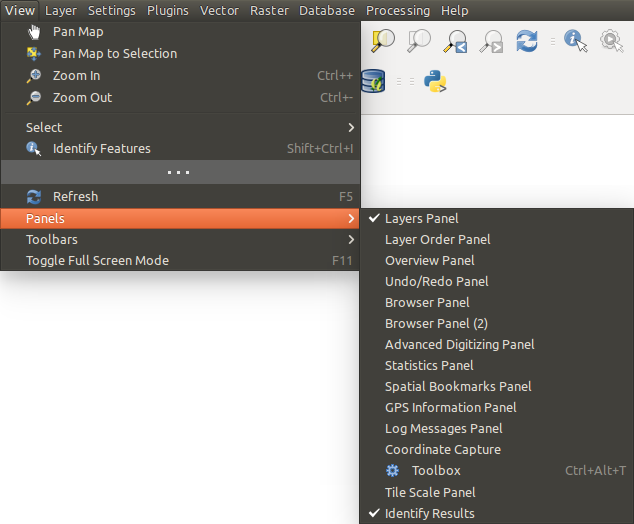
QGIS provides by default many panels to work with.
Figure Panels:

Meniul Panourilor
Some of these panels are described below while others may be found in different parts of the document, namely:
Panoul Straturilor
The layers panel lists all the layers in the project. The checkbox in each legend entry can be used to show or hide the layer. The toolbar in the layers panel allows you to:
 Gestionează Vizibilitatea: controlează vizibilitatea straturilor și combinarea straturilor presetate
 Filter Legend by Map Content: only the layers that are set
visible and whose features intersect the current map canvas have their style
rendered in the layers panel. Otherwise, a generic NULL symbol is applied to the
layer. Based on the layer symbology, this is a convenient way to identify which
kind of features from which layers cover your area of interest.
 Filter Legend by Expression: helps you apply an
expression to remove from the selected layer tree styles that have no feature
satisfying the condition. This can be used for example to highlight features that are
within a given area/feature of another layer.
From the drop-down list, you can edit and clear the expression set.
 Expand All or
  Collapse All
layers and groups in the layers panel.
Collapse All
layers and groups in the layers panel.- and
 Remove Layer/Group currently selected.
Figure Layer tools Bar:

Layer Toolbar in Layers Panel
The button  allows you to add Presets views in the legend.
Presets are a way to save and easily restore a combination of layers with their
current style. To add a preset view, just set visible the layers you want, with
their desired symbology, and click on
  button.
Choose Add Preset... from the drop-down menu and give a name to the preset.
The added preset is listed at the bottom of the drop-down menu and is recalled by
clicking on it.
The Replace Preset ‣ option helps you overwrite a preset content with the current map view while the Remove Current Preset button deletes the active preset.
Toate presetările adăugate sunt, de asemenea, prezente în harta compozitorului, pentru a vă permite să creați un aspect al hărții pe baza opiniilor dumneavoastră (a se vedea Proprietăți principale).
Note
Tools to manage the layers panel are also available to layout the map and legend items of the print composer
Un strat poate fi selectat și deplasat în sus sau în jos în legendă, pentru a schimba ordinea Z. Ordinea Z stabilește că straturile enumerate mai aproape de partea de sus a legendei sunt desenate peste straturile enumerate mai jos.
Note
Acest comportament poate fi suprascris de către panoul Layer Order.
Layers in the legend window can be organized into groups. There are two ways to do this:
- Press the
 icon to add a new group. Type in a name for
the group and press
 Enter. Now click on an existing layer and drag it onto the group. Selectați mai multe straturi, facând clic dreapta în fereastra legendei și alegeți Grupul Selectat.
Pentru a scoate un strat dintr-un grup, puteți să-l trageți în afară, sau să faceți clic dreapta pe el și să alegeți Make to toplevel item. Grupurile pot fi, de asemenea, imbricate în interiorul altor grupuri.
Caseta grupului va afișa sau ascunde toate straturile din grup cu un singur clic.
Conținutul meniul contextual, afișat în urma apăsării butonului drept al mouse-ului, depinde de tipul vectorial sau raster al elementul selectat din legendă. Pentru straturile vectoriale GRASS,  Toggle editing nu este disponibil. Parcurgeți secțiunea Digitizarea și editarea unui strat vectorial GRASS pentru informații cu privire la editarea straturilor vectoriale GRASS.
Below are listed available options in context menu depending on the selected item.
Enabling the Mutually Exclusive Group option you can make a group have only one layer visible at the same time. Whenever a layer within the group is set visible the others will be toggled not visible.
Este posibilă selectarea mai multor straturi sau grupuri, în același timp, ținând apăsată tasta Ctrl în timp ce selectați straturile cu butonul din stânga al mouse-ului. Puteți muta apoi toate straturile selectate într-un nou grup, în același timp.
You may also delete more than one layer or group at once by selecting
several items with the Ctrl key and pressing Ctrl+D afterwards.
This way, all selected layers or groups will be removed from the layers list.
Editing vector layer style
From the Layers panel, you have shortcuts to easily and quickly edit the layer rendering. Right-click on a vector layer and select Styles –> in the list in order to:
- see the currently applied styles to the layer. In case you defined many styles for the layer, you can switch from one to another and have your layer rendering automatically updated in the map canvas.
- copy the current style, and when applicable, paste a copied style from another layer
- rename the current style, add a new one (which is actually a copy of the current one) or delete the current style (when multiple styles available).
Note
The previous options are also available for raster layer.
Whether the features in the vector layer have all the same unique symbol or they are classified (in that case, the layer is displayed in a tree structure with each class as sub-item), the following options are available at layer level or class level:
- a Edit Symbol... button to open the Selectorul de simboluri dialog and update any property (symbol, size, color...) of the layer or feature symbol. Double-clicking on a feature does also open the Symbol Selector dialog.
- a Selectorul de Culoare widget with a Color Wheel from which you can click a color and have it automatically update the symbol fill color. For convenience, Recent colors are available at the bottom of the color wheel.
- a
 Show All Items and
  Hide All
Items to toggle on or off the visibility of all the classes of features. This avoids
(un)checking items one by one.
Tip
Quickly share a layer style
From the context menu, copy the style of a layer and paste it to a group or a selection of layers: the style is applied to all the layers that are of the same type (vector vs raster) as the original layer and, in case of vector, have the same geometry type (point, line or polygon).
Lucrul cu ordonarea independentă a straturilor din Legendă
There is a panel that allows you to define an independent drawing order for
the layers panel. You can activate it in the menu
Settings ‣ Panels ‣ Layer Order Panel. This feature allows you
to, for instance, order your layers in order of importance, but still display
them in the correct order (see figure_layer_order). Checking the  Control rendering order box underneath the list of layers will
cause a revert to default behavior.
Figure Layer Order:

Define a legend independent layer order
Panoul Sumarului Statistic
This panel can show some statistics on a specific vector layers. The panel allows users to choose:
- the vector layer;
- the column or the expression;
- filter statistics to selected features;
- refresh the informations;
- the statistics information to display with the bottom right button;
Panoul Vederii Generale din QGIS
In QGIS, you can use an overview panel that provides a full extent view of layers added to it. Within the view is a rectangle showing the current map extent. This allows you to quickly determine which area of the map you are currently viewing. Note that labels are not rendered to the map overview even if the layers in the map overview have been set up for labelling. If you click and drag the red rectangle in the overview that shows your current extent, the main map view will update accordingly.
Panoul pentru Mesajele Jurnalului
When loading or processing some operations, you can track and follow messages
that appear in different tabs using the  Log Messages Panel.
It can be activated using the most right icon in the bottom status bar.
Panoul de Anulare/Refacere
For each layer being edited, this panel shows the list of actions done, allowing to quickly undo a set of actions by simply selecting the action listed above.
Vizualizare Hartă
Also called Map canvas, this is the “business end” of QGIS — maps are displayed in this area. The map displayed in this window will depend on the vector and raster layers you have chosen to load (see sections that follow for more information on how to load layers). The map view can be panned, shifting the focus of the map display to another region, and it can be zoomed in and out. Various other operations can be performed on the map as described in the label_toolbars description above. The map view and the legend are tightly bound to each other — the maps in view reflect changes you make in the legend area.
Tip
Mărirea Hărții folosind Rotița Mouse-ului
Puteți utiliza rotița mouse-ului pentru a mări sau a micșora harta. Plasați cursorul mouse-ului în interiorul hărții, și mișcați rotița înainte (dinspre dvs.) pentru a mări, și înapoi (înspre dvs.) pentru a micșora. Transfocarea are loc din poziția cursorului mouse-ului. Puteți personaliza comportamentul de transfocare al rotiței mouse-ului folosind meniul filei Map tools de sub Settings ‣ Options.
Tip
Deplasarea Hărții folosind Săgețile și Bara de Spațiu
Puteți utiliza tastele cu săgeți pentru a deplasa harta. Plasați cursorul mouse-ului în interiorul hărții și apăsați tasta săgeții din dreapta pentru deplasarea înspre est, tasta săgeții din stânga pentru deplasarea înspre vest, tasta săgeții de sud pentru deplasarea înspre nord și tasta săgeții din jos pentru deplasarea înspre sud. Puteți deplasa harta folosind bara de spațiu sau rotița mouse-ului: este suficient să mutați mouse-ul în timp ce țineți apăsată bara de spațiu sau ținând apăsată rotița mouse-ului.
Bara de Stare
The status bar provides you with general information about the map view, and actions processed or available and offers you tools to manage the map view.
On the left side of the status bar, you can get a summary of actions you’ve done (such as selecting features in a layer, removing layer) or a long description of the tool you are hovering over (not available for all tools). On startup, the bar status also informs you about availability of new or upgradeable plugins (if checked in Plugin Manager settings).
In case of lengthy operations, such as gathering of statistics in raster layers or rendering several layers in map view, a progress bar is displayed in the status bar to show the current progress of the action.
The ![]() Coordinate option shows the current position of the mouse,
following it while moving across the map view. You can set the unit (and precision)
to use in the project properties, General tab.
Click on the small button at the left of the textbox to toggle between
the Coordinate option and the
Coordinate option shows the current position of the mouse,
following it while moving across the map view. You can set the unit (and precision)
to use in the project properties, General tab.
Click on the small button at the left of the textbox to toggle between
the Coordinate option and the  Extents option that displays
in map units, the coordinates of the current lower leftmost and upper rightmost
points of the map view, as you pan and zoom in and out.
Pe lângă afișarea coordonatelor are loc și afișarea Scării. Acesta prezintă scara hărții vizualizate. Dacă are loc o transfocare, QGIS vă arată scara actuală. Există un selector de scară, care vă permite să alegeți între predefined and custom scales care vor fi atribuite vizualizării hărții.
În partea dreaptă a scării se poate defini o rotație în sensul acelor de ceasornic, pentru vizualizarea hărții, în grade.
On the right side of the status bar, there is a small checkbox which can be used to temporarily prevent layers being rendered to the map view (see section Randare).
To the right of the render functions, you find the ![]() Current CRS: icon with the EPSG code of the current
project CRS. Clicking on this lets you Enable ‘on the fly’ CRS
transformation properties for the current project and apply another CRS to the
map view.
Current CRS: icon with the EPSG code of the current
project CRS. Clicking on this lets you Enable ‘on the fly’ CRS
transformation properties for the current project and apply another CRS to the
map view.
Finally, the  Messages button opens the Log
Messages Panel which informs you on underlying process (QGIS startup, plugins
loading, processing tools...)
Tip
Calculează Scara Corectă a Canevasului Hărții
When you start QGIS, the default CRS is WGS 84 (epsg 4326) and
units are degrees. This means that QGIS will interpret any
coordinate in your layer as specified in degrees. To get correct scale values,
you can either manually change this setting, e.g. to meters, in the General
tab under Project ‣ Project Properties, or you can use
the ![]() Current CRS: icon seen above. In the latter case,
the units are set to what the project projection specifies (e.g.,
Current CRS: icon seen above. In the latter case,
the units are set to what the project projection specifies (e.g., +units=us-ft).
Note that CRS choice on startup can be set in Settings ‣ Options ‣ CRS.


 Ieșire din QGIS


