Interface do QGIS
When QGIS starts, you are presented with the GUI as shown in the figure (the numbers 1 through 5 in yellow circles are discussed below).
Figure QGIS GUI 1:
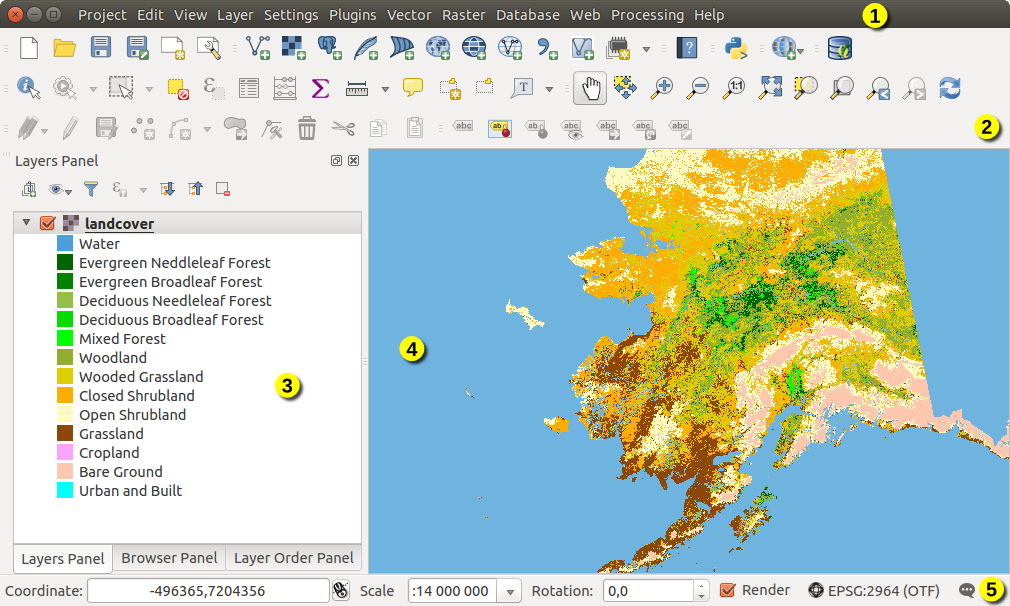
QGIS GUI with Alaska sample data
Nota
Suas decorações de janela (barra de título, etc) podem parecer diferentes dependendo do seu sistema operacional e gerenciador de janelas.
The QGIS GUI is divided into five areas:
Barra de Menu
- Toolbars
- Panels
Visualização do mapa
Barra de Status
These five components of the QGIS interface are described in more detail in the following sections. Two more sections present keyboard shortcuts and context help.
Barra de Menu
The menu bar provides access to various QGIS features using a standard hierarchical menu. The top-level menus and a summary of some of the menu options are listed below, together with the associated icons as they appear on the toolbar, and keyboard shortcuts. The shortcuts presented in this section are the defaults; however, keyboard shortcuts can also be configured manually using the Configure shortcuts dialog, opened from Settings ‣ Configure Shortcuts....
Embora a maioria das opções de menu tem uma ferramenta correspondente e vice-versa, os menus não são organizados exatamente como as barras de ferramentas. A barra de ferramentas que contém as ferramentas que estão listadas depois de cada opção habilitada no menu de entrada. Algumas opções de menu aparecem somente se o complemento correspondente for carregado. Para mais informações sobre as ferramentas e barras de ferramentas, consulte a seção :ref: label_toolbars.
Nota
QGIS is a cross-platform application meaning that though it provides you with the same tools, they may be placed in different menus according to the operating system specification. The lists below show the most common location and precise when there is a variation.
Projeto
Opção de menu |
Atalho |
Referência |
Barra de Ferramentas |
|---|---|---|---|
 New New |
Ctrl+N |
ver Projetos |
Projeto |
 Open Open |
Ctrl+O |
ver Projetos |
Projeto |
Novo a partir do modelo ‣ |
ver Projetos |
||
| Open Recent ‣ | ver Projetos |
||
 Save Save |
Ctrl+S |
ver Projetos |
Projeto |
 Save As... Save As... |
Ctrl+Shift+S |
ver Projetos |
Projeto |
 Save as Image... Save as Image... |
ver Arquivo de Saída |
||
| DXF Export... | ver Arquivo de Saída |
||
 Project Properties... Project Properties... |
Ctrl+Shift+P |
ver Projetos |
|
 New Print Composer New Print Composer |
Ctrl+P |
Projeto |
|
 Composer manager... Composer manager... |
Projeto |
||
Imprimir Compositores ‣ |
|||
 Exit QGIS Exit QGIS |
Ctrl+Q |
Under  Mac OSX, the Exit QGIS command corresponds to
QGIS ‣ Quit QGIS (
Mac OSX, the Exit QGIS command corresponds to
QGIS ‣ Quit QGIS (Cmd+Q).
Editar
Opção de menu |
Atalho |
Referência |
Barra de Ferramentas |
|---|---|---|---|
 Undo Undo |
Ctrl+Z |
Digitalização Avançada |
|
 Redo Redo |
Ctrl+Shift+Z |
Digitalização Avançada |
|
 Cut Features Cut Features |
Ctrl+X |
Digitalização |
|
 Copy Features Copy Features |
Ctrl+C |
Digitalização |
|
 Paste Features Paste Features |
Ctrl+V |
Digitalização |
|
Colar feição como ‣ |
|||
 Add Feature Add Feature |
Ctrl+. |
Digitalização |
|
 Move Feature(s) Move Feature(s) |
Digitalização |
||
 Delete Selected Delete Selected |
Digitalização |
||
 Rotate Feature(s) Rotate Feature(s) |
Digitalização Avançada |
||
 Simplify Feature Simplify Feature |
Digitalização Avançada |
||
 Add Ring Add Ring |
Digitalização Avançada |
||
 Add Part Add Part |
Digitalização Avançada |
||
 Fill Ring Fill Ring |
Digitalização Avançada |
||
 Delete Ring Delete Ring |
Digitalização Avançada |
||
 Delete Part Delete Part |
Digitalização Avançada |
||
 Reshape Features Reshape Features |
Digitalização Avançada |
||
 Offset Curve Offset Curve |
Digitalização Avançada |
||
 Split Features Split Features |
Digitalização Avançada |
||
 Split Parts Split Parts |
Digitalização Avançada |
||
 Merge Selected Features Merge Selected Features |
Digitalização Avançada |
||
 Merge Attr. of Selected Features Merge Attr. of Selected Features |
Digitalização Avançada |
||
 Node Tool Node Tool |
Digitalização |
||
 Rotate Point Symbols Rotate Point Symbols |
Digitalização Avançada |
After activating  Toggle editing mode for a layer,
you will enable the
Toggle editing mode for a layer,
you will enable the Add Feature icon in the Edit menu
depending on the layer type (point, line or polygon).
Editar (extra)
Opção de menu |
Atalho |
Referência |
Barra de Ferramentas |
|---|---|---|---|
| Add Feature |
Digitalização |
||
 Add Feature Add Feature |
Digitalização |
||
 Add Feature Add Feature |
Digitalização |
Ver
Opção de menu |
Atalho |
Referência |
Barra de Ferramentas |
|---|---|---|---|
 Pan Map Pan Map |
see Zooming and Panning | Navegação no Mapa |
|
 Pan Map to Selection Pan Map to Selection |
Navegação no Mapa |
||
 Zoom In Zoom In |
Ctrl++ |
see Zooming and Panning | Navegação no Mapa |
 Zoom Out Zoom Out |
Ctrl+- |
see Zooming and Panning | Navegação no Mapa |
Selecionar ‣ |
Atributos |
||
 Identify Features Identify Features |
Ctrl+Shift+I |
see Identificar feições | Atributos |
Medir ‣ |
ver Medição |
Atributos |
|
 Statistical Summary Statistical Summary |
see Statistical Summary Panel | Atributos |
|
 Zoom Full Zoom Full |
Ctrl+Shift+F |
Navegação no Mapa |
|
 Zoom To Layer Zoom To Layer |
Navegação no Mapa |
||
 Zoom To Selection Zoom To Selection |
Ctrl+J |
Navegação no Mapa |
|
 Zoom Last Zoom Last |
Navegação no Mapa |
||
 Zoom Next Zoom Next |
Navegação no Mapa |
||
 Zoom To Native Resolution Zoom To Native Resolution |
Navegação no Mapa |
||
Decorações ‣ |
ver decorações |
||
| Preview mode ‣ | |||
 Map Tips Map Tips |
see Menu Visualização | Atributos |
|
 New Bookmark... New Bookmark... |
Ctrl+B |
Atributos |
|
 Show Bookmarks Show Bookmarks |
Ctrl+Shift+B |
Atributos |
|
 Refresh Refresh |
F5 |
Navegação no Mapa |
|
Painéis ‣ |
veja Panels and Toolbars |
||
Barra de Ferramentas ‣ |
veja Panels and Toolbars |
||
| Toggle Full Screen Mode | F11 |
Under  Linux KDE, Panels ‣, Toolbars ‣
and Toggle Full Screen Mode are rather placed in Settings
menu.
Preview mode ‣ is not available under Mac OS X.
Linux KDE, Panels ‣, Toolbars ‣
and Toggle Full Screen Mode are rather placed in Settings
menu.
Preview mode ‣ is not available under Mac OS X.
Camada
Opção de menu |
Atalho |
Referência |
Barra de Ferramentas |
|---|---|---|---|
| Create Layer ‣ | Gerenciar camadas |
||
| Add Layer ‣ | see Formatos de dados suportados | Gerenciar camadas |
|
| Embed Layers and Groups... | |||
| Add from Layer Definition File... | |||
| Copy style |
see Save and Share Layer Properties | ||
| Paste style |
see Save and Share Layer Properties | ||
 Open Attribute Table Open Attribute Table |
Atributos |
||
| Toggle Editing |
Digitalização |
||
| Save Layer Edits |
Digitalização |
||
 Current Edits ‣ Current Edits ‣ |
Digitalização |
||
| Save As... | see Save layer into file | ||
| Save As Layer Definition File... | |||
 Remove Layer/Group Remove Layer/Group |
Ctrl+D |
||
 Duplicate Layers (s) Duplicate Layers (s) |
|||
| Set Scale Visibility of Layers | |||
| Set CRS of Layer(s) | Ctrl+Shift+C |
||
| Set project CRS from Layer | |||
| Properties... | see Janela de Propriedades de Vetor | ||
| Filter... | see Query Builder | ||
 Labeling Labeling |
see Menu Rótulos | ||
 Add to Overview Add to Overview |
Ctrl+Shift+O |
Gerenciar camadas |
|
 Add All To Overview Add All To Overview |
|||
 Remove All From Overview Remove All From Overview |
|||
 Show All Layers Show All Layers |
Ctrl+Shift+U |
Gerenciar camadas |
|
 Hide All Layers Hide All Layers |
Ctrl+Shift+H |
Gerenciar camadas |
|
| Show selected Layers |
|||
| Hide selected Layers |
Configurações
Opção de menu |
Atalho |
Referência |
Barra de Ferramentas |
|---|---|---|---|
 Custom CRS... Custom CRS... |
|||
Gerenciador de estilos... |
|||
 Configure shortcuts... Configure shortcuts... |
|||
| Customization... |
ver Personalização |
||
| Options... |
ver Opções |
||
| Snapping Options... | see Configurando a Tolerância de Atracção e Raio de Pesquisa |
Under Linux KDE, you’ll find more tools in Settings
menu such as Project Properties, Panels ‣,
Toolbars ‣ and Toggle Full Screen Mode.
Complementos
Opção de menu |
Atalho |
Referência |
Barra de Ferramentas |
|---|---|---|---|
 Manage and Install Plugins... Manage and Install Plugins... |
|||
| Python Console | Ctrl+Alt+P |
When starting QGIS for the first time not all core plugins are loaded.
Vetor
Opção de menu |
Atalho |
Referência |
Barra de Ferramentas |
|---|---|---|---|
| Open Street Map ‣ | |||
|
|||
|
|||
|
|||
|
|||
|


When starting QGIS for the first time not all core plugins are loaded.
Raster
Opção de menu |
Atalho |
Referência |
Barra de Ferramentas |
|---|---|---|---|
| Raster calculator... | see Calculadora Raster | ||
| Align Raster... | see Raster Alignment |
When starting QGIS for the first time not all core plugins are loaded.
Base de dados
Opção de menu |
Atalho |
Referência |
Barra de Ferramentas |
|---|---|---|---|
| Database ‣ | see Complemento Gerenciador BD | Database |
When starting QGIS for the first time not all core plugins are loaded.
Web
Opção de menu |
Atalho |
Referência |
Barra de Ferramentas |
|---|---|---|---|
| Metasearch | see Catálogo do Cliente MetaBusca | Web |
When starting QGIS for the first time not all core plugins are loaded.
Processamento
Opção de menu |
Atalho |
Referência |
Barra de Ferramentas |
|---|---|---|---|
 Toolbox Toolbox |
|||
 Graphical Modeler... Graphical Modeler... |
veja O modelador gráfico |
||
 History and log... History and log... |
|||
 Options... Options... |
|||
 Results viewer... Results viewer... |
|||
 Commander Commander |
Ctrl+Alt+M |
veja O QGIS Comando |
When starting QGIS for the first time not all core plugins are loaded.
Ajuda
Opção de menu |
Atalho |
Referência |
Barra de Ferramentas |
|---|---|---|---|
 Help Contents Help Contents |
F1 |
Ajuda |
|
 What’s This? What’s This? |
Shift+F1 |
Ajuda |
|
| API Documentation | |||
| Report an Issue | |||
| Need commercial support? | |||
 QGIS Home Page QGIS Home Page |
Ctrl+H |
||
 Check QGIS Version Check QGIS Version |
|||
 About About |
|||
 QGIS Sponsors QGIS Sponsors |
QGIS
This menu is only available under Mac OS X and contains some OS related
commands.
Opção de menu |
Atalho |
Referência |
|---|---|---|
| Preferences | ||
| About QGIS | ||
| Hide QGIS | ||
| Show All | ||
| Hide Others | ||
| Quit QGIS | Cmd+Q |
Preferences and About QGIS are the same commands as Settings ‣ Options and Help ‣ About. Quit QGIS corresponds to Project ‣ Exit QGIS under the other platforms.
Panels and Toolbars
From the View menu (Settings under KDE), you can switch on and off QGIS widgets (Panels ‣) or toolbars (Toolbars ‣). You can (de)activate any of them by right-clicking the menu bar or a toolbar and choose the item you want. Each panel or toolbar can be moved and placed wherever you feel comfortable with in QGIS interface. The list can also be extended with the activation of Core or external plugins.
Toolbars
A barra de ferramentas permite o acesso à maioria das mesmas funções dos menus, além de ferramentas adicionais para interagir com o mapa. Cada item da barra de ferramentas pop-up tem ajuda disponível. Mantenha o mouse sobre o item e uma breve descrição a respeito da ferramenta será exibida.
Every toolbar can be moved around according to your needs. Additionally, they can be switched off using the right mouse button context menu, or by holding the mouse over the toolbars.
Figure Toolbars:

The Toolbars menu
Dica
Restaurar barra de ferramentas
If you have accidentally hidden a toolbar, you can get it back by choosing menu option View ‣ Toolbars ‣ (or Settings ‣ Toolbars ‣ under Linux KDE). If for some reason a toolbar (or any other widget) totally disappears from the interface, you’ll find tips to get it back at restoring initial GUI.
Panels
QGIS provides by default many panels to work with.
Figure Panels:
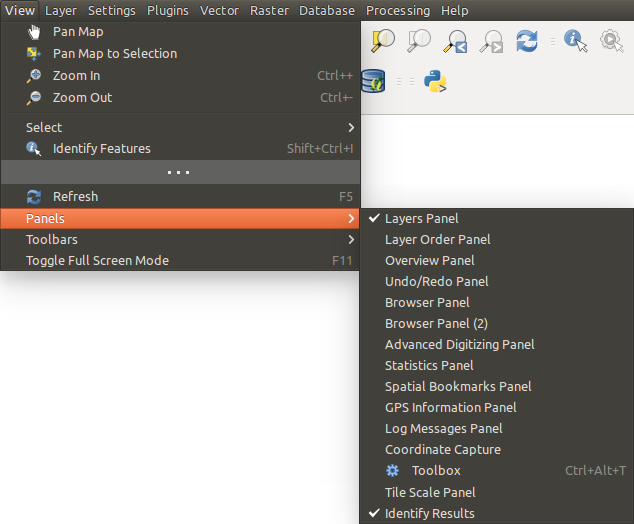
The Panels menu
Some of these panels are described below while others may be found in different parts of the document, namely:
- the Browser Panel
- the Advanced Digitizing Panel
- the Spatial Bookmarks Panel
- the GPS Information Panel
- the Tile Scale Panel
- the Identify Panel
- the User Input Panel
Layers Panel
The layers panel lists all the layers in the project. The checkbox in each legend entry can be used to show or hide the layer. The toolbar in the layers panel allows you to:
 Add new group
 Manage Visibility: control visibility of layers and
preset layers combination
Manage Visibility: control visibility of layers and
preset layers combination Filter Legend by Map Content: only the layers that are set
visible and whose features intersect the current map canvas have their style
rendered in the layers panel. Otherwise, a generic NULL symbol is applied to the
layer. Based on the layer symbology, this is a convenient way to identify which
kind of features from which layers cover your area of interest.
Filter Legend by Map Content: only the layers that are set
visible and whose features intersect the current map canvas have their style
rendered in the layers panel. Otherwise, a generic NULL symbol is applied to the
layer. Based on the layer symbology, this is a convenient way to identify which
kind of features from which layers cover your area of interest. Filter Legend by Expression: helps you apply an
expression to remove from the selected layer tree styles that have no feature
satisfying the condition. This can be used for example to highlight features that are
within a given area/feature of another layer.
From the drop-down list, you can edit and clear the expression set.
Filter Legend by Expression: helps you apply an
expression to remove from the selected layer tree styles that have no feature
satisfying the condition. This can be used for example to highlight features that are
within a given area/feature of another layer.
From the drop-down list, you can edit and clear the expression set. Expand All or
  Collapse All
layers and groups in the layers panel.
Collapse All
layers and groups in the layers panel.- and Remove Layer/Group currently selected.
Figure Layer tools Bar:
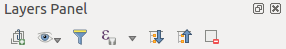
Layer Toolbar in Layers Panel
The button allows you to add Presets views in the legend.
Presets are a way to save and easily restore a combination of layers with their
current style. To add a preset view, just set visible the layers you want, with
their desired symbology, and click on button.
Choose Add Preset... from the drop-down menu and give a name to the preset.
The added preset is listed at the bottom of the drop-down menu and is recalled by
clicking on it.
The Replace Preset ‣ option helps you overwrite a preset content with the current map view while the Remove Current Preset button deletes the active preset.
Todos os preestabelecidos adicionados estarão presentes no desenho de impressão afim de permitir a criação de um desenho de mapa de mapa com base em seus pontos de visão específicos (ver Propriedades principais).
Nota
Tools to manage the layers panel are also available to layout the map and legend items of the print composer
Uma camada pode ser selecionada e arrastada para cima ou para baixo na legenda para mudar a Z-ordenação. Z-ordenação significa que as camadas listadas mais perto do topo da legenda são desenhadas sobre camadas listadas mais abaixo na legenda.
Nota
This behavior can be overridden by the Layer Order panel.
Layers in the legend window can be organized into groups. There are two ways to do this:
- Press the
 icon to add a new group. Type in a name for
the group and press
icon to add a new group. Type in a name for
the group and press Enter. Now click on an existing layer and drag it onto the group. Selecione algumas camadas, clique direito na janela de legenda e escolha Grupo selecionado. As camadas selecionadas serão automaticamente colocadas em um novo grupo.
Para trazer uma camada de um grupo, você pode arrastá-la de fora, ou clique direito sobre ela e escolha Faça o item toplevel. Os grupos também podem ser aninhados dentro de outros grupos.
A caixa de seleção de um grupo vai mostrar ou ocultar todas as camadas do grupo com apenas um clique.
The content of the right mouse button context menu depends on whether the
selected legend item is a raster or a vector layer. For GRASS vector layers,
Toggle editing is not available. See section
Digitalizando e editando uma camada vetorial GRASS for information on editing GRASS vector layers.
Below are listed available options in context menu depending on the selected item.
| Option | Vector Layer | Raster Layer | Group |
|---|---|---|---|
| Zoom to Layer/Group |
 |
|
|
 Show in Overview Show in Overview |
|
|
|
| Zoom to Native Resolution (100%) |
|
||
| Stretch Using Current Extent | |
||
| Remove |
|
|
|
| Duplicate |
|
|
|
Estabelecer escala de visibilidade da camada |
|
|
|
| Set Layer/Group CRS | |
|
|
Definir SRC do projeto a partir da Camada |
|
|
|
| Styles ‣ | |
|
|
| Copy Style | |
|
|
| Paste Style | |
|
|
| Open Attribute Table |
|
||
| Toggle Editing |
|
||
| Current Edits ‣ |
(in Edit mode) |
||
| Save As... | |
|
|
| Save As Layer Definition File... | |
|
|
Filtrar |
|
||
| Show Feature Count |
|
||
Propriedades... |
|
|
|
| Move to Top-level | |
|
|
Renomear |
|
|
|
Agrupar Selecionados |
|
|
|
Propriedades... |
|
|
|
| Set Group WMS Data | |
||
| Mutually Exclusive Group |
|
||
| Add Group |
|
Enabling the Mutually Exclusive Group option you can make a group have only one layer visible at the same time. Whenever a layer within the group is set visible the others will be toggled not visible.
É possível selecionar mais de uma camada ou grupo ao mesmo tempo segurando a tecla Ctrl enquanto seleciona as camadas com o botão esquerdo do mouse. Pode mover todas as camadas selecionadas para um novo grupo ao mesmo tempo.
You may also delete more than one layer or group at once by selecting
several items with the Ctrl key and pressing Ctrl+D afterwards.
This way, all selected layers or groups will be removed from the layers list.
Editando o estilo da camada vetorial
From the Layers panel, you have shortcuts to easily and quickly edit the layer rendering. Right-click on a vector layer and select Styles –> in the list in order to:
- see the currently applied styles to the layer. In case you defined many styles for the layer, you can switch from one to another and have your layer rendering automatically updated in the map canvas.
- copy the current style, and when applicable, paste a copied style from another layer
- rename the current style, add a new one (which is actually a copy of the current one) or delete the current style (when multiple styles available).
Nota
The previous options are also available for raster layer.
Whether the features in the vector layer have all the same unique symbol or they are classified (in that case, the layer is displayed in a tree structure with each class as sub-item), the following options are available at layer level or class level:
- a Edit Symbol... button to open the The symbol Selector dialog and update any property (symbol, size, color...) of the layer or feature symbol. Double-clicking on a feature does also open the Symbol Selector dialog.
- a Color Selector widget with a Color Wheel from which you can click a color and have it automatically update the symbol fill color. For convenience, Recent colors are available at the bottom of the color wheel.
- a Show All Items and Hide All
Items to toggle on or off the visibility of all the classes of features. This avoids
(un)checking items one by one.
Dica
Quickly share a layer style
From the context menu, copy the style of a layer and paste it to a group or a selection of layers: the style is applied to all the layers that are of the same type (vector vs raster) as the original layer and, in case of vector, have the same geometry type (point, line or polygon).
Trabalhando com a Ordem da legenda de camada independente
There is a panel that allows you to define an independent drawing order for
the layers panel. You can activate it in the menu
Settings ‣ Panels ‣ Layer Order Panel. This feature allows you
to, for instance, order your layers in order of importance, but still display
them in the correct order (see figure_layer_order). Checking the
Control rendering order box underneath the list of layers will
cause a revert to default behavior.
Figure Layer Order:

Define a legend independent layer order
Statistical Summary Panel
This panel can show some statistics on a specific vector layers. The panel allows users to choose:
- the vector layer;
- the column or the expression;
- filter statistics to selected features;
- refresh the informations;
- the statistics information to display with the bottom right button;
QGIS Overview Panel
In QGIS, you can use an overview panel that provides a full extent view of layers added to it. Within the view is a rectangle showing the current map extent. This allows you to quickly determine which area of the map you are currently viewing. Note that labels are not rendered to the map overview even if the layers in the map overview have been set up for labelling. If you click and drag the red rectangle in the overview that shows your current extent, the main map view will update accordingly.
Log Messages Panel
When loading or processing some operations, you can track and follow messages
that appear in different tabs using the  Log Messages Panel.
It can be activated using the most right icon in the bottom status bar.
Log Messages Panel.
It can be activated using the most right icon in the bottom status bar.
Undo/Redo Panel
For each layer being edited, this panel shows the list of actions done, allowing to quickly undo a set of actions by simply selecting the action listed above.
Visualização do mapa
Also called Map canvas, this is the “business end” of QGIS — maps are displayed in this area. The map displayed in this window will depend on the vector and raster layers you have chosen to load (see sections that follow for more information on how to load layers). The map view can be panned, shifting the focus of the map display to another region, and it can be zoomed in and out. Various other operations can be performed on the map as described in the label_toolbars description above. The map view and the legend are tightly bound to each other — the maps in view reflect changes you make in the legend area.
Dica
Ampliando o mapa com a roda do mouse
Você pode usar a roda do mouse para zoom in e out no mapa. Coloque o cursor do mouse dentro da área do mapa e gire a roda para a frente (longe de você) para ampliar e para trás (para você) para diminuir o zoom. A posição do cursor do mouse é o centro onde o zoom ocorre. Você pode personalizar o comportamento do zoom roda do mouse usando o :guilabel: aba Ferramentas do mapa sob o menu Configurações ‣ Opções.
Dica
Percorrendo o mapa com as setas e a barra de espaço
Você pode usar as setas do teclado para se deslocar no mapa. Coloque o cursor do mouse dentro da área do mapa e clique na seta para a direita para pan Leste, seta para a esquerda para pan Oeste, seta para cima para pan Norte e para baixo seta para deslocar Sul. Você também pode deslocar o mapa utilizando a barra de espaço ou clique na roda do mouse.
Barra de Status
The status bar provides you with general information about the map view, and actions processed or available and offers you tools to manage the map view.
On the left side of the status bar, you can get a summary of actions you’ve done (such as selecting features in a layer, removing layer) or a long description of the tool you are hovering over (not available for all tools). On startup, the bar status also informs you about availability of new or upgradeable plugins (if checked in Plugin Manager settings).
In case of lengthy operations, such as gathering of statistics in raster layers or rendering several layers in map view, a progress bar is displayed in the status bar to show the current progress of the action.
The ![]() Coordinate option shows the current position of the mouse,
following it while moving across the map view. You can set the unit (and precision)
to use in the project properties, General tab.
Click on the small button at the left of the textbox to toggle between
the Coordinate option and the
Coordinate option shows the current position of the mouse,
following it while moving across the map view. You can set the unit (and precision)
to use in the project properties, General tab.
Click on the small button at the left of the textbox to toggle between
the Coordinate option and the  Extents option that displays
in map units, the coordinates of the current lower leftmost and upper rightmost
points of the map view, as you pan and zoom in and out.
Extents option that displays
in map units, the coordinates of the current lower leftmost and upper rightmost
points of the map view, as you pan and zoom in and out.
Next to the coordinate display you will find the Scale display. It shows the scale of the map view. If you zoom in or out, QGIS shows you the current scale. There is a scale selector, which allows you to choose among predefined and custom scales to assign to the map view.
To the right of the scale display you can define a current clockwise rotation for your map view in degrees.
On the right side of the status bar, there is a small checkbox which can be used to temporarily prevent layers being rendered to the map view (see section Renderização).
To the right of the render functions, you find the  Current CRS: icon with the EPSG code of the current
project CRS. Clicking on this lets you Enable ‘on the fly’ CRS
transformation properties for the current project and apply another CRS to the
map view.
Current CRS: icon with the EPSG code of the current
project CRS. Clicking on this lets you Enable ‘on the fly’ CRS
transformation properties for the current project and apply another CRS to the
map view.
Finally, the Messages button opens the Log
Messages Panel which informs you on underlying process (QGIS startup, plugins
loading, processing tools...)
Dica
Calculando a escala correta do seu Mapa da tela/visualização
When you start QGIS, the default CRS is WGS 84 (epsg 4326) and
units are degrees. This means that QGIS will interpret any
coordinate in your layer as specified in degrees. To get correct scale values,
you can either manually change this setting, e.g. to meters, in the General
tab under Project ‣ Project Properties, or you can use
the Current CRS: icon seen above. In the latter case,
the units are set to what the project projection specifies (e.g., +units=us-ft).
Note that CRS choice on startup can be set in Settings ‣ Options ‣ CRS.