3. Lesson: Un Aperçu de l’Interface
Nous allons explorer l’interface utilisateur de QGIS afin que vous soyez familier avec les menus, les barres d’outils, le canevas de carte et la liste des couches, ces éléments formant la structure de base de l’interface.
Le but de cette leçon: Comprendre les notions de base de l’interface de QGIS.
3.1.  Try Yourself: Les Notions de Base
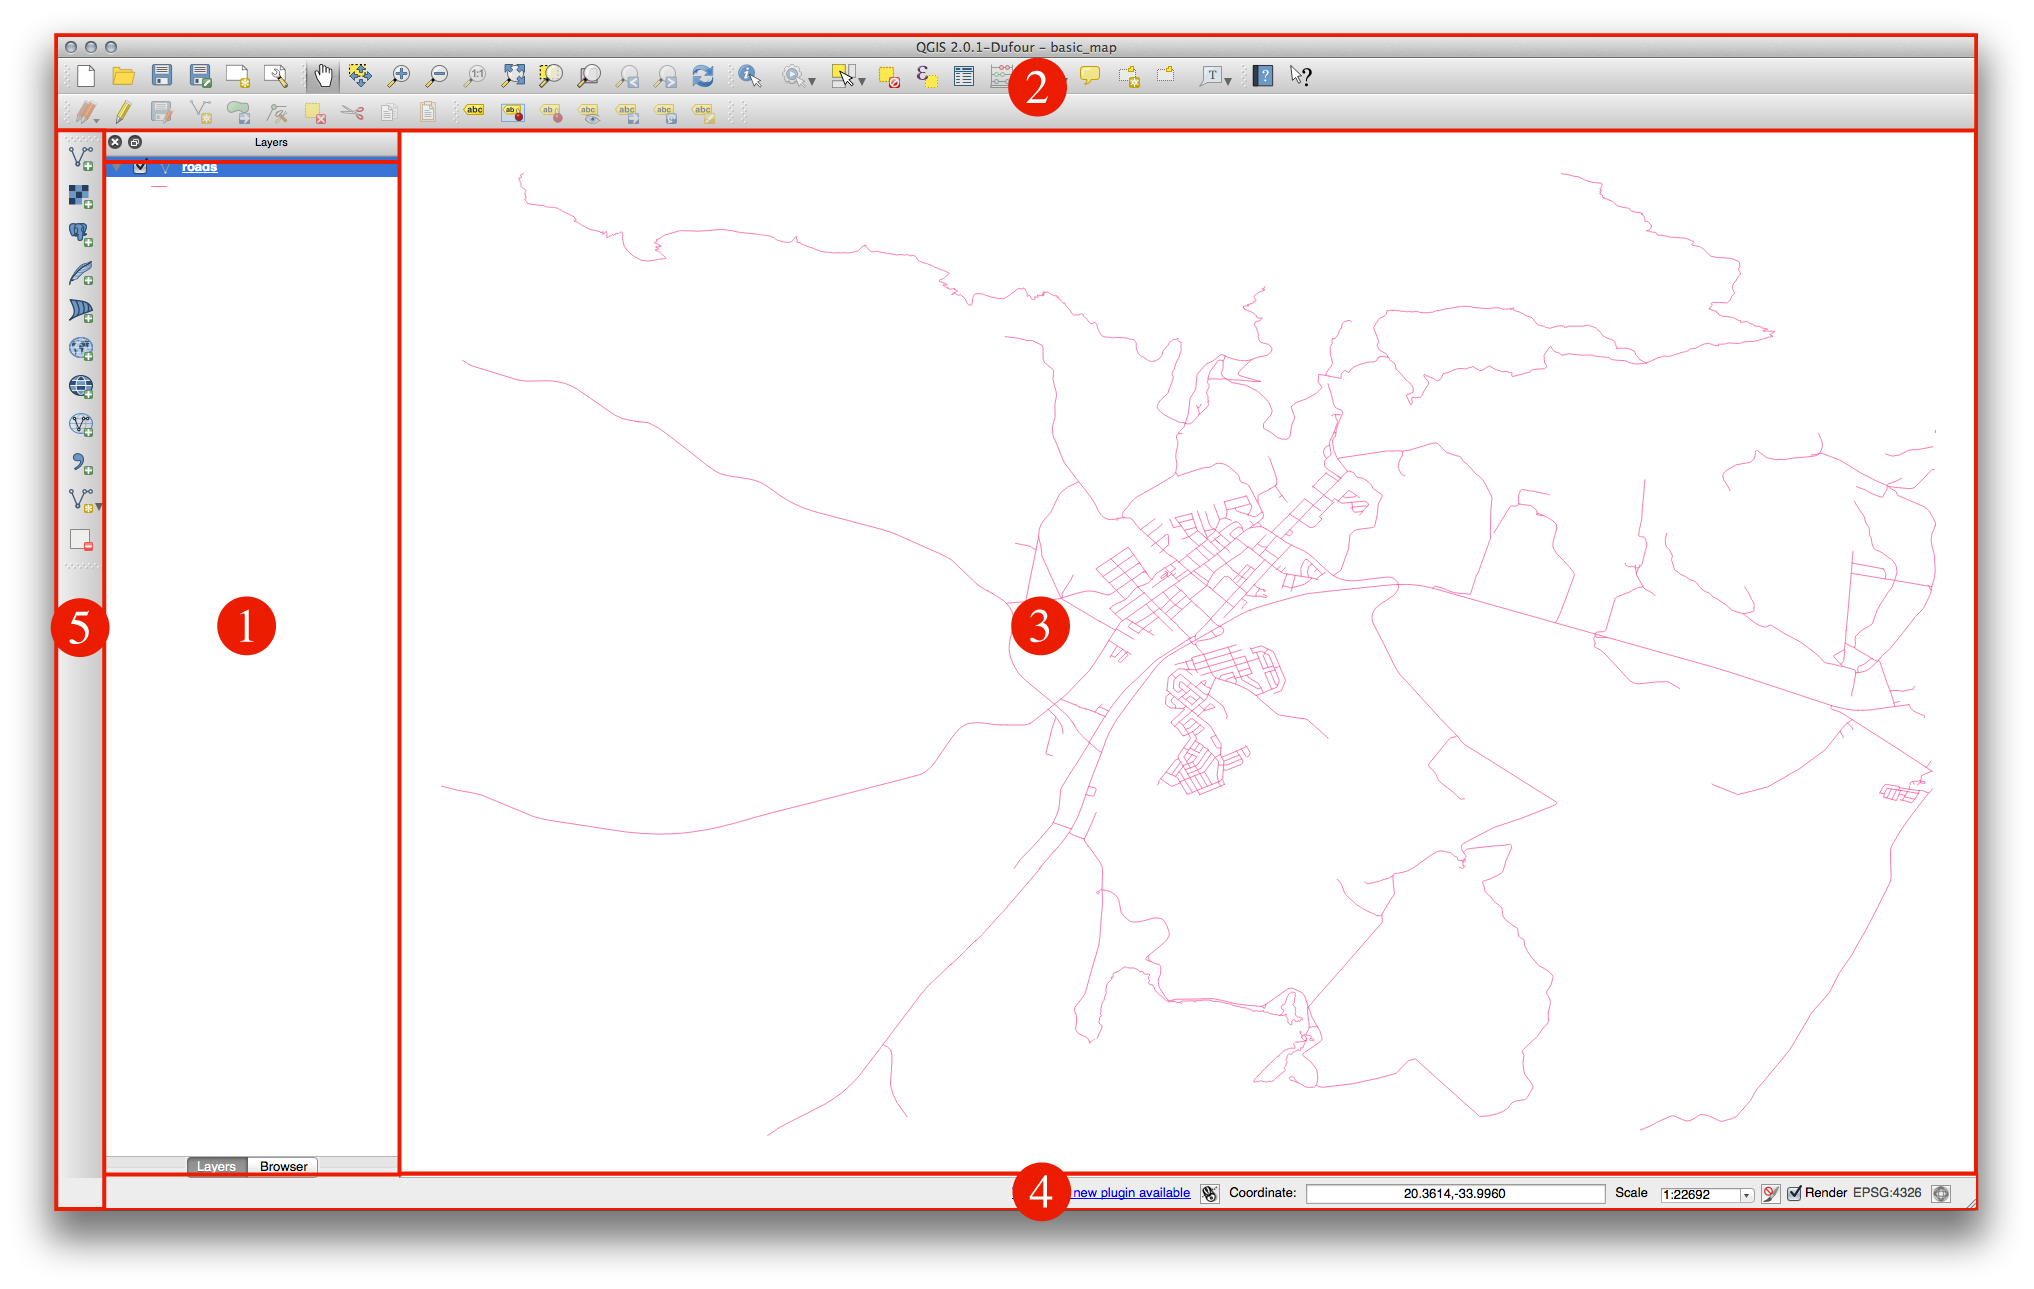
Les éléments identifiés sur la figure ci-dessous sont:
- Layers List / Browser Panel
Barre d’outils
Canevas de carte
Barre d’état
- Side Toolbar
3.1.1. La Liste de Couches
Dans la liste des couches, vous pouvez voir à tout moment toutes les couches qui sont disponibles dans le projet.
Expanding collapsed items (by clicking the arrow or plus symbol beside them) will provide you with more information on the layer’s current appearance.
Right-clicking on a layer will give you a menu with lots of extra options. You will be using some of them before long, so take a look around!
Some versions of QGIS have a separate Control rendering order checkbox just underneath the Layers list. Don’t worry if you can’t see it. If it is present, ensure that it’s checked for now.
Note
A vector layer is a dataset, usually of a specific kind of object, such as roads, trees, etc. A vector layer can consist of either points, lines or polygons.
3.1.2. The Browser Panel
The QGIS Browser is a panel in QGIS that lets you easily navigate in your database. You can have access to common vector files (e.g. ESRI shapefile or MapInfo files), databases (e.g.PostGIS, Oracle, Spatialite or MSSQL Spatial) and WMS/WFS connections. You can also view your GRASS data.
3.1.3. Barres d’Outils
Your most oft-used sets of tools can be turned into toolbars for basic access. For example, the File toolbar allows you to save, load, print, and start a new project. You can easily customize the interface to see only the tools you use most often, adding or removing toolbars as necessary via the View ‣ Toolbars menu.
Even if they are not visible in a toolbar, all of your tools will remain accessible via the menus. For example, if you remove the File toolbar (which contains the Save button), you can still save your map by clicking on the File menu and then clicking on Save.
3.1.4. Le Canevas de Carte
C’est où la carte elle-même est affichée.
3.1.5. La Barre d’Etat
Shows you information about the current map. Also allows you to adjust the map scale and see the mouse cursor’s coordinates on the map.
3.2. Try Yourself 1
Try to identify the four elements listed above on your own screen, without referring to the diagram above. See if you can identify their names and functions. You will become more familiar with these elements as you use them in the coming days.
3.3. Try Yourself 2
Essayez de retrouver chacun de ces outils dans votre interface. A quoi servent-ils?


Note
If any of these tools is not visible on the screen, try enabling some toolbars that are currently hidden. Also keep in mind that if there isn’t enough space on the screen, a toolbar may be shortened by hiding some of its tools. You can see the hidden tools by clicking on the double right arrow button in any such collapsed toolbar. You can see a tooltip with the name of any tool by holding your mouse over the tool for a while.
:ref:`Vérifiez vos résultats <interface-overview-2>
3.4. What’s Next?
Now you’ve seen how the QGIS interface works, you can use the tools available to you and start improving on your map! This is the topic of the next lesson.