Diagram Overlay Plugin
 The Diagram Overlay Plugin allows you to add a graphic
overlay to a vector layer (see figure_overlay_1). It provides additional and
not yet implemented features to the Diagrams tab, described in secion
Diagrams Tab.
The Diagram Overlay Plugin allows you to add a graphic
overlay to a vector layer (see figure_overlay_1). It provides additional and
not yet implemented features to the Diagrams tab, described in secion
Diagrams Tab.
Before starting, the Diagram Overlay Plugin needs to be activated using the Plugin Manager (see Section Loading a QGIS Core Plugin). It will then appear as Overlay tab in the Layer Properties dialog next to the Diagrams tab.
Figure Overlay 1:
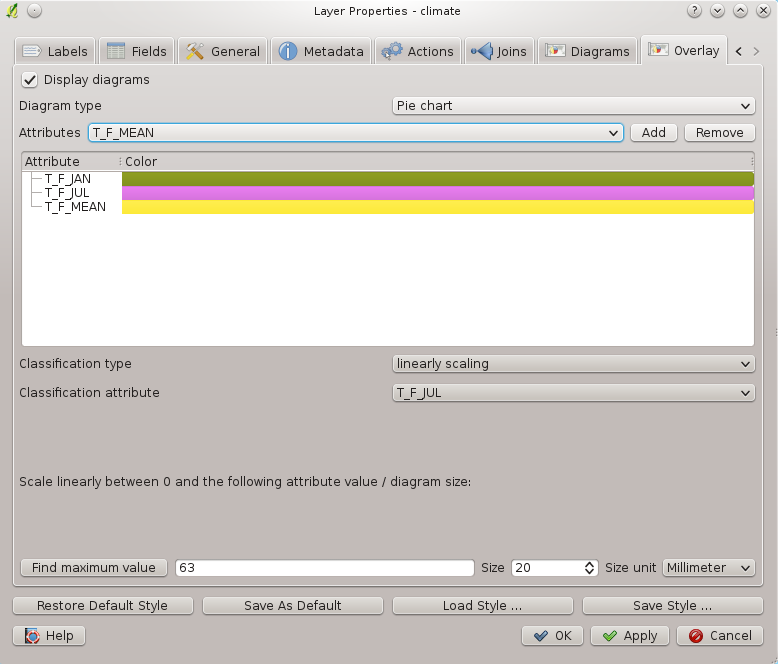
Vector properties dialog with overlay tab 
The Overlay tab provides support for Pie charts, Bar charts and proportional SVG symbols.
Similar to the Diagrams tab, we will demonstrate an example and overlay the alaska boundary layer a piechart diagram showing some temperature data from a climate vector layer. Both vector layers are part of the QGIS sample dataset (see Section Sample Data).
- First click on the
 Load Vector icon, browse to
the QGIS sample dataset folder and load the two vector shape layers
alaska.shp and climate.shp.
Load Vector icon, browse to
the QGIS sample dataset folder and load the two vector shape layers
alaska.shp and climate.shp. - Double click the climate layer in the map legend to open the Layer Properties dialog.
- Click on the Overlay tab, activate
 Display
diagrams and select ‘Pie Chart’ from Diagram type
Display
diagrams and select ‘Pie Chart’ from Diagram type  combobox.
 - We want to display the values of the three columns T_F_JAN, T_F_JUL and T_F_MEAN. First select T_F_JAN as Attributes and click the [Add] button, then T_F_JUL and finally T_F_MEAN.
- Diagram size is based on linear scaling of a classification attribute. We
choose T_F_JUL, click on [Find maximum value] and set size to 20
and Size unit to ‘Millimeter’.
- Now click [Apply] to display the diagram in the QGIS main window.
- You can now adapt the chart size, or change the attribute colors double clicking on the color values in the attribute field. Figure_overlay_2 gives an impression.
- Finally click [Ok].
Figure Overlay 2:
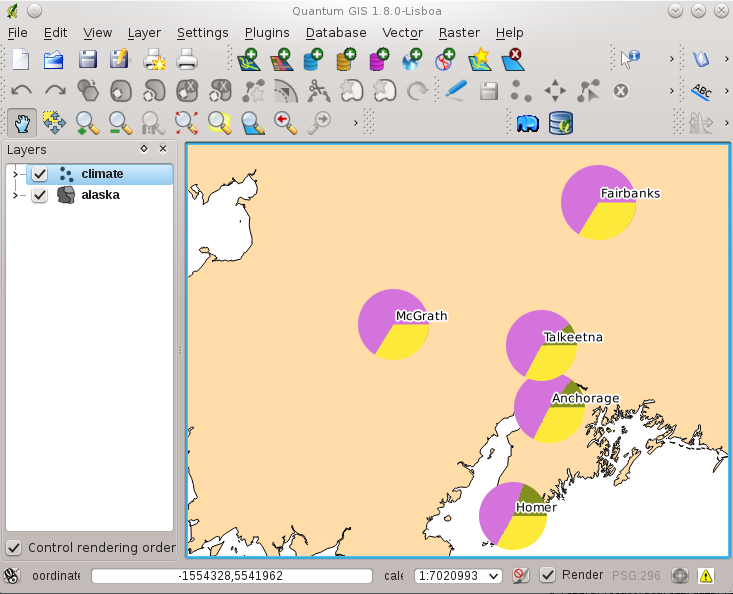
Pie chart diagram from temperature data overlayed on a map
Additionally in the Settings ‣ Options dialog, there is a Overlay tab where it is possible to select the placement algorithm of the diagrams. The ‘Central point’ method is a generic one, the others use algorithms of the PAL library. They also consider diagram objects and labels in different layers.