Introdução aos SIG
 |
Objetivos: |
Perceber o que são os SIG e a que fim se destinam. |
Palavras-chave: |
SIG, Computador, Mapas, Dados, Sistemas de Informação, Espacial, Análise. |
Enquadramento
Da mesma forma que usamos um processador de texto para escrever documentos e lidar com palavras num computador, podemos usar uma Aplicação SIG para lidar com dados geográficos num computador. SIG significa Sistemas de Informação Geográfica.
Um SIG consiste em:
- Dados Digitais –– a informação geográfica que visualiza e
e analisa usando o software e hardware de um computador.
Hardware do computador –– computadores destinados a armazenar dados, apresentar gráficos e processar informação.
Software computacional –– programas computacionais que correm sobre o hardware do computador e permitem trabalhar com dados em formato digital. Os programas que fazem parte dos SIG são chamados de aplicações SIG.
Com uma aplicação SIG podemos abrir mapas digitais no computador, cria nova informação espacial para adicionar ao mapa, imprimir mapas personalizados e efectuar analise espacial.
Let’s look at a little example of how GIS can be useful. Imagine you are a health worker and you make a note of the date and place of residence of every patient you treat.
| Longitude | Latitude | Doença |
Data |
|---|---|---|---|
| 26.870436 | -31.909519 | Papeira |
13/12/2008 |
| 26.868682 | -31.909259 | Papeira |
24/12/2008 |
| 26.867707 | -31.910494 | Papeira |
22/01/2009 |
| 26.854908 | -31.920759 | Sarampo |
11/01/2009 |
| 26.855817 | -31.921929 | Sarampo |
26/01/2009 |
| 26.852764 | -31.921929 | Sarampo |
10/02/2009 |
| 26.854778 | -31.925112 | Sarampo |
22/02/2009 |
| 26.869072 | -31.911988 | Papeira |
02/02/2009 |
| 26.863354 | -31.916406 | Varicela |
26/02/2009 |
Se verificar na tabela acima, verá rapidamente que havia um monte de casos de sarampo em janeiro e fevereiro. O nosso funcionário de saúde registou a localização da casa de cada paciente, observando a sua latitude e longitude noa tabela. Usando esses dados numa aplicação SIG, podemos rapidamente entender muito mais sobre os padrões de doença:
Figure Patterns of illness:
Mais sobre SIG
O SIG é uma área relativamente nova — começou na década de 1970. Os SIG computorizados estavam apenas disponíveis para empresas e universidades que tinham equipamentos de informática caro. Hoje em dia, qualquer pessoa com um computador pessoal ou portátil pode usar o software SIG. Ao longo do tempo as Aplicações SIG tornaram-se também mais fáceis de usar — que costumava exigir um monte de formação para usar um aplicação SIG, mas agora é muito mais fácil para começar em SIG mesmo para amadores e utilizadores esporádicos. Como descrevemos acima, o SIG é mais do que apenas software, ele refere-se a todos os aspectos da gestão e utilização de dados geográficos digitais. Nos tutoriais que se seguem iremos focar o Software SIG.
O que é Software SIG / Aplicações SIG?
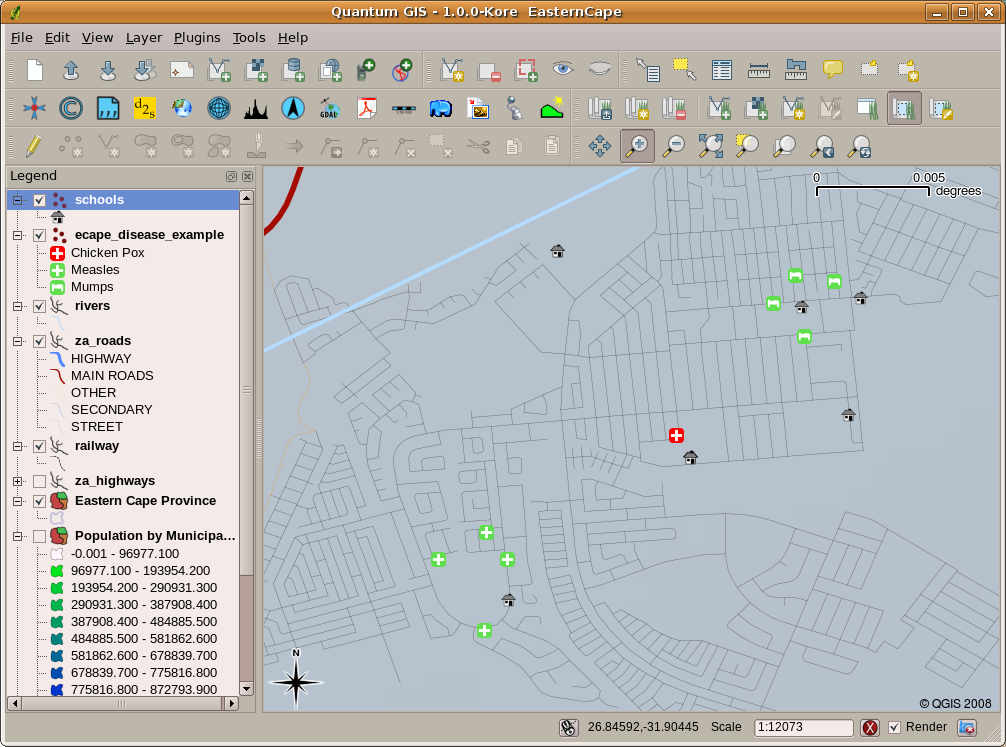
Pode ver um exemplo de como uma aplicação SIG se parece figure_gis_application. As aplicações SIG são programas com um interface gráfico que pode ser manipulado pelo utilziador utilizando o rato e teclado. A aplicação dispõe de menus perto do topo da janela (Arquivo, Editar, etc) que, quando clica com o rato, mostrar um painel de ações. Estas ações permitem indicar ao programa aquilo que pretendemos fazer. Por exemplo, pode usar os menus para solicitar à aplicação SIG para adicionar uma nova camada para o monitor.
Figure Menus in GIS Application:
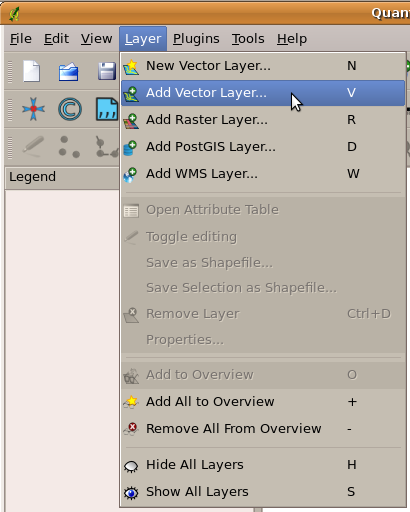
Menus da aplicação, quando clica com o rato, expande-se e apresenta uma lista de ações que podem ser realizadas.
Barras de ferramentas (linhas de pequenas imagens que podem ser clicadas com o rato) normalmente localizadas em abaixo dos menus que disponibilizam uma forma mais rápida de usar ações frequentemente necessárias.
Figure Toolbars in GIS Application:

Barra de tarefas permitem acesso rápido às funcionalidades mais utilizadas. Passando o rato sobre uma imagem, geralmente o que acontece caso clique sobre a mesma.
A common function of GIS Applications is to display map layers. Map layers are stored as files on a disk or as records in a database. Normally each map layer will represent something in the real world –– a roads layer for example will have data about the street network.
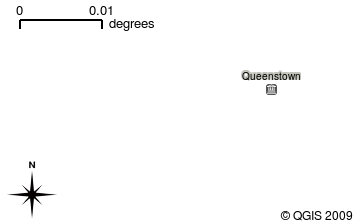
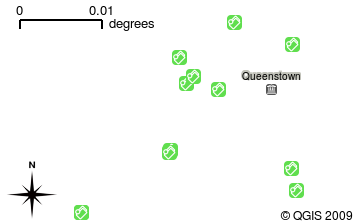
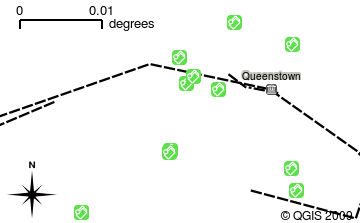
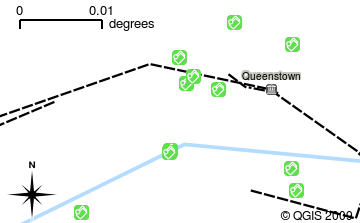
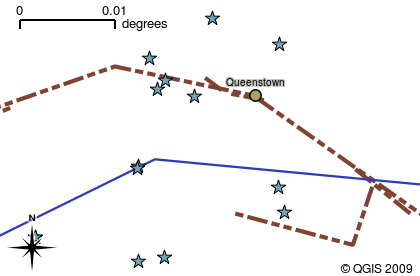
When you open a layer in the GIS Application it will appear in the map view. The map view shows a graphic representing your layer. When you add more than one layer to a map view, the layers are overlaid on top of each other. Look at figures figure_map_view_1, figure_map_view_2, figure_map_view_3 and figure_map_view_4 to see a map view that has several layers being added to it. An important function of the map view is to allow you to zoom in to magnify, zoom out to see a greater area and move around (panning) in the map.
Figure Map View 1:
Figure Map View 2:
Figure Map View 3:
Figure Map View 4:
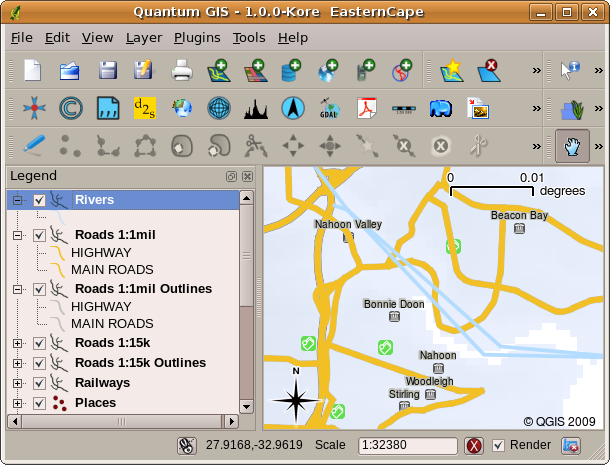
Another common feature of GIS Applications is the map legend. The map legend provides a list of layers that have been loaded in the GIS Application. Unlike a paper map legend, the map legend or ‘layers list’ in the GIS Application provides a way to re-order, hide, show and group layers. Changing the layer order is done by clicking on a layer in the legend, holding the mouse button down and then dragging the layer to a new position. In figures figure_map_legend_1 and figure_map_legend_2 the map legend is shown as the area to the left of the GIS Application window. By changing the layer order, the way that layers are drawn can be adjusted –– in this case so that rivers are drawn over the roads instead of below them.
Figure Map Symbology 1:
Figure Map Legend 1:
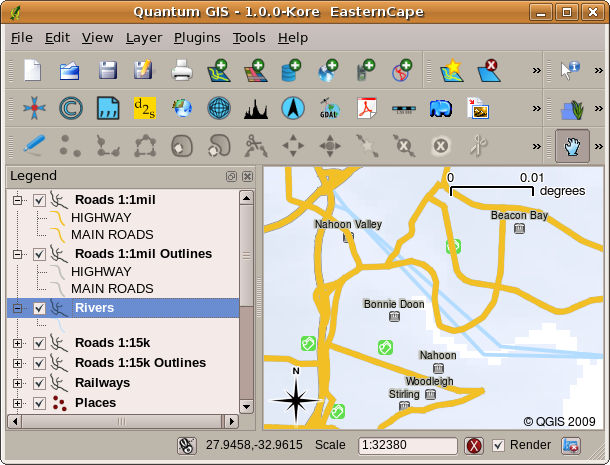
Changing the layer order allows to adjust the way that layers are drawn. Before changing the layer order, rivers are drawn underneath roads
Figure Map Legend 2:
Getting a GIS Application for your own computer(s)
There are many different GIS Applications available. Some have many sophisticated features and cost tens of thousands of Rands for each copy. In other cases, you can obtain a GIS Application for free. Deciding which GIS Application to use is a question of how much money you can afford and personal preference. For these tutorials, we will be using the QGIS Application. QGIS is completely free and you can copy it and share it with your friends as much as you like. If you received this tutorial in printed form, you should have received a copy of QGIS with it. If not, you can always visit http://hub.qgis.org/projects/quantum-gis/wiki/Download to download your free copy if you have access to the internet.
Dados SIG
Now that we know what a GIS is and what a GIS Application can do, let’s talk about GIS data. Data is another word for information. The information we use in a GIS normally has a geographical aspect to it. Think of our example above, about the health care worker. She created a table to record diseases that looked like this:
| Longitude | Latitude | Doença |
Data |
|---|---|---|---|
| 26.870436 | -31.909519 | Papeira |
13/12/2008 |
The longitude and latitude columns hold geographical data. The disease and date columns hold non-geographical data.
A common feature of GIS is that they allow you to associate information (non-geographical data) with places (geographical data). In fact, the GIS Application can store many pieces of information which are associated with each place –– something that paper maps are not very good at. For example, our health care worker could store the person’s age and gender on her table. When the GIS Application draws the layer, you can tell it to draw the layer based on gender, or based on disease type, and so on. So, with a GIS Application we have a way to easily change the appearance of the maps we created based on the non-geographical data associated with places.
GIS Systems work with many different types of data. Vector data is stored as a series of X, Y coordinate pairs inside the computer’s memory. Vector data is used to represent points, lines and areas. Illustration figure_vector_data shows different types of vector data being viewed in a GIS application. In the tutorials that follow we will be exploring vector data in more detail.
Figure Vector Data 1:
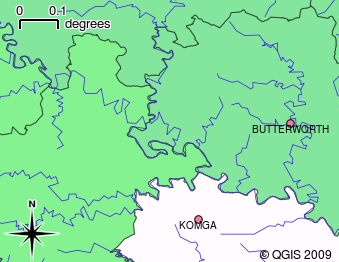
Vector data is used to represent points (e.g. towns), lines (e.g. rivers) and polygons (e.g. municipal boundaries).
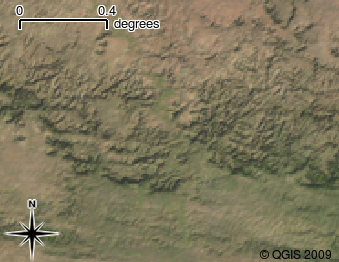
Raster data are stored as a grid of values. There are many satellites circling the earth and the photographs they take are a kind of raster data that can be viewed in a GIS. One important difference between raster and vector data is that if you zoom in too much on a raster image, it will start to appear ‘blocky’ (see illustrations figure_raster_data_1 and figure_raster_data_2). In fact these blocks are the individual cells of the data grid that makes up the raster image. We will be looking at raster data in greater detail in later tutorials.
Figure Raster Data 1:
Figure Raster Data 2:
O que aprendemos?
Vamos encerrar o que abrangemos nesta ficha de trabalho:
- A GIS is a system of computer hardware, computer software and geographical data.
- A GIS Application allows you to view geographical data and is an important part of the GIS.
- A GIS Application normally consists of a menu bar, toolbars, a map view and a legend.
- Vector and raster data are geographical data used in a GIS application.
- Geographical data can have associated non-geographical data.
Agora experimente!
Aqui está algumas ideias para experimentar com os seu alunos:
- Geography: Describe the concept of GIS to your learners as outlined in this
tutorial. Ask them to try to think of 3 reasons why it might be handy to use a
GIS instead of paper maps. Here are some that we could think of:
- GIS Applications allow you to create many different types of maps from the same data.
- GIS is a great visualisation tool that can show you things about your data and how they are related in space (e.g. those disease outbreaks we saw earlier).
- Paper maps need to be filed and are time consuming to view. The GIS can hold a very large amount of map data and make it quick and easy to find a place you are interested in.
- Geography: Can you and your learners think of how raster data from
satellites could be useful? Here are some ideas we had:
- During natural disasters, raster data can be useful to show where the impacted areas are. For example a recent satellite image taken during a flood can help to show where people may need rescuing.
- Sometimes people do bad things to the the environment, like dumping dangerous chemicals that kill plants and animals. Using raster data from satellites can help us to monitor for these type of problems.
- Town planners can use raster data from satellites to see where informal settlements are and to help in planning infrastructure.
Alguma coisa em que devemos pensar
Se não tiver um computador disponível, muitos dos tópicos mencionados neste tutorial podem ser reproduzidos e sobrepostos usando a mesma técnica dos layers. No entanto, para entender devidamente SIG o ideal será usar um computador.
Outras leituras
Livro: Desktop GIS: Mapping the Planet with Open Source Tools. Autor: Gary Sherman. ISBN: 9781934356067
Website: http://www.gisdevelopment.net/tutorials/tuman006.htm
O Guia de Utilizador do QGIS também tem informação mais detalhada de como trabalhar com QGIS.
O que vem a seguir?
In the sections that follow we are going to go into more detail, showing you how to use a GIS Application. All of the tutorials will be done using QGIS. Next up, let’s look at vectors!
