5. 入门指南
本章简要介绍了QGIS的安装、QGIS示例数据的下载和运行第一个简单的栅格数据和矢量数据可视化的案例。
5.1. 安装QGIS
QGIS项目根据您的平台提供了不同的安装QGIS的方法。
5.1.1. 二进制文件安装
标准安装适用于  Widows操作系统和
  macOS操作系统。二进制包(rmp和deb格式)或者软件库方式适用于多种版本的GUN/Linux
  操作系统。
操作系统。
有关您的操作系统的更多信息和说明请查看https://download.qgis.org。
5.1.2. 从源代码安装
If you need to build QGIS from source, please refer to the installation
instructions. They are distributed with the QGIS source code in a file
called INSTALL. You can also find them online at
https://github.com/qgis/QGIS/blob/master/INSTALL.md.
如果你想要编译一个特定版本,而不是开发中的版本,你需要将上面提到的连接中的`master`` 替换为发行分支(通常为``release-X_Y``形式)。(安装说明可能会有不同)
5.1.3. 安装到外媒介
可以将QGIS(包括所有的插件和设置)安装到一个闪存驱动器上。这是通过定义一个 --profiles-path 选项来实现的,该选项覆盖默认的用户配置文件( user profile)路径,并强制设置( QSettings )也使用这个目录。更多信息请查阅系统设置( System Settings )章节。
5.1.4. 下载示例数据
本用户指南包含基于QGIS示例数据集(也称为阿拉斯加数据集``Alaska dataset``)的示例。
Windows安装程序有一个下载QGIS示例数据集的选项。如果勾选此项,数据将被下载到你的文档文件夹( Documents),并放在一个名为:file:`GIS Database`的文件夹中。您可以使用Windows资源管理器将此文件夹移动到任何方便的位置。如果您在最初的QGIS安装过程中没有选中安装示例数据集的复选框,您可以执行以下操作之一:
使用您已有的GIS数据
Download sample data from https://github.com/qgis/QGIS-Sample-Data/archive/master.zip and unzip the archive on any convenient location on your system.
卸载QGIS,然后重新安装并勾选下载示例数据选项(仅在以上解决方案都不成功的情况推荐使用)
For GNU/Linux and macOS, there are no dataset installation
packages available as rpm, deb or dmg. To use the sample dataset, download it
from https://github.com/qgis/QGIS-Sample-Data/archive/master.zip and unzip the archive
on any convenient location on your system.
阿拉斯加数据集包含了用于示例和用户手册中截图的所有GIS数据。它还包含了一个较小的GRASS数据库。QGIS样本数据集的投影坐标系是单位为英尺的阿拉斯加阿尔伯斯等面积坐标系(Alaska Albers Equal Area)。该投影坐标系的EPSG号为2964。
PROJCS["Albers Equal Area",
GEOGCS["NAD27",
DATUM["North_American_Datum_1927",
SPHEROID["Clarke 1866",6378206.4,294.978698213898,
AUTHORITY["EPSG","7008"]],
TOWGS84[-3,142,183,0,0,0,0],
AUTHORITY["EPSG","6267"]],
PRIMEM["Greenwich",0,
AUTHORITY["EPSG","8901"]],
UNIT["degree",0.0174532925199433,
AUTHORITY["EPSG","9108"]],
AUTHORITY["EPSG","4267"]],
PROJECTION["Albers_Conic_Equal_Area"],
PARAMETER["standard_parallel_1",55],
PARAMETER["standard_parallel_2",65],
PARAMETER["latitude_of_center",50],
PARAMETER["longitude_of_center",-154],
PARAMETER["false_easting",0],
PARAMETER["false_northing",0],
UNIT["us_survey_feet",0.3048006096012192]]
如果您打算使用QGIS作为GRASS的图形化前端,您可以在GRASS GIS官方网站上找到一些示例位置(例如,斯皮尔菲什市Spearfish或南达科他South Dakota),网址为 https://grass.osgeo.org/download/sample-data/
5.2. 启动和关闭QGIS
QGIS可以像您电脑上的其他应用一样打开。这意味着你可以通过以下方式打开:
使用
应用菜单, 开始菜单,或者 DOCK在应用文件夹或者桌面快捷方式上双击
双击一个已经存在的QGIS项目文件(扩展名为
.qgz或者.qgs)。注意,这也将打开项目。在命令提示符里输入
qgis(假设QGIS已经被添加到默认路径PATH里面,或者当前目录为安装目录)
关闭QGIS,使用:
- 菜单选项 ,或者用快捷键 Ctrl+Q
- ,或者使用快捷键 Cmd+Q
或者使用应用程序主界面右上角的红十字。
5.3. 案例:加载栅格图层和矢量图层
现在你已经安装好了QGIS(QGIS installed ),也有了一个示例数据集(sample dataset ),接下来我们将演示第一个样本范例。在这个例子中,我们将一个栅格图层和一个矢量图层进行可视化。我们将使用:
土地覆盖(
landcover)栅格图层 (qgis_sample_data/raster/landcover.img)和湖泊(
lakes)矢量图层 (qgis_sample_data/gml/lakes.gml)
其中, qgis_sample_data 代表数据集解压目录。
启动QGIS,参见启动和关闭QGIS(启动和关闭QGIS)。
在QGIS中加载文件:
单击|dataSourceManager| :sup:`打开数据源管理器`图标。数据源管理器应该在浏览器模式下打开。
浏览到文件夹
qgis_sample_data/raster/选择 ERDAS IMG 文件
landcover.img,然后双击。土地覆盖图层在后台被添加,同时数据源管理器窗口依旧保持打开状态。
图 5.1 在QGIS中添加数据到新项目
要加载湖泊数据,请浏览到
qgis_sample_data/gml/文件夹,然后双击:file:`lakes.gml`文件打开。打开 坐标参考系选择器`对话框。 在 :guilabel:`过滤器 菜单中输入``2964``,过滤下面的坐标参考系列表。

图 5.2 Select the Coordinate Reference System of data
Select the NAD27 / Alaska Alberts entry
Click OK
Close the Data Source Manager window
You now have the two layers available in your project in some random colours. Let's do some customization on the lakes layer.
Select the
 Zoom In tool on the Navigation toolbar
Zoom to an area with some lakes
Double-click the
lakeslayer in the map legend to open the Properties dialogTo change the lakes color:
Click on the
 Symbology tab
Select blue as fill color.
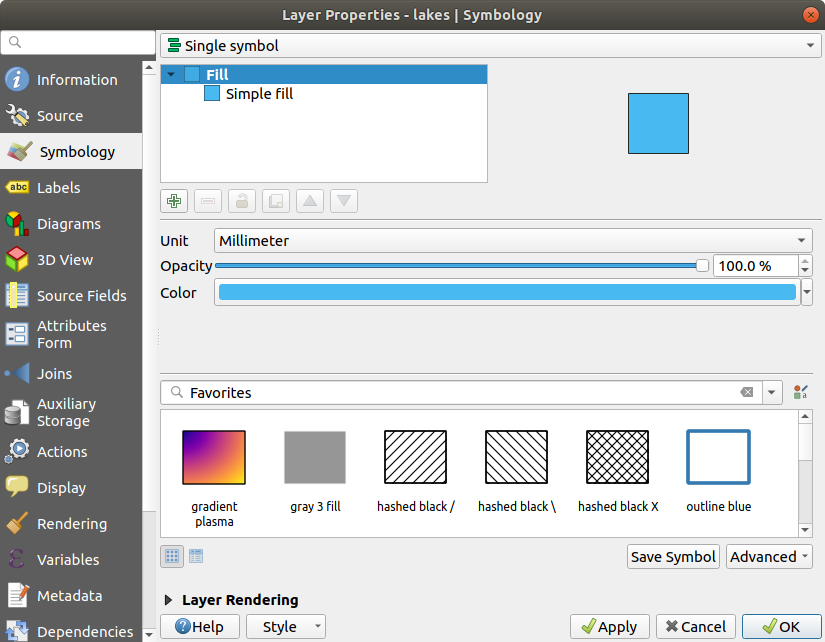
图 5.3 Selecting Lakes color
Press OK. Lakes are now displayed in blue in the map canvas.
To display the name of the lakes:
Reopen the
lakeslayer Properties dialogClick on the
 Labels tab
Select Single labels in the drop-down menu to enable labeling.
From the Label with list, choose the
NAMESfield.
图 5.4 Showing Lakes names
Press Apply. Names will now load over the boundaries.
You can improve readability of the labels by adding a white buffer around them:
Click the Buffer tab in the list on the left
Check
 Draw text buffer
Choose
3as buffer sizeClick Apply
Check if the result looks good, and update the value if needed.
Finally click OK to close the Layer Properties dialog and apply the changes.
Let's now add some decorations in order to shape the map and export it out of QGIS:
Select menu
In the dialog that opens, check
Enable Scale Bar optionCustomize the options of the dialog as you want
Press Apply
Likewise, from the decorations menu, add more items (north arrow, copyright...) to the map canvas with custom properties.
Click

Press Save in the opened dialog
Select a file location, a format and confirm by pressing Save again.
Press
 to
store your changes as a
to
store your changes as a .qgzproject file.
That's it! You can see how easy it is to visualize raster and vector layers in QGIS, configure them and generate your map in an image format you can use in other softwares. Let's move on to learn more about the available functionality, features and settings, and how to use them.
注解
To continue learning QGIS through step-by-step exercises, follow the Training manual.