2.4. Lesson: 심볼
심볼은 맵 상에 레이어를 시각적으로 표현하는 방법입니다. 공간 성격을 가지는 데이터를 표현하는 다른 방법들에 비해, GIS의 강점은 사용자가 작업하는 데이터의 역동적인 시각적 표현을 할 수 있다는 것입니다.
따라서 맵의 (개별 레이어의 심볼에 의존하는) 시각적 표현이 매우 중요합니다. 여러분이 생산한 맵의 최종 이용자는 맵이 나타내는 내용을 쉽게 알아볼 수 있어야 합니다. 마찬가지로 여러분이 작업할 때 데이터를 탐색할 수 있어야 하는데, 훌륭한 심볼이 큰 도움이 됩니다.
즉 적절한 심볼을 갖추는 일은 그냥 그러면 좋다 정도의 일이 아니라는 겁니다. 여러분이 GIS를 제대로 사용하려면, 사람들이 이용할 수 있는 맵과 정보를 생산하려면, 심볼이 필수적입니다.
이 강의의 목표: 벡터 레이어에 대해 사용자가 원하는 심볼을 생성하기.
2.4.1.  Follow Along: 색상 변경
레이어의 심볼을 변경하려면 해당 레이어의 Layer Properties 를 여십시오. 먼저 landuse 레이어의 색상을 바꿔봅시다.
레이어목록의 landuse 레이어에서 마우스 우클릭하십시오.
Select the menu item Properties… in the menu that appears.
참고
레이어 목록에서 레이어를 더블 클릭해도 레이어 속성에 접근할 수 있습니다.
In the Layer Properties window, select the
 Symbology tab:
Click the color select button next to the Color label. A standard color dialog will appear.
회색을 선택한 다음 OK 를 클릭합니다.
다시 Layer Properties 창의 OK 를 클릭하면 레이어의 색상이 변경되는 것을 볼 수 있습니다.
2.4.2.  Try Yourself
water 레이어의 색을 light blue로 변경하십시오. Layer Properties 메뉴 대신 Layer Styling 화면을 대신 사용해 보십시오.
2.4.3.  Follow Along: 심볼 구조 변경
색상만 제대로 바꿔도 맵이 괜찮아지지만, 레이어의 심볼에는 색상만 있는 것이 아닙니다. 이제 서로 다른 토지이용구역 사이의 라인을 제거해서 맵이 너무 조밀하게 보이지 않도록 해보겠습니다.
landuse 레이어의 Layer Properties 창을 엽니다.
Under the
 Symbology tab, you will see the same kind
of dialog as before. This time, however, you’re doing more than just quickly
changing the color.
Symbology tab, you will see the same kind
of dialog as before. This time, however, you’re doing more than just quickly
changing the color.In the symbol layers tree, expand the Fill dropdown and select the Simple fill option.
Click on the Stroke style dropdown. At the moment, it should be showing a short line and the words Solid Line.
이것을 No Pen 으로 바꾸십시오.

OK 를 클릭합니다.
이제 landuse 레이어의 구역 사이에 있던 라인들이 사라질 것입니다.
2.4.4.  Try Yourself
Change the water layer’s symbology again so that it has a darker blue outline.
rivers 레이어의 심볼을 변경해서 수로를 합리적으로 표현해보십시오.
Remember: you can use the  Open the Layer Styling panel
button and see all the changes instantly. That panel also allows you to undo
individual changes while symbolizing a layer.
2.4.5.  Follow Along: 축척 기반 가시성
가끔 레이어가 특정 축척에서 잘 맞지 않는다고 느껴질 때가 있습니다. 예를 들면 전 대륙을 담은 데이터셋은 상세함이 부족해서 마을 수준에서는 정확하지 않을 수도 있습니다. 이런 경우 부적절한 축척에서 해당 데이터셋을 숨기는 편이 좋습니다.
우리의 경우 작은 스케일의 뷰에서 빌딩을 숨겨보십시오. 예를들어 이 지도…
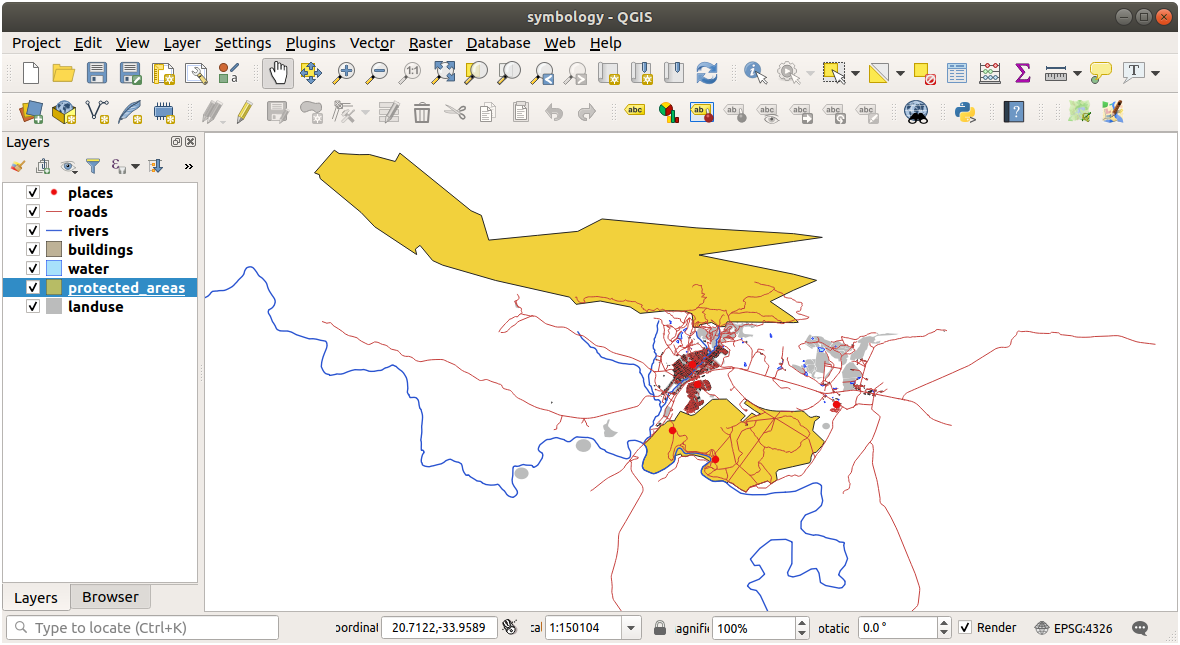
…은(는) 유용하지 않습니다. 이 스케일에서 빌딩을 구별할 수 없습니다.
축척 기반 렌더링을 활성화하려면,
buildings 레이어의 Layer Properties 대화 창을 엽니다.
Enable scale-based rendering by clicking on the checkbox labeled Scale dependent visibility:
Change the Minimum value to
1:10000.
OK 를 클릭합니다.
그 결과 맵이 어떻게 변하는지 줌인/줌아웃해보십시오. buildings 레이어가 언제 사라지고 언제 나타나는지 아시겠습니까?
2.4.6.  Follow Along: 심볼 레이어 추가
이제 레이어에서 단순한 심볼을 변경하는 방법을 알았으니, 다음으로 좀 더 복잡한 심볼을 생성해볼 차례입니다. QGIS에서는 심볼 레이어를 이용합니다.
Go back to the landuse layer’s symbol properties panel (by clicking Simple fill in the symbol layers tree).
이 예제의 현재 심볼에는 윤곽선이 없습니다. (즉 No Pen 경계선 스타일을 사용하고 있습니다.)

Select the Fill level in the tree and click the
 Add symbol layer button.
The dialog will change to look something like this, with a new symbol layer
added:
It may appear somewhat different in color, for example, but you’re going to change that anyway.
이제 두 번째 심볼 레이어가 나타납니다. 단색이기 때문에, 당연히 이전 심볼 유형을 완전히 가리게 됩니다. 또 이 레이어는 Solid Line 경계선 스타일을 사용하는데, 당연히 이 심볼을 바꿔야 합니다.
참고
맵 레이어와 심볼 레이어를 착각하지 않는 것이 중요합니다. 맵 레이어는 맵에 로드된 벡터(또는 래스터)입니다. 심볼 레이어는 맵 레이어를 표현하는 데 쓰이는 심볼의 일부입니다. 이 강의에서는 착각하지 않도록 맵 레이어를 보통 그냥 레이어로 부르지만, 심볼 레이어는 언제나 심볼 레이어라고 부릅니다.
With the new Simple Fill symbol layer selected:
이전처럼 경계선 스타일을 No Pen 으로 설정합니다.
면 스타일을 다음과 같이 Solid 또는 No brush 이외의 것으로 변경합니다.

OK 를 클릭합니다.
Now you can see your results and tweak them as needed. You can even add multiple extra symbol layers and create a kind of texture for your layer that way.
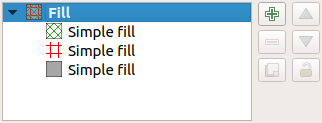
재미있죠! 그러나 실제 맵에 사용하기에는 색상이 너무 많을지도 모르겠군요…
2.4.7.  Try Yourself
필요한 경우 줌인해서, 앞에서 설명한 방업으로 buildings 레이어에 간단하지만 보기 쉬운 텍스처를 생성하는 작업을 잊지 마십시오.
2.4.8.  Follow Along: 심볼 수준 순서 배열
서로 다른 맵 레이어를 렌더링할 때와 마찬가지로 심볼 레이어도 순차적으로 렌더링됩니다. 즉 하나의 심볼에 많은 심볼 레이어를 사용할 경우 기대하지 않은 결과가 나올 수도 있다는 이야기입니다.
(앞에서 설명한 방법대로) roads 레이어에 심볼 레이어를 추가합니다.
Give the base line a Stroke width of
1.5and a black color.Give the new, uppermost layer a thickness of
0.8and a white color.
그러면 이렇게 보입니다.
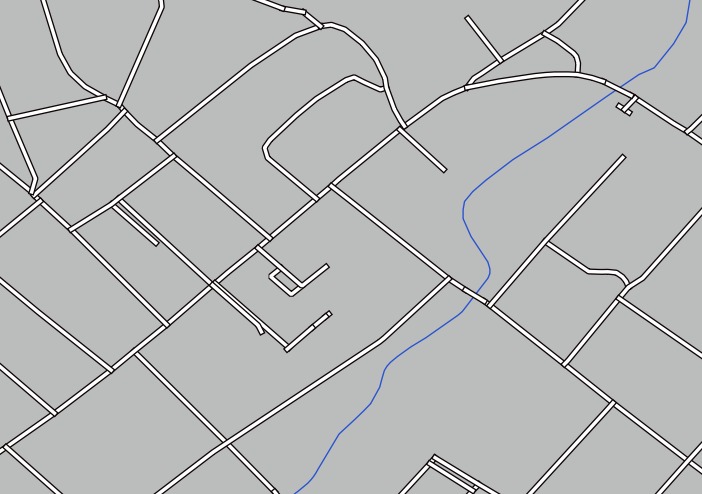
Well, roads have now a street like symbology, but you see that lines are overlapping each others at each cross. That’s not what we want at all!
이런 일이 일어나지 않게 하려면, 심볼 레이어의 순서를 바꿔 서로 다른 심볼 레이어들이 렌더링 되는 순서를 조정해야 합니다.
To change the order of the symbol layers:
Select the topmost Line layer in the symbol layers tree.
Click in the bottom right-hand corner of the window.

This will open a dialog like this:

Check
 Enable symbol levels. You can then set the
layer order of each symbol by entering the corresponding level number.
0 is the bottom layer.
Enable symbol levels. You can then set the
layer order of each symbol by entering the corresponding level number.
0 is the bottom layer.In our case, we just want to activate the option, like this:

This will render the white line above the thick black line borders:
OK 를 두 번 클릭해서 맵으로 돌아갑니다.
이제 맵이 다음과 같이 보이게 됩니다.

When you’re done, remember to save the symbol itself so as not to lose your work if you change the symbol again in the future. You can save your current symbol style by clicking the Save Style… button at the bottom of the Layer Properties dialog. We will be using the QGIS QML Style File format.
Save your style in the solution/styles/better_roads.qml folder. You can load a
previously saved style at any time by clicking the Load Style…
button. Before you change a style, keep in mind that any unsaved style you are
replacing will be lost.
2.4.9.  Try Yourself
roads 레이어의 모양을 다시 바꿔봅시다.
Make the roads narrow and yellow, with a thin, pale gray outline and a thin black line in the middle. Remember that you may need to change the layer rendering order via the dialog.

2.4.10.  Try Yourself
Symbol levels also work for classified layers (i.e., layers having multiple symbols). Since we haven’t covered classification yet, you will work with some rudimentary pre-classified data.
새 맵을 생성하고 roads 데이터셋만 추가하십시오.
Load the style file
advanced_levels_demo.qmlprovided inexercise_data/styles.Swellendam 지역으로 줌인합니다.
심볼 레이어를 이용해서 다음 그림처럼 레이어의 윤곽선이 서로 이어지도록 만드십시오.

2.4.11.  Follow Along: 심볼 레이어 유형
In addition to setting fill colors and using predefined patterns, you can use different symbol layer types entirely. The only type we’ve been using up to now was the Simple Fill type. The more advanced symbol layer types allow you to customize your symbols even further.
벡터의 각 (포인트, 라인, 폴리곤) 유형은 각각 고유한 심볼 레이어 유형 그룹을 갖추고 있습니다. 먼저 포인트에 사용할 수 있는 유형들을 살펴보겠습니다.
2.4.11.1. 포인트 심볼 레이어 유형
Uncheck all the layers except for places.
places 레이어의 심볼 속성을 변경합니다.

You can access the various symbol layer types by selecting the Simple marker layer in the symbol layers tree, then click the Symbol layer type dropdown:

사용할 수 있는 다양한 옵션들을 살펴보고, 사용자가 적합하다고 생각하는 스타일의 심볼을 선택하십시오.
If in doubt, use a round Simple marker with a white border and pale green fill, with a Size of
3.00and a Stroke width of0.5.
2.4.11.2. 라인 심볼 레이어 유형
라인 데이터에 쓸 수 있는 다양한 옵션들을 보려면,
Change the Symbol layer type for the roads layer’s topmost symbol layer to Marker line:

Select the Simple marker layer in the symbol layers tree. Change the symbol properties to match this dialog:

Select the Marker line layer and change the interval to
1.00:
Ensure that the symbol levels are correct (via the dialog we used earlier) before applying the style.
스타일을 적용한 다음, 맵 상에 스타일이 어떻게 표현되는지 살펴보십시오. 이 심볼들은 도로를 따라 기울기가 바뀌지만, 언제나 그런 것은 아닙니다. 이는 어떤 목적에는 부합하지만, 다른 목적에는 아닐 수도 있습니다. 원한다면 해당 심볼 레이어를 원래대로 다시 바꿀 수 있습니다.
2.4.11.3. 폴리곤 심볼 레이어 유형
폴리곤 레이어에 쓸 수 있는 다양한 옵션들을 보려면,
Change the Symbol layer type for the water layer, as before for the other layers.
목록에 있는 서로 다른 옵션들이 각각 어떤 작용을 하는지 살펴보십시오.
여러분이 어울린다고 생각하는 옵션을 하나 선택하십시오.
고르기 힘든 경우, Point pattern fill 을 선택하고, 다음 옵션을 적용합니다.


일반적인 Simple fill 로 새 심볼 레이어를 추가합니다.
아두운 파란색 경계선을 가진 동일한 밝은 파란색으로 변경합니다.
Move down 버튼을 이용해 Point pattern 심볼 레이어 아래로 이동시킵니다.

이제 water 레이어에 텍스처 심볼이 적용됐습니다. 이렇게 하면 사용자가 텍스처를 구성하는 개별 점들의 크기, 형태, 밀도를 마음대로 설정할 수 있습니다.
2.4.12.  Try Yourself
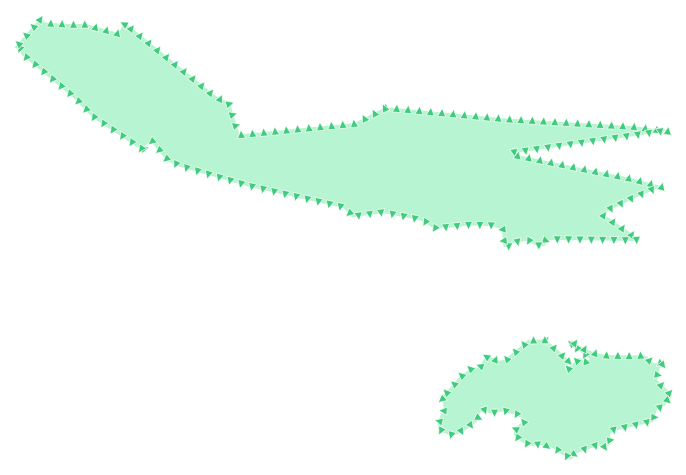
Apply a green transparent fill color to the protected_areas layer, and change the outline to look like this:
2.4.13.  Follow Along: Geometry generator symbology
You can use the Geometry generator symbology with all layer types (points, lines and polygons). The resulting symbol depends directly on the layer type.
Very briefly, the Geometry generator symbology allows you to run some spatial operations within the symbology itself. For example you can run a real centroid spatial operation on a polygon layer without creating a point layer.
Moreover, you have all the styling options to change the appearance of the resulting symbol.
Let’s give it a try!
Select the water layer.
Click on Simple fill and change the Symbol layer type to Geometry generator.

Before to start writing the spatial query we have to choose the Geometry Type in output. In this example we are going to create centroids for each feature, so change the Geometry Type to Point / Multipoint.
Now let’s write the query in the query panel:
centroid($geometry)

When you click on OK you will see that the water layer is rendered as a point layer! We have just run a spatial operation within the layer symbology itself, isn’t that amazing?

With the Geometry generator symbology you can really go over the edge of normal symbology.
2.4.13.1.  Try Yourself
Geometry generator are just another symbol level. Try to add another Simple fill underneath the Geometry generator one.
Change also the appearance of the Simple marker of the Geometry generator symbology.
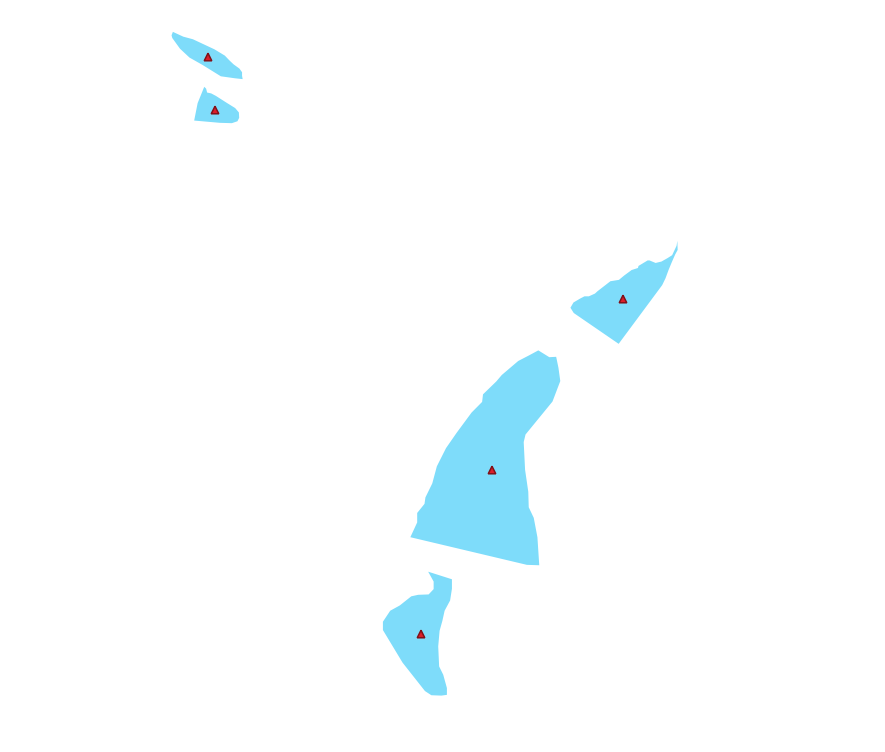
The final result should look like this:
2.4.14.  Follow Along: 사용자 지정 SVG 채우기 생성
참고
이 예제를 하기 위해서는, 무료 벡터 편집 소프트웨어 Inkscape 가 설치되어 있어야 합니다.
Start the Inkscape program. You will see the following interface:

Corel 같은 다른 벡터 이미지 편집 프로그램을 사용해본 적이 있다면 이 화면이 익숙할 것입니다.
먼저 캔버스 크기를 작은 텍스처에 적당하도록 변경합니다.
메뉴에서 항목을 클릭하십시오. Document Properties 대화 창이 나타날 것입니다.
Units 를 px 로 바꿉니다.
Change the Width and Height to
100.변경이 끝났으면 대화 창을 닫습니다.
메뉴에서 항목을 클릭해서 여러분이 작업할 페이지를 보십시오.
Circle 도구를 선택한 다음,

페이지 위에서 클릭&드래그해서 타원을 그리십시오. 이 원을 그리려면, Ctrl 버튼을 누른 채 클릭&드래그하십시오.
방금 그린 원을 오른쪽 클릭해서 Fill and Stroke 옵션 대화창을 여십시오. 다음과 같이 원의 렌더링을 조정할 수 있습니다.
Fill 색상을 좀더 연한 청회색으로 변경합니다.
Stroke paint 탭에서 외곽선 색상을 더 진한 색으로 지정합니다.
마지막으로 Stroke style 탭에서 외곽선 너비를 줄입니다.

Pencil 도구를 사용해서 라인을 그리십시오.
Click once to start the line. Hold Ctrl to make it snap to increments of 15 degrees.
Move the pointer horizontally and place a point with a simple click.
Click and snap to the vertex of the line and trace a vertical line, ended by a simple click.
Now join the two end vertices.
Change the color and width of the triangle symbol to match the circle’s stroke and move it around as necessary, so that you end up with a symbol like this one:

If the symbol you get satisfies you, then save it as landuse_symbol under the directory that the course is in, under
exercise_data/symbols, as SVG file.
QGIS로 돌아와서,
Open the Layer Properties for the
landuselayer.In the
 Symbology tab, change the symbol structure by
changing the Symbol Layer Type to SVG Fill```
shown below.
Symbology tab, change the symbol structure by
changing the Symbol Layer Type to SVG Fill```
shown below.Click the … button and then Select File… to select your SVG image.
It’s added to the symbol tree and you can now customize its different characteristics (colors, angle, effects, units…).
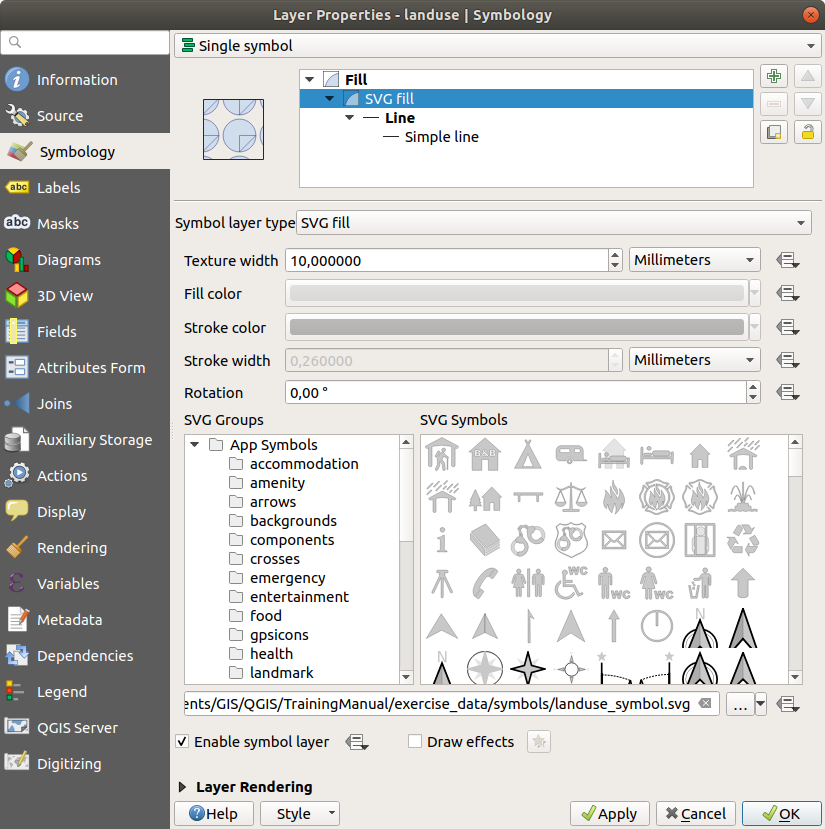
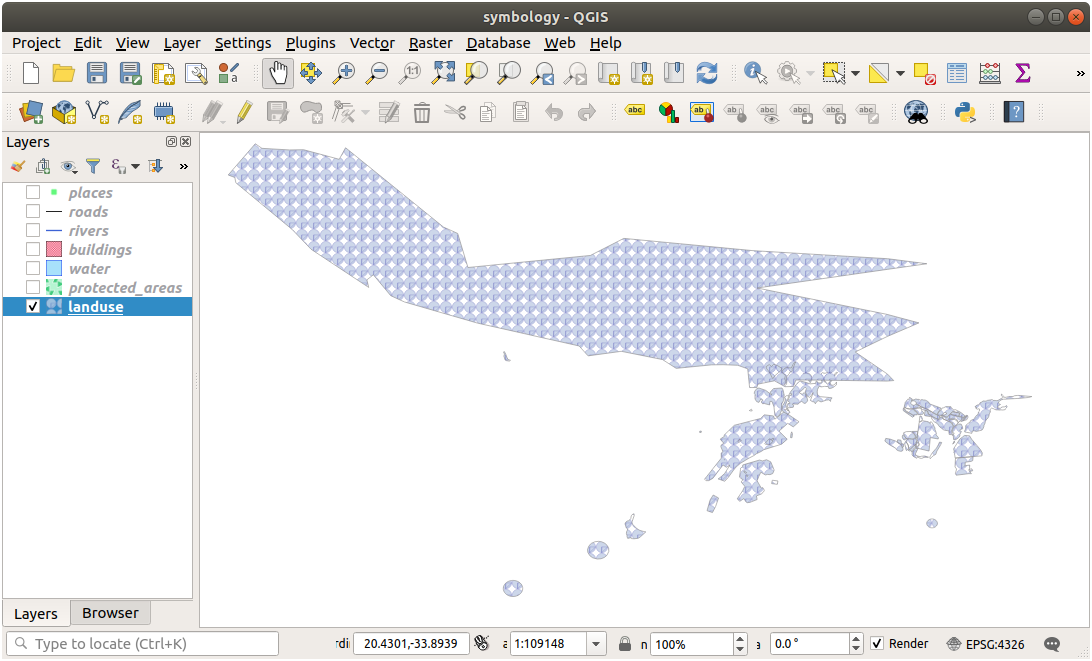
Once you validate the dialog, features in landuse layer should now be covered by a set of symbols, showing a texture like the one on the following map. If textures are not visible, you may need to zoom in the map canvas or set in the layer properties a bigger Texture width.
2.4.15. In Conclusion
서로 다른 레이어에 대한 심볼들을 변경하는 작업이 한 무리의 벡터 파일로 저장되었고, 맵도 판독 가능해졌습니다. 여러분이 작업에 익숙해진 것은 물론, 보기 좋은 맵이 되기까지 했군요!
2.4.16. Further Reading
2.4.17. What’s Next?
전체 레이어의 심볼을 변경하는 작업은 유용하지만, 이 맵을 읽는 사람이 각 레이어 안에 담긴 정보에 접근할 수는 없습니다. 거리명은 무엇인가? 특정 지역이 속한 행정구역은 어디인가? 이 농장의 상대표면적은 얼마나 되나? 이 모든 정보가 아직 숨겨져 있습니다. 다음 강의에서 여러분이 만든 맵에 이런 데이터를 어떻게 표현하는지에 대해 설명하겠습니다.
참고
지금 여러분의 맵을 저장해야 할 때라는 건 잊지 않으셨죠?


