17.24. Mai multe utilizări ale execuției iterative a algoritmilor
Note
Această lecție vă arată cum să combinați execuția iterativă a algoritmilor cu modelatorul, pentru a extinde automatizarea.
Execuția iterativă a algoritmilor este disponibilă nu doar pentru algoritmii încorporați, ci, de asemenea, și pentru algoritmii pe care îi puteți crea, cum ar fi modelele. Vom vedea cum putem combina un model cu executarea iterativă a algoritmilor, astfel încât să putem obține cu ușurință rezultate mai complexe.
The data the we are going to use for this lesson is the same one that we already used for the last one. In this case, instead of just clipping the DEM with each watershed polygon, we will add some extra steps and calculate a hypsometric curve for each of them, to study how elevation is distributed within the watershed.
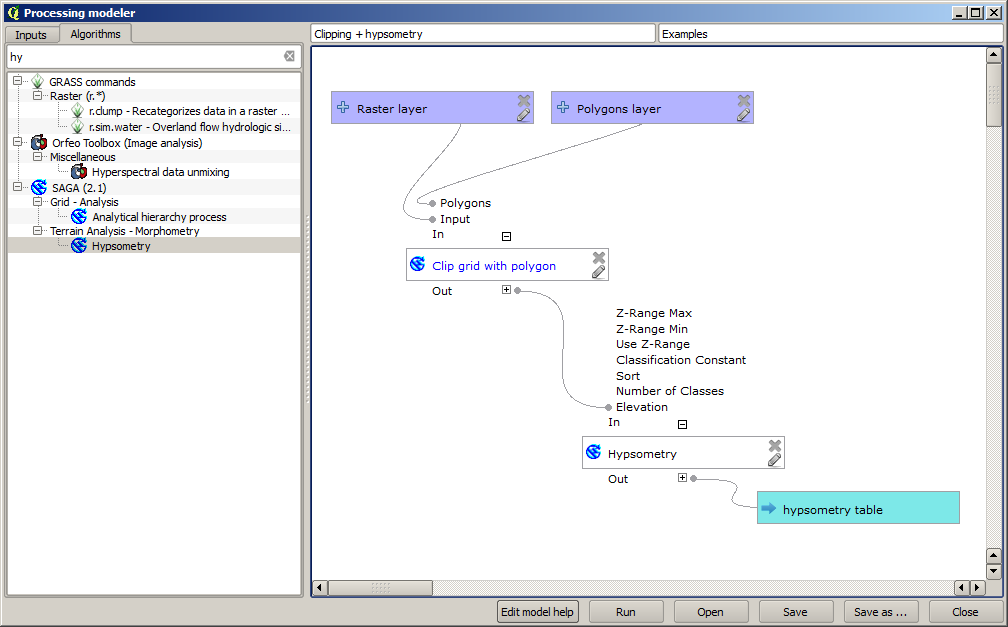
Since we have a workflow that involves several steps (clipping + computing the hypsometric curve), we should go to the modeler and create the corresponding model for that workflow.
You can find the model already created in the data folder for this lesson, but it would be good if you first try to create it yourself. The clipped layer is not a final result in this case, since we are just interested in the curves, so this model will not generated any layers, but just a table with the curve data.
Modelul ar trebui să arate astfel:
Adăugați modelul în dosarul corespunzător, astfel încât el să fie disponibil în bara de instrumente, apoi rulați-l.
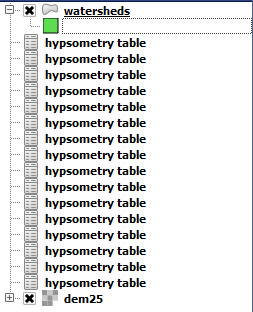
Select the DEM and watersheds basins, and do not forget to toggle the button that indicates that the algorithm has to be run iteratively.
Algoritmul va fi rulat de mai multe ori, iar tabelele corespunzătoare vor fi create și deschise în proiectul dvs. QGIS.
We can make this example more complex by extending the model and computing some slope statistics. Add the Slope, aspect, curvature algorithm to the model, and then the Raster statistics algorithm, which should use the slope output as its only input.
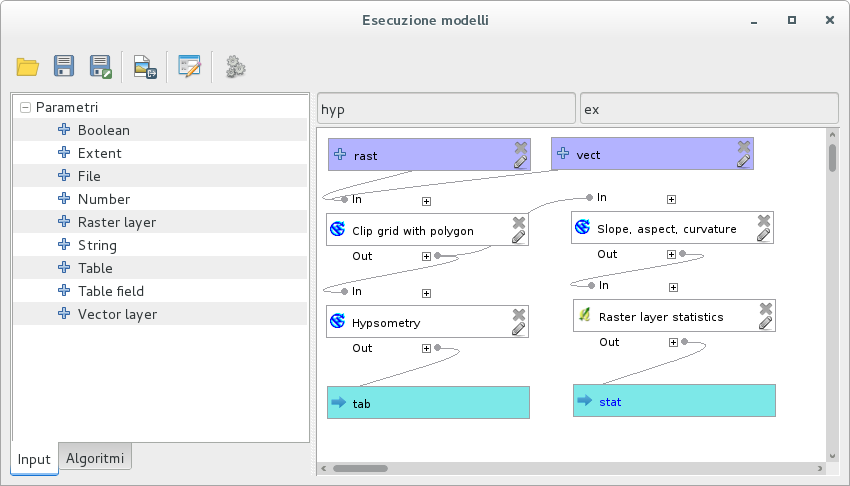
Dacă rulați acum modelul, în afară de tabele, veți obține un set de pagini cu statistici. Aceste pagini vor fi disponibile în caseta de dialog a rezultatelor.