14.7. Lesson: Calcularea Parametrilor Forestieri
Estimating the parameters of the forest is the goal of the forest inventory. Continuing the example from previous lesson, you will use the inventory information gathered in the field to calculate the forest parameters, for the whole forest first, and then for the stands you digitized before.
Scopul acestei lecții: De a calcula parametrii forestieri la nivel general și la nivel de pâlc.
14.7.1.  Follow Along: Adăugarea Rezultatelor Inventarului
The field teams visited the forest and with the help of the information you provided, gathered information about the forest at every sample plot.
Most often the information will be collected into paper forms in the field, then typed to a spreadsheet. The sample plots information has been condensed into a .csv file that can be easily open in QGIS.
Continuând cu proiectul QGIS din lecția despre proiectarea inventarului, probabil că l-ați denumit forest_inventory.qgs.
În primul rând, adăugați măsurătorile din suprafețele de probă în proiectul dvs. QGIS:
Mergeți la Layer ‣ Add Delimited Text Layer....
Navigați la fișierul systematic_inventory_results.csv localizat în exercise_data\forestry\results\.
Asigurați-vă că este selectată opțiunea Point coordinates.
Setați câmpurile pentru coordonatele din câmpurile X and Y.
Clic pe OK
Când vi se solicită, selectați ca și CRS ETRS89 / ETRS-TM35FIN.
Deschideți noul Tabel de Atribute și aruncați o privire datelor.
You can read the type of data that is contained in the sample plots measurements in the text file legend_2012_inventorydata.txt located in the exercise_data\forestry\results\ folder.
The systematic_inventory_results layer you just added is actually just a virtual representation of the text information in the .csv file. Before you continue, convert the inventory results to a real shapefile:
Clic dreapta pe stratul systematic_inventory_results.
Navigați la folderul exercise_data\forestry\results\.
Denumiți fișierul sample_plots_results.shp.
Bifați caseta Add saved file to map.
Eliminați stratul systematic_inventory_results din proiectul dvs.
14.7.2. Follow Along: Parametrii de Evaluare a Întregii Păduri
You can calculate the averages for this whole forest area from the inventory results for the some interesting parameters, like the volume and the number of stems per hectare. Since the systematic sample plots represent equal areas, you can directly calculate the averages of the volumes and number of stems per hectare from the sample_plots_results layer.
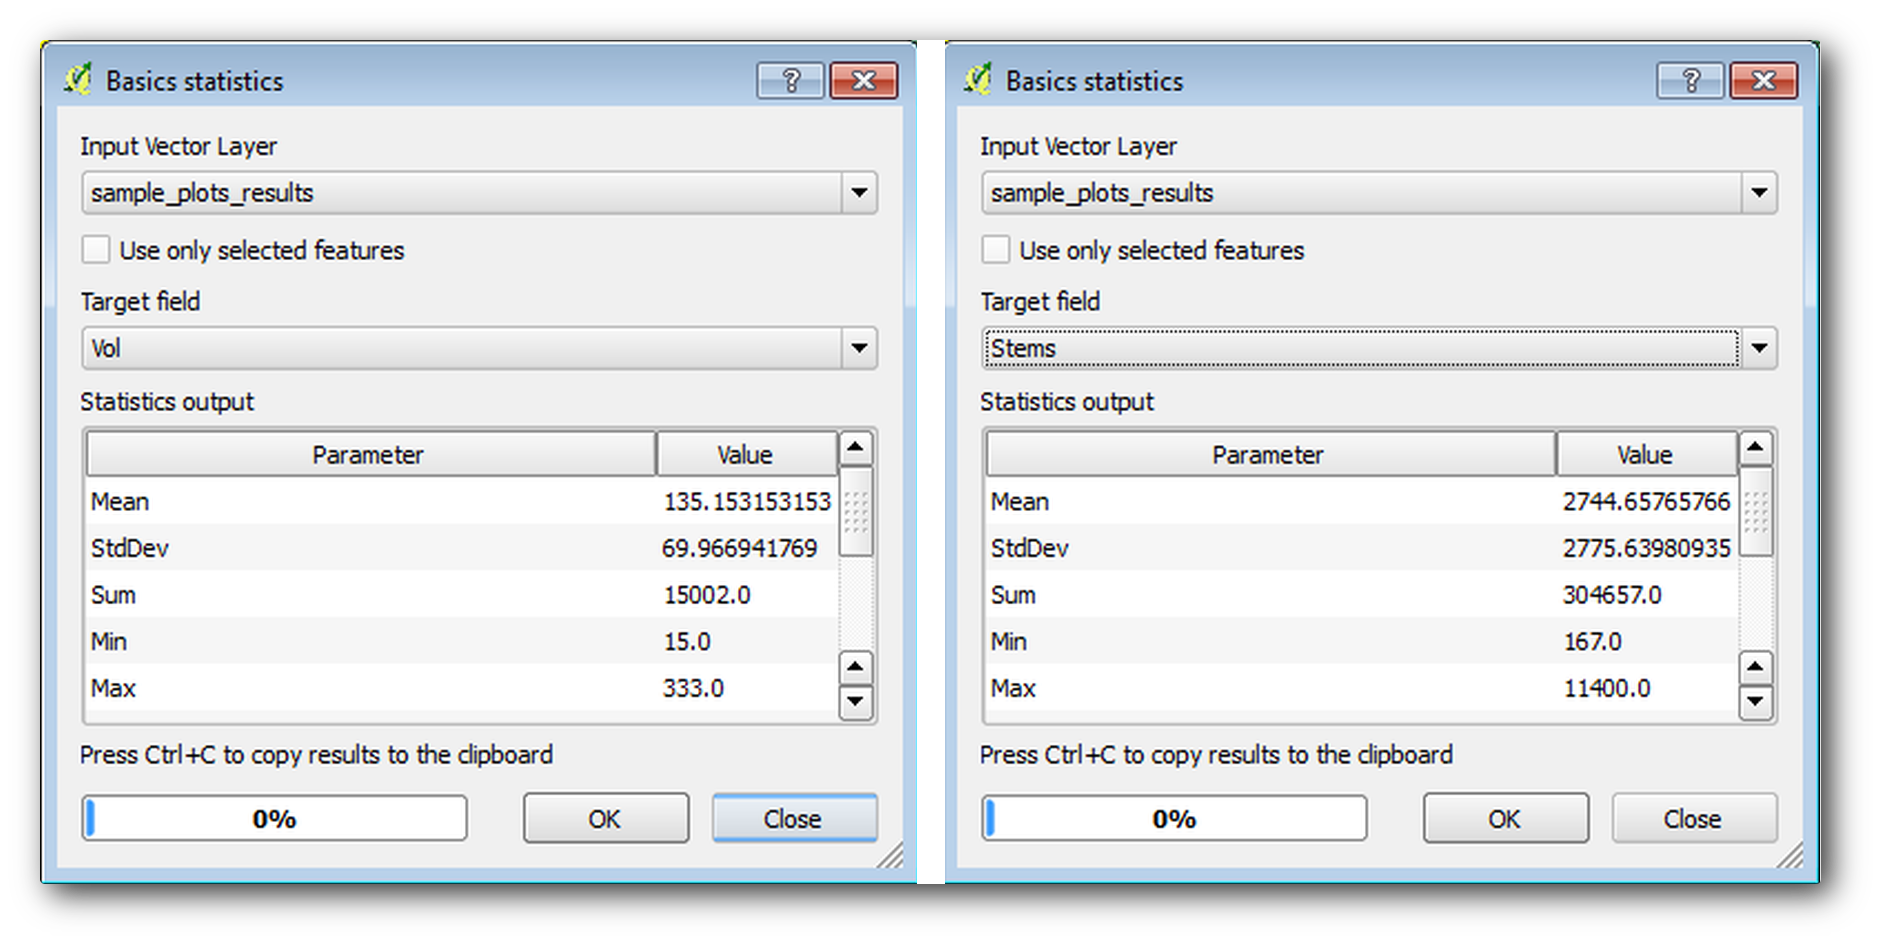
Puteți calcula media unui câmp dintr-un strat vectorial, folosind instrumentul Basic statistics:
Deschideți Vector ‣ Analysis Tools ‣ Basic statistics.
Selectați sample_plots_results ca Strat Vectorial de Intrare.
Selectați Vol ca și Câmp Destinație.
Clic pe OK
Volumul mediu din pădure este 135.2 m3/ha.
În același mod, puteți calcula media pentru numărul de tulpini, 2745 stems/ha.
14.7.3. Follow Along: Estimarea Parametrilor Zonali
You can make use of those same systematic sample plots to calculate estimates for the different forest stands you digitized previously. Some of the forest stands did not get any sample plot and for those you will not get information. You could have planned some extra sample plots when you planned the systematic inventory, so that the field teams would have measured a few extra sample plots for this purpose. Or you could send a field team later to get estimates of the missing forest stands to complete the stand inventory. Nevertheless, you will get information for a good number of stands just using the planned plots.
What you need is to get the averages of the sample plots that are falling within each of the forest stands. When you want to combine information based on their relative locations, you perform a spatial join:
Deschideți instrumentul Vector ‣ Data Management ‣ Join attributes by location.
Setați forest_stands_2012 ca și Strat Vectorial de Destinație. Stratul pentru care doriți rezultatele.
Setați sample_plots_results ca și Strat Vectorial de Îmbinare. Stratul din care vreți să calculați estimările.
Bifați Take summary of intersecting features.
Bifați pentru a calcula doar Media.
Denumiți rezultatul ca forest_stands_2012_results.shp, iar apoi salvați-l în folderul exercise_data\forestry\results\.
La final, selectați Keep all records..., astfel încât să puteți verifica mai târziu care locație nu a primit informații.
Clic pe OK
Acceptați adăugarea noului strat la proiectul dvs. când vi se solicită.
Închideți instrumentul de Îmbinare a atributelor după locație.
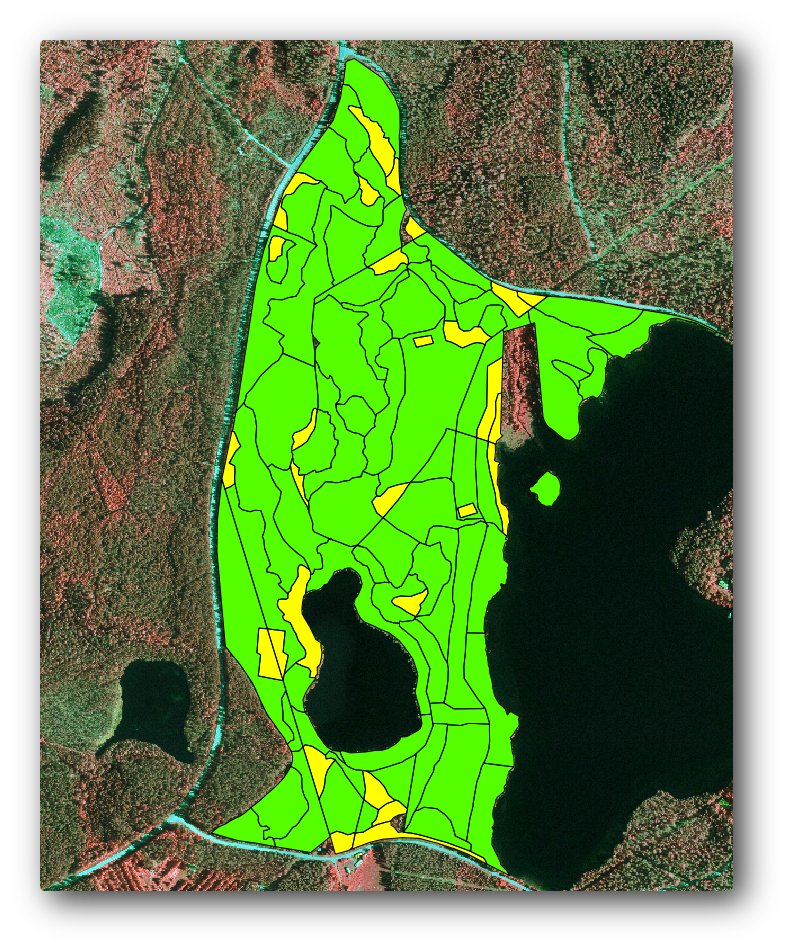
Open the Attribute table for forest_stands_2012_results and review the results you got. Note that a number of forest stands have NULL as the value for the calculations, those are the ones having no sample plots. Select them all review them in the map, they are some of the smaller stands:
Lets calculate now the same averages for the whole forest as you did before, only this time you will use the averages you got for the stands as the bases for the calculation. Remember that in the previous situation, each sample plot represented a theoretical stand of 80x80 m. Now you have to consider the area of each of the stands individually instead. That way, again, the average values of the parameters that are in, for example, m3/ha for the volumes are converted to total volumes for the stands.
Trebuie să calculați mai întâi ariile pentru locații, iar apoi volumele totale și numărul de tulpini pentru fiecare dintre acestea:
Activați editarea în Tabela de Atribute.
Deschideți Calculatorul de câmpuri.
Creați un nou câmp denumit area.
Lăsați Output field type pe Decimal number (real).
Setați Precizia la 2.
În caseta Expression scrieți $area / 10000. Aceasta va calcula zona pâlcului în ha.
Clic pe OK
Acum calculați un câmp cu volumele totale și numărul estimat de tulpini, pentru fiecare element:
Denumiți câmpurile s_vol and s_stem.
Valorile numerice din câmpurile pot fi de tip întreg sau chiar și de tip real.
Utilizați expresiile "area" * "MEANVol" și "area" * "MEANStems" pentru volumurile totale și, respectiv, totalul tulpinilor.
Închideți editările, după ce ați încheiat.
Dezactivați editarea.
In the previous situation, the areas represented by every sample plot were the same, so it was enough to calculate the average of the sample plots. Now to calculate the estimates, you need to divide the sum of the stands volumes or number of stems by the sum of the areas of the stands containing information.
În Tabela de Atribute pentru stratul forest_stands_2012_results, selectați toate pâlcurile care conțin informații.
Deschideți Vector ‣ Analysis Tools ‣ Basic statistics.
Selectați forest_stands_2012_results ca și Strat Vectorial de Intrare.
Selectați aria ca și Câmp Destinație.
Bifați Use only selected features
Clic pe OK
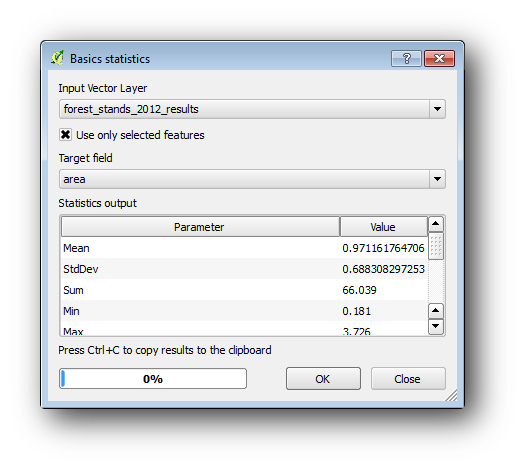
As you can see, the total sum of the stands’ areas is 66.04 ha. Note that the area of the missing forest stands is only about 7 ha.
In the same way, you can calculate that the total volume for these stands is 8908 m3/ha and the total number of stems is 179594 stems.
Folosind informațiile din pâlcurile forestiere, în locul folosirii directe a celor din parcelele eșantion, rezultă următoarele estimări medii:
184.9 m3/ha și
- 2719 stems/ha.
Salvați proiectul dumneavoastră QGIS ca și forest_inventory.qgs
14.7.4. In Conclusion
You managed to calculate forest estimates for the whole forest using the information from your systematic sample plots, first without considering the forest characteristics and also using the interpretation of the aerial image into forest stands. And you also got some valuable information about the particular stands, which could be used to plan the management of the forest in the coming years.
14.7.5. What’s Next?
In the following lesson, you will first create a hillshade background from a LiDAR dataset which you will use to prepare a map presentation with the forest results you just calculated.