` `
QGIS GUI
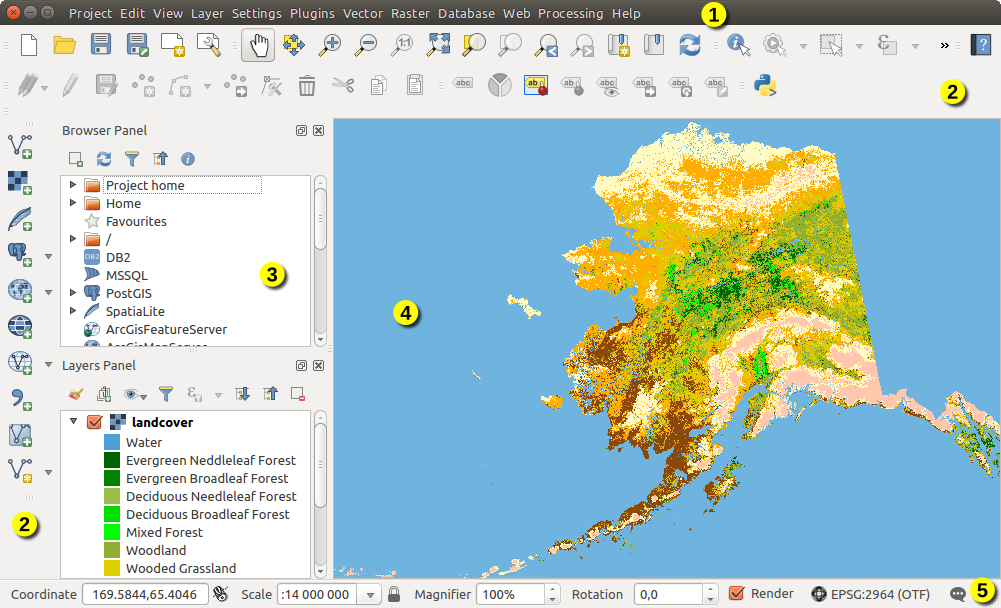
When QGIS starts, you are presented with the GUI as shown in the figure (the numbers 1 through 5 in yellow circles are discussed below).

QGIS GUI with Alaska sample data
Not
Pencere düzeni (başlık çubuğu, vb) işletim sistemine ve pencere yönetimine göre farklı görünebilir.
The QGIS GUI is divided into five components:
- Menu Bar
- Toolbars
- Panels
- Map View
- Status Bar
These five components of the QGIS interface are described in more detail in the following sections. Two more sections present keyboard shortcuts and context help.
Panels and Toolbars
From the View menu (or  Settings), you can
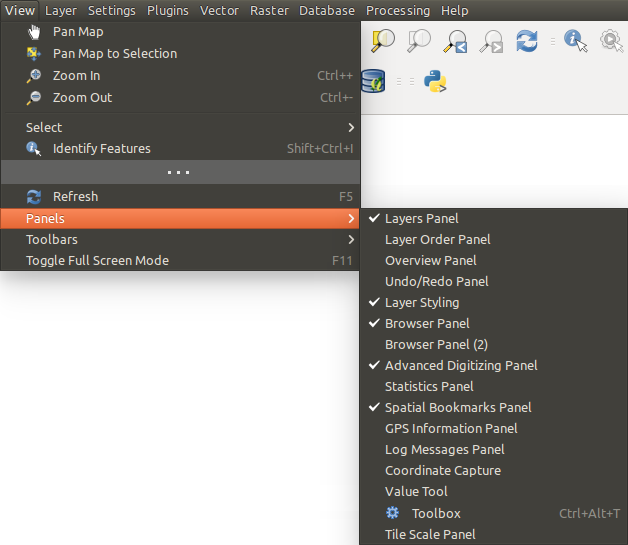
switch on and off QGIS widgets (Panels ‣) or toolbars
(Toolbars ‣). You can (de)activate any of them by
right-clicking the menu bar or a toolbar and choose the item you want.
Each panel or toolbar can be moved and placed wherever you feel comfortable
within QGIS interface.
The list can also be extended with the activation of Core or external
plugins.
Toolbars
The toolbar provides access to most of the same functions as the menus, plus additional tools for interacting with the map. Each toolbar item has pop-up help available. Hold your mouse over the item and a short description of the tool’s purpose will be displayed.
Every toolbar can be moved around according to your needs. Additionally, they can be switched off using the right mouse button context menu, or by holding the mouse over the toolbars.

The Toolbars menu
Tüyo
Restoring toolbars
If you have accidentally hidden a toolbar, you can get it
back by choosing menu option View ‣ Toolbars ‣
(or  Settings ‣ Toolbars ‣).
If for some reason a toolbar (or any other widget) totally disappears
from the interface, you’ll find tips to get it back at restoring
initial GUI.
Panels
Besides toolbars, QGIS provides by default many panels to work with. Panels are special widgets that you can interact with (selecting options, checking boxes, filling values...) in order to perform a more complex task.

The Panels menu
Below are listed default panels provided by QGIS:
- the Layers Panel
- the Browser Panel
- the Advanced Digitizing Panel
- the Spatial Bookmarks Panel
- the GPS Information Panel
- the Tile Scale Panel
- the Identify Panel
- the User Input Panel
- the Layer Order Panel
- the Layer Styling Panel
- the Statistical Summary Panel
- the QGIS Overview Panel
- the Log Messages Panel
- the Undo/Redo Panel
- the Processing Toolbox
Map View
Also called Map canvas, this is the “business end” of QGIS — maps are displayed in this area. The map displayed in this window will depend on the vector and raster layers you have chosen to load.
When you add a layer (see e.g. Opening Data), QGIS automatically looks for its Coordinate Reference System (CRS) and zooms to its extent if you work in a blank QGIS project. The layer’s CRS is then applied to the project. If there are already layers in the project, and in the case the new layer has the same CRS as the project, its features falling in the current map canvas extent will be visualized. If the new layer is in a different CRS from the project’s, you must Enable on-the-fly CRS transformation from the Project ‣ Project Properties ‣ CRS (see Define On The Fly (OTF) CRS Transformation). The added layer should now be visible if data are available in the current view extent.
The map view can be panned, shifting the focus of the map display to another region, and it can be zoomed in and out. Various other operations can be performed on the map as described in the Toolbars description. The map view and the legend are tightly bound to each other — the maps in view reflect changes you make in the legend area.
Tüyo
Zooming the Map with the Mouse Wheel
You can use the mouse wheel to zoom in and out on the map. Place the mouse cursor inside the map area and roll the wheel forward (away from you) to zoom in and backwards (towards you) to zoom out. The zoom is centered on the mouse cursor position. You can customize the behavior of the mouse wheel zoom using the Map tools tab under the Settings ‣ Options menu.
Tüyo
Panning the Map with the Arrow Keys and Space Bar
You can use the arrow keys to pan the map. Place the mouse cursor inside the map area and click on the right arrow key to pan east, left arrow key to pan west, up arrow key to pan north and down arrow key to pan south. You can also pan the map using the space bar or the click on mouse wheel: just move the mouse while holding down space bar or click on mouse wheel.
Status Bar
The status bar provides you with general information about the map view, and actions processed or available and offers you tools to manage the map view.
On the left side of the status bar, you can get a summary of actions you’ve done (such as selecting features in a layer, removing layer) or a long description of the tool you are hovering over (not available for all tools). On startup, the bar status also informs you about availability of new or upgradeable plugins (if checked in Plugin Manager settings).
In case of lengthy operations, such as gathering of statistics in raster layers or rendering several layers in map view, a progress bar is displayed in the status bar to show the current progress of the action.
The ![]() Coordinate option shows the current position of the mouse,
following it while moving across the map view. You can set the unit (and precision)
to use in the project properties, General tab.
Click on the small button at the left of the textbox to toggle between
the Coordinate option and the
Coordinate option shows the current position of the mouse,
following it while moving across the map view. You can set the unit (and precision)
to use in the project properties, General tab.
Click on the small button at the left of the textbox to toggle between
the Coordinate option and the  Extents option that displays
in map units, the coordinates of the current lower leftmost and upper rightmost
points of the map view, as you pan and zoom in and out.
Next to the coordinate display you will find the Scale display. It shows the scale of the map view. If you zoom in or out, QGIS shows you the current scale. There is a scale selector, which allows you to choose among predefined and custom scales to assign to the map view.
On the right side of the scale display you can define a current magnification level for your map view. This allows to zoom in to a map without altering the map scale, making it easier to accurately tweak the positions of labels and symbols. The magnification level is expressed as a percentage. If the Magnifier has a level of 100%, then the current map is not magnified. Additionally, a default magnification value can be defined within Settings ‣ Options ‣ Rendering ‣ Rendering behaviour, which is very useful for high resolution screen to avoid too small symbols.
To the right of the magnifier tool you can define a current clockwise rotation for your map view in degrees.
On the right side of the status bar, there is a small checkbox which can be used to temporarily prevent layers being rendered to the map view (see section Rendering).
To the right of the render functions, you find the ![]() Current CRS: icon with the EPSG code of the current
project CRS. Clicking on this lets you Enable ‘on the fly’ CRS
transformation properties for the current project and apply another CRS to the
map view.
Current CRS: icon with the EPSG code of the current
project CRS. Clicking on this lets you Enable ‘on the fly’ CRS
transformation properties for the current project and apply another CRS to the
map view.
Finally, the  Messages button opens the Log
Messages Panel which informs you on underlying process (QGIS startup, plugins
loading, processing tools...)
Tüyo
Calculating the Correct Scale of Your Map Canvas
When you start QGIS, the default CRS is WGS 84 (epsg 4326) and
units are degrees. This means that QGIS will interpret any
coordinate in your layer as specified in degrees. To get correct scale values,
you can either manually change this setting, e.g. to meters, in the General
tab under Project ‣ Project Properties, or you can use
the ![]() Current CRS: icon seen above. In the latter case,
the units are set to what the project projection specifies (e.g., +units=us-ft).
Current CRS: icon seen above. In the latter case,
the units are set to what the project projection specifies (e.g., +units=us-ft).
Note that CRS choice on startup can be set in Settings ‣ Options ‣ CRS.


 Exit QGIS


