QGIS GUI
When QGIS starts, you are presented with the GUI as shown in the figure (the numbers 1 through 5 in yellow circles are discussed below).
Figure QGIS GUI 1:
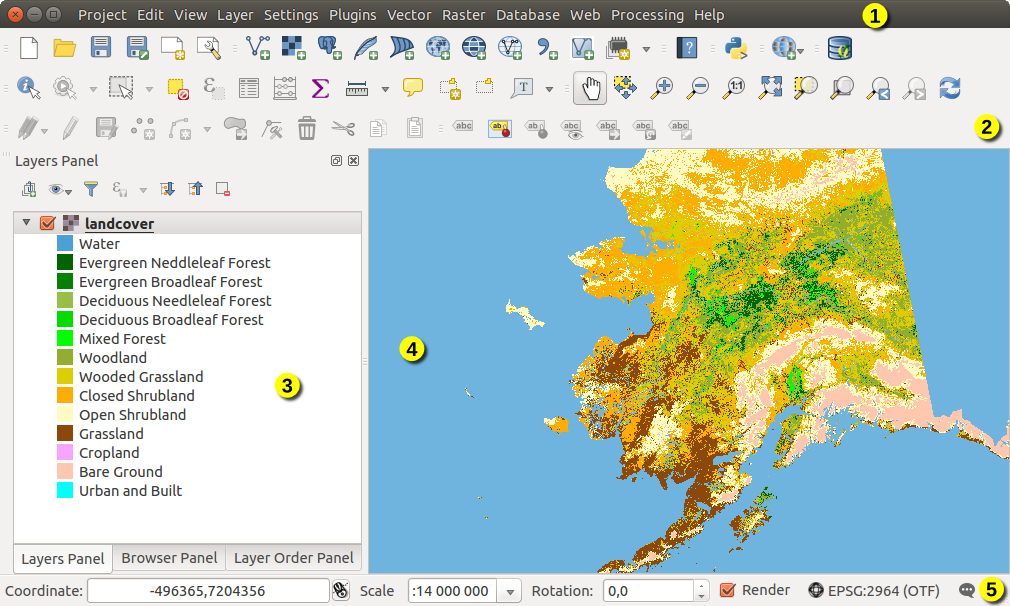
QGIS GUI with Alaska sample data
Note
Your window decorations (title bar, etc.) may appear different depending on your operating system and window manager.
The QGIS GUI is divided into five areas:
- Menu Bar
- Toolbars
- Panels
- Map View
- Status Bar
These five components of the QGIS interface are described in more detail in the following sections. Two more sections present keyboard shortcuts and context help.
Menu Bar
The menu bar provides access to various QGIS features using a standard hierarchical menu. The top-level menus and a summary of some of the menu options are listed below, together with the associated icons as they appear on the toolbar, and keyboard shortcuts. The shortcuts presented in this section are the defaults; however, keyboard shortcuts can also be configured manually using the Configure shortcuts dialog, opened from Settings ‣ Configure Shortcuts....
Although most menu options have a corresponding tool and vice-versa, the menus are not organized exactly like the toolbars. The toolbar containing the tool is listed after each menu option as a checkbox entry. Some menu options only appear if the corresponding plugin is loaded. For more information about tools and toolbars, see section Toolbars.
Note
QGIS is a cross-platform application meaning that though it provides you with the same tools, they may be placed in different menus according to the operating system specification. The lists below show the most common location and precise when there is a variation.
Project
| Menu Option | Shortcut | Reference | Toolbar |
|---|---|---|---|
 New New |
Ctrl+N | see परियोजनाएं | Project |
 Open Open |
Ctrl+O | see परियोजनाएं | Project |
| New from template ‣ | see परियोजनाएं | ||
| Open Recent ‣ | see परियोजनाएं | ||
 Save Save |
Ctrl+S | see परियोजनाएं | Project |
 Save As... Save As... |
Ctrl+Shift+S | see परियोजनाएं | Project |
 Save as Image... Save as Image... |
see उपज | ||
| DXF Export... | see उपज | ||
 Project Properties... Project Properties... |
Ctrl+Shift+P | see परियोजनाएं | |
 New Print Composer New Print Composer |
Ctrl+P | see Print Composer | Project |
 Composer manager... Composer manager... |
see Print Composer | Project | |
| Print Composers ‣ | see Print Composer | ||
 Exit QGIS Exit QGIS |
Ctrl+Q |
Under  Mac OSX, the Exit QGIS command corresponds to
QGIS ‣ Quit QGIS (Cmd+Q).
Mac OSX, the Exit QGIS command corresponds to
QGIS ‣ Quit QGIS (Cmd+Q).
Edit
| Menu Option | Shortcut | Reference | Toolbar |
|---|---|---|---|
 Undo Undo |
Ctrl+Z | see Advanced digitizing | Advanced Digitizing |
 Redo Redo |
Ctrl+Shift+Z | see Advanced digitizing | Advanced Digitizing |
 Cut Features Cut Features |
Ctrl+X | see Digitizing an existing layer | Digitizing |
 Copy Features Copy Features |
Ctrl+C | see Digitizing an existing layer | Digitizing |
 Paste Features Paste Features |
Ctrl+V | see Digitizing an existing layer | Digitizing |
| Paste features as ‣ | see Working with the Attribute Table | ||
 Add Feature Add Feature |
Ctrl+. | see Digitizing an existing layer | Digitizing |
 Move Feature(s) Move Feature(s) |
see Digitizing an existing layer | Digitizing | |
 Delete Selected Delete Selected |
see Digitizing an existing layer | Digitizing | |
 Rotate Feature(s) Rotate Feature(s) |
see Advanced digitizing | Advanced Digitizing | |
 Simplify Feature Simplify Feature |
see Advanced digitizing | Advanced Digitizing | |
 Add Ring Add Ring |
see Advanced digitizing | Advanced Digitizing | |
 Add Part Add Part |
see Advanced digitizing | Advanced Digitizing | |
 Fill Ring Fill Ring |
see Advanced digitizing | Advanced Digitizing | |
 Delete Ring Delete Ring |
see Advanced digitizing | Advanced Digitizing | |
 Delete Part Delete Part |
see Advanced digitizing | Advanced Digitizing | |
 Reshape Features Reshape Features |
see Advanced digitizing | Advanced Digitizing | |
 Offset Curve Offset Curve |
see Advanced digitizing | Advanced Digitizing | |
 Split Features Split Features |
see Advanced digitizing | Advanced Digitizing | |
 Split Parts Split Parts |
see Advanced digitizing | Advanced Digitizing | |
 Merge Selected Features Merge Selected Features |
see Advanced digitizing | Advanced Digitizing | |
 Merge Attr. of Selected Features Merge Attr. of Selected Features |
see Advanced digitizing | Advanced Digitizing | |
 Node Tool Node Tool |
see Digitizing an existing layer | Digitizing | |
 Rotate Point Symbols Rotate Point Symbols |
see Advanced digitizing | Advanced Digitizing |
After activating  Toggle editing mode for a layer,
you will enable the Add Feature icon in the Edit menu
depending on the layer type (point, line or polygon).
Toggle editing mode for a layer,
you will enable the Add Feature icon in the Edit menu
depending on the layer type (point, line or polygon).
Edit (extra)
| Menu Option | Shortcut | Reference | Toolbar |
|---|---|---|---|
| Add Feature |
see Digitizing an existing layer | Digitizing | |
 Add Feature Add Feature |
see Digitizing an existing layer | Digitizing | |
 Add Feature Add Feature |
see Digitizing an existing layer | Digitizing |
View
| Menu Option | Shortcut | Reference | Toolbar |
|---|---|---|---|
 Pan Map Pan Map |
see Zooming and Panning | Map Navigation | |
 Pan Map to Selection Pan Map to Selection |
Map Navigation | ||
 Zoom In Zoom In |
Ctrl++ | see Zooming and Panning | Map Navigation |
 Zoom Out Zoom Out |
Ctrl+- | see Zooming and Panning | Map Navigation |
| Select ‣ | see Select and deselect features | Attributes | |
 Identify Features Identify Features |
Ctrl+Shift+I | see Identify features | Attributes |
| Measure ‣ | see Measuring | Attributes | |
 Statistical Summary Statistical Summary |
see Statistical Summary Panel | Attributes | |
 Zoom Full Zoom Full |
Ctrl+Shift+F | Map Navigation | |
 Zoom To Layer Zoom To Layer |
Map Navigation | ||
 Zoom To Selection Zoom To Selection |
Ctrl+J | Map Navigation | |
 Zoom Last Zoom Last |
Map Navigation | ||
 Zoom Next Zoom Next |
Map Navigation | ||
 Zoom To Native Resolution Zoom To Native Resolution |
Map Navigation | ||
| Decorations ‣ | see Decorations | ||
| Preview mode ‣ | |||
 Map Tips Map Tips |
see Display Menu | Attributes | |
 New Bookmark... New Bookmark... |
Ctrl+B | see Spatial Bookmarks | Attributes |
 Show Bookmarks Show Bookmarks |
Ctrl+Shift+B | see Spatial Bookmarks | Attributes |
 Refresh Refresh |
F5 | Map Navigation | |
| Panels ‣ | see Panels and Toolbars | ||
| Toolbars ‣ | see Panels and Toolbars | ||
| Toggle Full Screen Mode | F11 |
Under  Linux KDE, Panels ‣, Toolbars ‣
and Toggle Full Screen Mode are rather placed in Settings
menu.
Preview mode ‣ is not available under Mac OS X.
Linux KDE, Panels ‣, Toolbars ‣
and Toggle Full Screen Mode are rather placed in Settings
menu.
Preview mode ‣ is not available under Mac OS X.
Layer
| Menu Option | Shortcut | Reference | Toolbar |
|---|---|---|---|
| Create Layer ‣ | see Creating new Vector layers | Manage Layers | |
| Add Layer ‣ | see Supported Data Formats | Manage Layers | |
| Embed Layers and Groups... | see Nesting Projects | ||
| Add from Layer Definition File... | |||
| Copy style |
see Save and Share Layer Properties | ||
| Paste style |
see Save and Share Layer Properties | ||
 Open Attribute Table Open Attribute Table |
see Working with the Attribute Table | Attributes | |
| Toggle Editing |
see Digitizing an existing layer | Digitizing | |
| Save Layer Edits |
see Digitizing an existing layer | Digitizing | |
 Current Edits ‣ Current Edits ‣ |
see Digitizing an existing layer | Digitizing | |
| Save As... | see Save layer into file | ||
| Save As Layer Definition File... | |||
 Remove Layer/Group Remove Layer/Group |
Ctrl+D | ||
 Duplicate Layers (s) Duplicate Layers (s) |
|||
| Set Scale Visibility of Layers | |||
| Set CRS of Layer(s) | Ctrl+Shift+C | ||
| Set project CRS from Layer | |||
| Properties... | see The Vector Properties Dialog | ||
| Filter... | see Query Builder | ||
 Labeling Labeling |
see Labels Menu | ||
 Add to Overview Add to Overview |
Ctrl+Shift+O | Manage Layers | |
 Add All To Overview Add All To Overview |
|||
 Remove All From Overview Remove All From Overview |
|||
 Show All Layers Show All Layers |
Ctrl+Shift+U | Manage Layers | |
 Hide All Layers Hide All Layers |
Ctrl+Shift+H | Manage Layers | |
| Show selected Layers |
|||
| Hide selected Layers |
Settings
| Menu Option | Shortcut | Reference | Toolbar |
|---|---|---|---|
 Custom CRS... Custom CRS... |
see Custom Coordinate Reference System | ||
| Style Manager... | see The Style Manager | ||
 Configure shortcuts... Configure shortcuts... |
|||
| Customization... |
see Customization | ||
| Options... |
see Options | ||
| Snapping Options... | see Setting the Snapping Tolerance and Search Radius |
Under Linux KDE, you’ll find more tools in Settings
menu such as Project Properties, Panels ‣,
Toolbars ‣ and Toggle Full Screen Mode.
Plugins
| Menu Option | Shortcut | Reference | Toolbar |
|---|---|---|---|
 Manage and Install Plugins... Manage and Install Plugins... |
see The Plugins Dialog | ||
| Python Console | Ctrl+Alt+P |
When starting QGIS for the first time not all core plugins are loaded.
Vector
| Menu Option | Shortcut | Reference | Toolbar |
|---|---|---|---|
| Open Street Map ‣ | see Loading OpenStreetMap Vectors | ||
 Analysis Tools ‣ Analysis Tools ‣ |
see fTools Plugin | ||
 Research Tools ‣ Research Tools ‣ |
see fTools Plugin | ||
 Geoprocessing Tools ‣ Geoprocessing Tools ‣ |
see fTools Plugin | ||
 Geometry Tools ‣ Geometry Tools ‣ |
see fTools Plugin | ||
 Data Management Tools ‣ Data Management Tools ‣ |
see fTools Plugin |
When starting QGIS for the first time not all core plugins are loaded.
Raster
| Menu Option | Shortcut | Reference | Toolbar |
|---|---|---|---|
| Raster calculator... | see Raster Calculator | ||
| Align Raster... | see Raster Alignment |
When starting QGIS for the first time not all core plugins are loaded.
Database
| Menu Option | Shortcut | Reference | Toolbar |
|---|---|---|---|
| Database ‣ | see DB Manager Plugin | Database |
When starting QGIS for the first time not all core plugins are loaded.
Web
| Menu Option | Shortcut | Reference | Toolbar |
|---|---|---|---|
| Metasearch | see MetaSearch Catalogue Client | Web |
When starting QGIS for the first time not all core plugins are loaded.
Processing
| Menu Option | Shortcut | Reference | Toolbar |
|---|---|---|---|
 Toolbox Toolbox |
see The toolbox | ||
 Graphical Modeler... Graphical Modeler... |
see The graphical modeler | ||
 History and log... History and log... |
see The history manager | ||
 Options... Options... |
see Configuring the processing framework | ||
 Results viewer... Results viewer... |
see Configuring external applications | ||
 Commander Commander |
Ctrl+Alt+M | see The QGIS Commander |
When starting QGIS for the first time not all core plugins are loaded.
Help
| Menu Option | Shortcut | Reference | Toolbar |
|---|---|---|---|
 Help Contents Help Contents |
F1 | Help | |
 What’s This? What’s This? |
Shift+F1 | Help | |
| API Documentation | |||
| Report an Issue | |||
| Need commercial support? | |||
 QGIS Home Page QGIS Home Page |
Ctrl+H | ||
 Check QGIS Version Check QGIS Version |
|||
 About About |
|||
 QGIS Sponsors QGIS Sponsors |
QGIS
This menu is only available under Mac OS X and contains some OS related
commands.
| Menu Option | Shortcut | Reference |
|---|---|---|
| Preferences | ||
| About QGIS | ||
| Hide QGIS | ||
| Show All | ||
| Hide Others | ||
| Quit QGIS | Cmd+Q |
Preferences and About QGIS are the same commands as Settings ‣ Options and Help ‣ About. Quit QGIS corresponds to Project ‣ Exit QGIS under the other platforms.
Panels and Toolbars
From the View menu (Settings under KDE), you can switch on and off QGIS widgets (Panels ‣) or toolbars (Toolbars ‣). You can (de)activate any of them by right-clicking the menu bar or a toolbar and choose the item you want. Each panel or toolbar can be moved and placed wherever you feel comfortable with in QGIS interface. The list can also be extended with the activation of Core or external plugins.
Toolbars
The toolbar provides access to most of the same functions as the menus, plus additional tools for interacting with the map. Each toolbar item has pop-up help available. Hold your mouse over the item and a short description of the tool’s purpose will be displayed.
Every toolbar can be moved around according to your needs. Additionally, they can be switched off using the right mouse button context menu, or by holding the mouse over the toolbars.
Figure Toolbars:
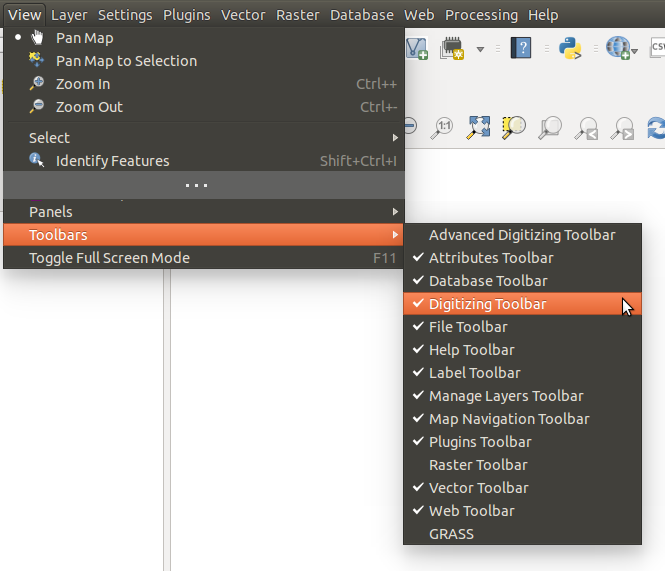
The Toolbars menu
Tip
Restoring toolbars
If you have accidentally hidden a toolbar, you can get it back by choosing menu option View ‣ Toolbars ‣ (or Settings ‣ Toolbars ‣ under Linux KDE). If for some reason a toolbar (or any other widget) totally disappears from the interface, you’ll find tips to get it back at restoring initial GUI.
Panels
QGIS provides by default many panels to work with.
Figure Panels:
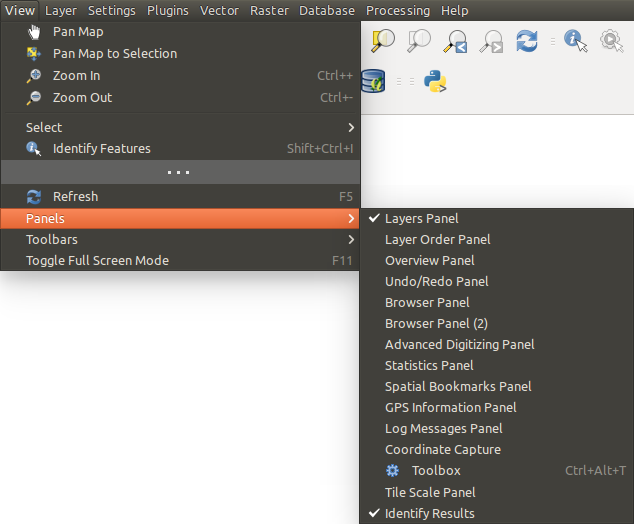
The Panels menu
Some of these panels are described below while others may be found in different parts of the document, namely:
- the Browser Panel
- the Advanced Digitizing Panel
- the Spatial Bookmarks Panel
- the GPS Information Panel
- the Tile Scale Panel
- the Identify Panel
- the User Input Panel
Layers Panel
The layers panel lists all the layers in the project. The checkbox in each legend entry can be used to show or hide the layer. The toolbar in the layers panel allows you to:
 Add new group
 Manage Visibility: control visibility of layers and
preset layers combination
Manage Visibility: control visibility of layers and
preset layers combination Filter Legend by Map Content: only the layers that are set
visible and whose features intersect the current map canvas have their style
rendered in the layers panel. Otherwise, a generic NULL symbol is applied to the
layer. Based on the layer symbology, this is a convenient way to identify which
kind of features from which layers cover your area of interest.
Filter Legend by Map Content: only the layers that are set
visible and whose features intersect the current map canvas have their style
rendered in the layers panel. Otherwise, a generic NULL symbol is applied to the
layer. Based on the layer symbology, this is a convenient way to identify which
kind of features from which layers cover your area of interest. Filter Legend by Expression: helps you apply an
expression to remove from the selected layer tree styles that have no feature
satisfying the condition. This can be used for example to highlight features that are
within a given area/feature of another layer.
From the drop-down list, you can edit and clear the expression set.
Filter Legend by Expression: helps you apply an
expression to remove from the selected layer tree styles that have no feature
satisfying the condition. This can be used for example to highlight features that are
within a given area/feature of another layer.
From the drop-down list, you can edit and clear the expression set. Expand All or
  Collapse All
layers and groups in the layers panel.
Collapse All
layers and groups in the layers panel.- and Remove Layer/Group currently selected.
Figure Layer tools Bar:
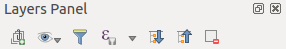
Layer Toolbar in Layers Panel
The button allows you to add Presets views in the legend.
Presets are a way to save and easily restore a combination of layers with their
current style. To add a preset view, just set visible the layers you want, with
their desired symbology, and click on button.
Choose Add Preset... from the drop-down menu and give a name to the preset.
The added preset is listed at the bottom of the drop-down menu and is recalled by
clicking on it.
The Replace Preset ‣ option helps you overwrite a preset content with the current map view while the Remove Current Preset button deletes the active preset.
All the added presets are also present in the map composer in order to allow you to create a map layout based on your specific views (see Main properties).
Note
Tools to manage the layers panel are also available to layout the map and legend items of the print composer
A layer can be selected and dragged up or down in the legend to change the Z-ordering. Z-ordering means that layers listed nearer the top of the legend are drawn over layers listed lower down in the legend.
Note
This behavior can be overridden by the Layer Order panel.
Layers in the legend window can be organized into groups. There are two ways to do this:
- Press the
 icon to add a new group. Type in a name for
the group and press Enter. Now click on an existing layer and
drag it onto the group.
icon to add a new group. Type in a name for
the group and press Enter. Now click on an existing layer and
drag it onto the group. - Select some layers, right click in the legend window and choose Group Selected. The selected layers will automatically be placed in a new group.
To bring a layer out of a group, you can drag it out, or right click on it and choose Make to toplevel item. Groups can also be nested inside other groups.
The checkbox for a group will show or hide all the layers in the group with one click.
The content of the right mouse button context menu depends on whether the
selected legend item is a raster or a vector layer. For GRASS vector layers,
Toggle editing is not available. See section
Digitizing and editing a GRASS vector layer for information on editing GRASS vector layers.
Below are listed available options in context menu depending on the selected item.
| Option | Vector Layer | Raster Layer | Group |
|---|---|---|---|
| Zoom to Layer/Group |
 |
|
|
 Show in Overview Show in Overview |
|
|
|
| Zoom to Native Resolution (100%) |
|
||
| Stretch Using Current Extent | |
||
| Remove |
|
|
|
| Duplicate |
|
|
|
| Set Layer Scale Visibility | |
|
|
| Set Layer/Group CRS | |
|
|
| Set Project CRS from Layer | |
|
|
| Styles ‣ | |
|
|
| Copy Style | |
|
|
| Paste Style | |
|
|
| Open Attribute Table |
|
||
| Toggle Editing |
|
||
| Current Edits ‣ |
(in Edit mode) |
||
| Save As... | |
|
|
| Save As Layer Definition File... | |
|
|
| Filter | |
||
| Show Feature Count |
|
||
| Properties | |
|
|
| Move to Top-level | |
|
|
| Rename | |
|
|
| Group Selected | |
|
|
| Properties | |
|
|
| Set Group WMS Data | |
||
| Mutually Exclusive Group |
|
||
| Add Group |
|
Enabling the Mutually Exclusive Group option you can make a group have only one layer visible at the same time. Whenever a layer within the group is set visible the others will be toggled not visible.
It is possible to select more than one layer or group at the same time by holding down the Ctrl key while selecting the layers with the left mouse button. You can then move all selected layers to a new group at the same time.
You may also delete more than one layer or group at once by selecting several items with the Ctrl key and pressing Ctrl+D afterwards. This way, all selected layers or groups will be removed from the layers list.
Editing vector layer style
From the Layers panel, you have shortcuts to easily and quickly edit the layer rendering. Right-click on a vector layer and select Styles –> in the list in order to:
- see the currently applied styles to the layer. In case you defined many styles for the layer, you can switch from one to another and have your layer rendering automatically updated in the map canvas.
- copy the current style, and when applicable, paste a copied style from another layer
- rename the current style, add a new one (which is actually a copy of the current one) or delete the current style (when multiple styles available).
Note
The previous options are also available for raster layer.
Whether the features in the vector layer have all the same unique symbol or they are classified (in that case, the layer is displayed in a tree structure with each class as sub-item), the following options are available at layer level or class level:
- a Edit Symbol... button to open the The symbol Selector dialog and update any property (symbol, size, color...) of the layer or feature symbol. Double-clicking on a feature does also open the Symbol Selector dialog.
- a Color Selector widget with a Color Wheel from which you can click a color and have it automatically update the symbol fill color. For convenience, Recent colors are available at the bottom of the color wheel.
- a Show All Items and Hide All
Items to toggle on or off the visibility of all the classes of features. This avoids
(un)checking items one by one.
Tip
Quickly share a layer style
From the context menu, copy the style of a layer and paste it to a group or a selection of layers: the style is applied to all the layers that are of the same type (vector vs raster) as the original layer and, in case of vector, have the same geometry type (point, line or polygon).
Working with the Legend independent layer order
There is a panel that allows you to define an independent drawing order for
the layers panel. You can activate it in the menu
Settings ‣ Panels ‣ Layer Order Panel. This feature allows you
to, for instance, order your layers in order of importance, but still display
them in the correct order (see figure_layer_order). Checking the
Control rendering order box underneath the list of layers will
cause a revert to default behavior.
Figure Layer Order:
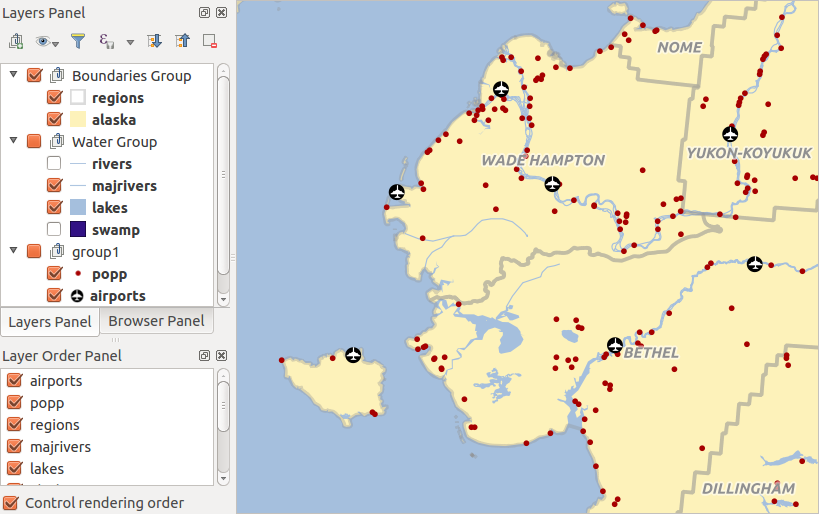
Define a legend independent layer order
Statistical Summary Panel
This panel can show some statistics on a specific vector layers. The panel allows users to choose:
- the vector layer;
- the column or the expression;
- filter statistics to selected features;
- refresh the informations;
- the statistics information to display with the bottom right button;
QGIS Overview Panel
In QGIS, you can use an overview panel that provides a full extent view of layers added to it. Within the view is a rectangle showing the current map extent. This allows you to quickly determine which area of the map you are currently viewing. Note that labels are not rendered to the map overview even if the layers in the map overview have been set up for labelling. If you click and drag the red rectangle in the overview that shows your current extent, the main map view will update accordingly.
Log Messages Panel
When loading or processing some operations, you can track and follow messages
that appear in different tabs using the  Log Messages Panel.
It can be activated using the most right icon in the bottom status bar.
Log Messages Panel.
It can be activated using the most right icon in the bottom status bar.
Undo/Redo Panel
For each layer being edited, this panel shows the list of actions done, allowing to quickly undo a set of actions by simply selecting the action listed above.
Map View
Also called Map canvas, this is the “business end” of QGIS — maps are displayed in this area. The map displayed in this window will depend on the vector and raster layers you have chosen to load (see sections that follow for more information on how to load layers). The map view can be panned, shifting the focus of the map display to another region, and it can be zoomed in and out. Various other operations can be performed on the map as described in the label_toolbars description above. The map view and the legend are tightly bound to each other — the maps in view reflect changes you make in the legend area.
Tip
Zooming the Map with the Mouse Wheel
You can use the mouse wheel to zoom in and out on the map. Place the mouse cursor inside the map area and roll the wheel forward (away from you) to zoom in and backwards (towards you) to zoom out. The zoom is centered on the mouse cursor position. You can customize the behavior of the mouse wheel zoom using the Map tools tab under the Settings ‣ Options menu.
Tip
Panning the Map with the Arrow Keys and Space Bar
You can use the arrow keys to pan the map. Place the mouse cursor inside the map area and click on the right arrow key to pan east, left arrow key to pan west, up arrow key to pan north and down arrow key to pan south. You can also pan the map using the space bar or the click on mouse wheel: just move the mouse while holding down space bar or click on mouse wheel.
Status Bar
The status bar provides you with general information about the map view, and actions processed or available and offers you tools to manage the map view.
On the left side of the status bar, you can get a summary of actions you’ve done (such as selecting features in a layer, removing layer) or a long description of the tool you are hovering over (not available for all tools). On startup, the bar status also informs you about availability of new or upgradeable plugins (if checked in Plugin Manager settings).
In case of lengthy operations, such as gathering of statistics in raster layers or rendering several layers in map view, a progress bar is displayed in the status bar to show the current progress of the action.
The ![]() Coordinate option shows the current position of the mouse,
following it while moving across the map view. You can set the unit (and precision)
to use in the project properties, General tab.
Click on the small button at the left of the textbox to toggle between
the Coordinate option and the
Coordinate option shows the current position of the mouse,
following it while moving across the map view. You can set the unit (and precision)
to use in the project properties, General tab.
Click on the small button at the left of the textbox to toggle between
the Coordinate option and the  Extents option that displays
in map units, the coordinates of the current lower leftmost and upper rightmost
points of the map view, as you pan and zoom in and out.
Extents option that displays
in map units, the coordinates of the current lower leftmost and upper rightmost
points of the map view, as you pan and zoom in and out.
Next to the coordinate display you will find the Scale display. It shows the scale of the map view. If you zoom in or out, QGIS shows you the current scale. There is a scale selector, which allows you to choose among predefined and custom scales to assign to the map view.
To the right of the scale display you can define a current clockwise rotation for your map view in degrees.
On the right side of the status bar, there is a small checkbox which can be used to temporarily prevent layers being rendered to the map view (see section Rendering).
To the right of the render functions, you find the  Current CRS: icon with the EPSG code of the current
project CRS. Clicking on this lets you Enable ‘on the fly’ CRS
transformation properties for the current project and apply another CRS to the
map view.
Current CRS: icon with the EPSG code of the current
project CRS. Clicking on this lets you Enable ‘on the fly’ CRS
transformation properties for the current project and apply another CRS to the
map view.
Finally, the Messages button opens the Log
Messages Panel which informs you on underlying process (QGIS startup, plugins
loading, processing tools...)
Tip
Calculating the Correct Scale of Your Map Canvas
When you start QGIS, the default CRS is WGS 84 (epsg 4326) and
units are degrees. This means that QGIS will interpret any
coordinate in your layer as specified in degrees. To get correct scale values,
you can either manually change this setting, e.g. to meters, in the General
tab under Project ‣ Project Properties, or you can use
the Current CRS: icon seen above. In the latter case,
the units are set to what the project projection specifies (e.g., +units=us-ft).
Note that CRS choice on startup can be set in Settings ‣ Options ‣ CRS.