Herramientas Generales
Identificar las características
Identify features allow to interact with map canvas to get data attribut on a
pop-up windows. To identify feature use View ‣ Identify features
or Ctrl+Shift+I, or click on the  Identify features icon
in the toolbar.
Identify features icon
in the toolbar.
If you click on several feature, this pop-up will list all data attributes of all features. The first item is the number of the item in the list of result followed by layer name. Then its first child will be the name of a field with its value. Finally all informations of the feature is displayed.
This window can be customized to display custom fields but by default it will display three kind of information:
- Actions: actions can be added to the identify feature windows. When clicking on the action label, action will be run. By default only one action is added to View feature form for editing.
- Derived: those informations are calculated or derived from other information. You can find clicked coordinate, X and Y coordinates, area in map unit and perimeter in map unit for polygon, length in map unit for line and feature id.
- Data attributes: this is the list of attribute fields from data.
Figure Identify 1:
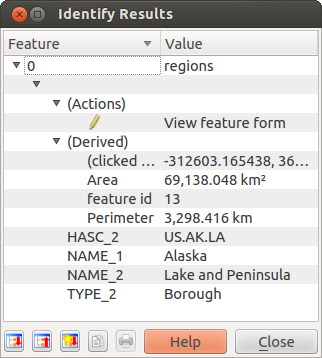
Identify feaures dialog  (Gnome)
At the bottom of the windows, you have five icons:
 Expand tree
 Collapse tree
 Default behaviour
 Copy attributes
 Print selected HTML response
More feature can be found in the menu display with a right click of the mouse somewhere in the response tree.
This menu allows to:
- View Feature form
- Zoom to feature
- Copy feature: copy all feature ie geometry and attributes;
- Copy attribute value: copy only the value of the attribut you click on;
- Copy feature attributes: copy only attributes;
- Clear result: result in the window are removed
- Clear highlights: features highlight on the map are removed
- Highlight all
- Highlight layer
- Layer properties: open layer properties window
- Expand all
- Collapse all
Teclas de acceso rápido
QGIS provides default keyboard shortcuts for many features. You find them in Section Menu Bar. Additionally the menu option Settings ‣ Configure Shortcuts allows to change the default keyboard shortcuts and to add new keyboard shortcuts to QGIS features.
Figure Shortcuts 1:

Define shortcut options (Gnome)
Configuration is very simple. Just select a feature from the list and click on [Change], [Set none] or [Set default]. Once you have found your configuration, you can save it as XML file and load it to another QGIS installation.
Ayuda de contexto
Cuando necesite ayuda en un tópico especifico, puede acceder a la ayuda de contexto utilizando el botón :guilabel:Help, el cual esta disponible en la mayoría de los diálogos - Algunas aplicaciones de terceros pueden llevarlo a paginas web específicas.
Renderizado
By default, QGIS renders all visible layers whenever the map canvas must be refreshed. The events that trigger a refresh of the map canvas include:
Agregando una capa
- Panning or zooming
- Resizing the QGIS window
Cambiando la visibilidad de una o varias capas
QGIS allows you to control the rendering process in a number of ways.
Renderizado dependiendo de la escala
Scale dependent rendering allows you to specify the minimum and maximum
scales at which a layer will be visible. To set scale dependency rendering,
open the Properties dialog by double-clicking on the layer in the
legend. On the General tab, click on the
 Use scale dependent rendering checkbox to activate
the feature then set the minimum and maximum scale values.
.
Use scale dependent rendering checkbox to activate
the feature then set the minimum and maximum scale values.
.
You can determine the scale values by first zooming to the level you want to use and noting the scale value in the QGIS status bar.
Controlando el Renderizado del mapa
El renderizado de mapa puede ser controlado de las siguentes formas:
Suspender el Renderizado
To suspend rendering, click the Render checkbox in the
lower right corner of the statusbar. When the Render
checkbox is not checked, QGIS does not redraw the canvas in response to any of
the events described in Section Renderizado. Examples of when you
might want to suspend rendering include:
Agregar varias capas e identificarlas antes de didibujar
Agregar una o más capas grandes y seleccionar la escala antes de dibujar
Agregar una o más capas grandes y hacer zoom a una vista específica antes de dibujar
Cualquiera combinación de la anteriores
Checking the Render checkbox enables rendering and causes an immediate
refresh of the map canvas.
Setting Layer Add Option
You can set an option to always load new layers without drawing them. This
means the layer will be added to the map, but its visibility checkbox in the
legend will be unchecked by default. To set this option, choose
menu option Settings ‣ Options ‣ and click on the
Rendering menu. Uncheck the By default new layers
added to the map should be displayed checkbox. Any layer added to the map will
be off (invisible) by default.
Another option in Settings ‣ Options ‣ Rendering
menu is the Enable back buffer checkbox. It provides better
graphics performance at the cost of loosing the possibility to cancel rendering and
incremental feature drawing. If it is unchecked, you can set the ‘Number of features
to draw before updating the display’, otherwise it is inactive.
Finally you can activate the Use render caching where possible
to speed up redraws checkbox.
Stopping Rendering
To stop the map drawing, press the ESC key. This will halt the refresh of the map canvas and leave the map partially drawn. It may take a bit of time between pressing ESC and the time the map drawing is halted.
Nota
It is currently not possible to stop rendering - this was disabled in qt4 port because of User Interface (UI) problems and crashes.
Updating the Map Display During Rendering
You can set an option to update the map display as features are drawn. By default, QGIS does not display any features for a layer until the entire layer has been rendered. To update the display as features are read from the datastore, choose menu option Settings ‣ Options click on the Rendering menu. Set the feature count to an appropriate value to update the display during rendering. Setting a value of 0 disables update during drawing (this is the default). Setting a value too low will result in poor performance as the map canvas is continually updated during the reading of the features. A suggested value to start with is 500.
Influence Rendering Quality
To influence the rendering quality of the map you have 2 options. Choose menu option Settings ‣ Options click on the Rendering menu and select or deselect following checkboxes.
- Make lines appear less jagged at the expense of some
drawing performance
- Fix problems with incorrectly filled polygons
Measuring
Measuring works within projected coordinate systems (e.g., UTM) and unprojected data. If the loaded map is defined with a geographic coordinate system (latitude/longitude), the results from line or area measurements will be incorrect. To fix this you need to set an appropriate map coordinate system (See Section Working with Projections). All measuring modules also use the snapping settings from the digitizing module. This is useful, if you want to measure along lines or areas in vector layers.
To select a measure tool click on  and select the tool you want
to use.
and select the tool you want
to use.
Measure length, areas and angles
Measure Line: QGIS is able to measure real distances between given points
according to a defined ellipsoid. To configure this, choose menu option
Settings ‣ Options, click on the Map tools tab and
choose the appropriate ellipsoid. There you can also define a rubberband color
and your preferred measurement units (meters or feet) and angle units (degrees,
radians and gon). The tools then allows you to click points on the map. Each
segment-length as well as the total shows up in the measure-window. To stop
measuring click your right mouse button.
Figure Measure 1:
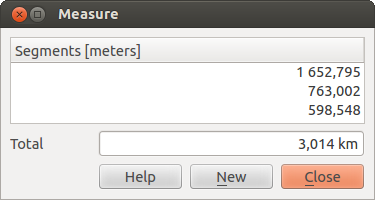
Measure Distance (Gnome)
 Measure Area: Areas can also be measured. In the measure window the
accumulated area size appears. In addition, the measuring tool will snap to the
currently selected layer, provided that layer has its snapping tolerance set.
(See Section Setting the Snapping Tolerance and Search Radius). So if you want to measure exactly along
a line feature, or around a polygon feature, first set its snapping tolerance,
then select the layer. Now, when using the measuring tools, each mouse click
(within the tolerance setting) will snap to that layer.
Measure Area: Areas can also be measured. In the measure window the
accumulated area size appears. In addition, the measuring tool will snap to the
currently selected layer, provided that layer has its snapping tolerance set.
(See Section Setting the Snapping Tolerance and Search Radius). So if you want to measure exactly along
a line feature, or around a polygon feature, first set its snapping tolerance,
then select the layer. Now, when using the measuring tools, each mouse click
(within the tolerance setting) will snap to that layer.
Figure Measure 2:
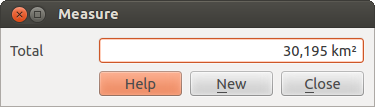
Measure Area (Gnome)
 Measure Angle: You can also measure angles. The cursor
becomes cross-shaped. Click to draw the first segment of the angle you
wish to measure, then move the the cursor to draw the desired angle. The measure
is displayed in a popup dialog.
Measure Angle: You can also measure angles. The cursor
becomes cross-shaped. Click to draw the first segment of the angle you
wish to measure, then move the the cursor to draw the desired angle. The measure
is displayed in a popup dialog.
Figure Measure 3:
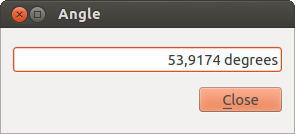
Measure Angle (Gnome)
Select and deselect features
The QGIS toolbar provides several tools to select features in the map canvas.
To select one or several features just click on
 and select your tool:
- Select Single Feature
 Select Features by Rectangle
 Select Features by Polygon
 Select Features by Freehand
 Select Features by Radius
To deselect all selected features click on  Deselect
features from all layers.
Deselect
features from all layers.
Decorations
The Decorations of QGIS includes the Grid, Copyright Label, the North Arrow and the Scale Bar. They are used to ‘decorate’ the map by adding cartographic elements.
Grid
 Grid allows to add a coordinate grid and
coordinate annotations to the map canvas.
Grid allows to add a coordinate grid and
coordinate annotations to the map canvas.
Figure Decorations 1:

The Grid Dialog
- Select from menu View ‣ Decorations ‣ Grid. The dialog starts (see figure_decorations_1).
- Activate the Enable grid checkbox and set grid
definitions according to the layers loaded in the map canvas.
- Activate the Draw annotations checkbox and set
annotation definitions according to the layers loaded in the map canvas.
- Click [Apply] to check, if it looks as expected.
- Click [OK] to close the dialog.
Copyright Label
 Copyright label adds a Copyright label
using the text you prefer to the map.
Copyright label adds a Copyright label
using the text you prefer to the map.
Figure Decorations 2:
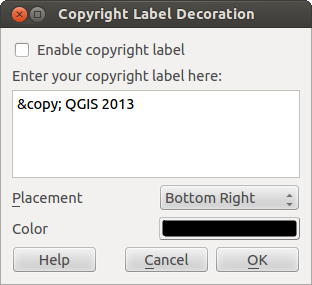
The copyright Dialog
- Select from menu View ‣ Decorations ‣ Copyright Label. The dialog starts (see figure_decorations_2).
- Enter the text you want to place on the map. You can use HTML as shown in the example
- Choose the placement of the label from the Placement ‘Bottom Right’ drop-down box
- Make sure the Enable Copyright Label checkbox is
checked
- Click [OK]
In the example above (default) QGIS places a copyright symbol followed by the date in the lower right hand corner of the map canvas.
North Arrow
![]() North Arrow places a simple north arrow on the
map canvas. At present there is only one style available. You can adjust the
angle of the arrow or let QGIS set the direction automatically. If you choose
to let QGIS determine the direction, it makes its best guess as to how the
arrow should be oriented. For placement of the arrow you have four options,
corresponding to the four corners of the map canvas.
North Arrow places a simple north arrow on the
map canvas. At present there is only one style available. You can adjust the
angle of the arrow or let QGIS set the direction automatically. If you choose
to let QGIS determine the direction, it makes its best guess as to how the
arrow should be oriented. For placement of the arrow you have four options,
corresponding to the four corners of the map canvas.
Figure Decorations 3:
The North Arrow Dialog
Scale Bar
 Scale Bar adds a simple scale bar to the map
canvas. You control the style and placement, as well as the labeling of the bar.
Scale Bar adds a simple scale bar to the map
canvas. You control the style and placement, as well as the labeling of the bar.
Figure Decorations 4:

The Scale Bar Dialog
QGIS only supports displaying the scale in the same units as your map frame. So if the units of your layers are in meters, you can’t create a scale bar in feet. Likewise if you are using decimal degrees, you can’t create a scale bar to display distance in meters.
To add a scale bar:
- Select from menu View ‣ Decorations ‣ Scale Bar The dialog starts (see figure_decorations_4)
- Choose the placement from the Placement ‘Bottom Left’ drop-down list
- Choose the style from the Scale bar style ‘Tick Down’ list
- Select the color for the bar Color of bar ‘black’ or use the default black color
- Set the size of the bar and its label Size of bar ‘30 degrees’
- Make sure the Enable scale bar checkbox is checked
- Optionally choose to automatically snap to a round number when the
canvas is resized Automatically snap to round number
on resize
- Click [OK]
Truco
Settings of Decorations
When you save a .qgs project, any changes you have made to Grid, NorthArrow, ScaleBar and Copyright will be saved in the project and restored the next time you load the project.
Annotation Tools
The  Text Annotation tools in the attribute toolbar
provides the possibility to place formatted text in a balloon on the QGIS map
canvas. Use the Text Annotation tool and click into the map canvas.
Text Annotation tools in the attribute toolbar
provides the possibility to place formatted text in a balloon on the QGIS map
canvas. Use the Text Annotation tool and click into the map canvas.
Figure annotation 1:
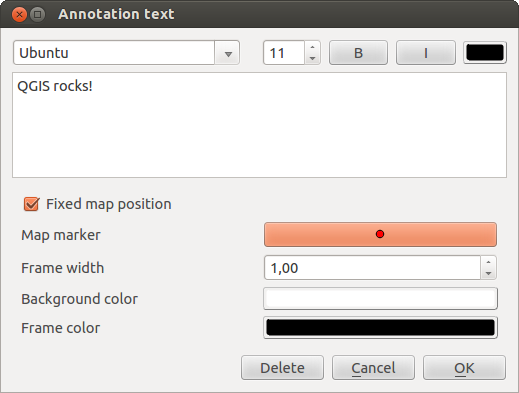
Annotation text dialog
Double click on the item opens a dialog with various options. There is the text editor to enter the formatted text and other item settings. E.g. there is the choice of having the item placed on a map position (displayed by a marker symbol) or to have the item on a screen position (not related to the map). The item can be moved by map position (drag the map marker) or by moving only the balloon. The icons are part of GIS theme, and are used by default in the other themes too.
The  Move Annotation tool allows to move the annotation on the
map canvas.
Move Annotation tool allows to move the annotation on the
map canvas.
Html annotations
The  Html Annotation tools in the attribute toolbar
provides the possibility to place the content of a html file in a balloon on the
QGIS map canvas. Use the Html Annotation tool, click into the map
canvas and add the path to the html file into the dialog.
Html Annotation tools in the attribute toolbar
provides the possibility to place the content of a html file in a balloon on the
QGIS map canvas. Use the Html Annotation tool, click into the map
canvas and add the path to the html file into the dialog.
SVG annotations
The  SVG Annotation tools in the attribute toolbar
provides the possibility to place a SVG Symbol in a balloon on the QGIS map canvas.
Use the SVG Annotation tool, click into the map canvas and add the
path to the SVG file into the dialog.
SVG Annotation tools in the attribute toolbar
provides the possibility to place a SVG Symbol in a balloon on the QGIS map canvas.
Use the SVG Annotation tool, click into the map canvas and add the
path to the SVG file into the dialog.
Form annotations
Additionally you can also create your own annotation forms. The
Form Annotation tool is useful to display attributes of
a vector layer in a customized qt designer form (see figure_custom_annotation). It is similar to the
designer forms for the
Identify features tool, but displayed in an annotation item.
Also see QGIS blog http://blog.qgis.org/node/143 for more information.
Figure annotation 2:

Customized qt designer annotation form
Nota
If you press Ctrl+T while an Annotation tool is active (move annotation, text annotation, form annotation), the visibility states of the items are inverted.
Spatial Bookmarks
Spatial Bookmarks allow you to “bookmark” a geographic location and return to it later.
Creating a Bookmark
To create a bookmark:
- Zoom or pan to the area of interest.
- Select the menu option View ‣ New Bookmark or press Ctrl-B.
- Enter a descriptive name for the bookmark (up to 255 characters).
- Press Enter to add the bookmark or [Delete] to remove the bookmark.
Note that you can have multiple bookmarks with the same name.
Working with Bookmarks
To use or manage bookmarks, select the menu option View ‣ Show Bookmarks. The Geospatial Bookmarks dialog allows you to zoom to or delete a bookmark. You can not edit the bookmark name or coordinates.
Zooming to a Bookmark
From the Geospatial Bookmarks dialog, select the desired bookmark by clicking on it, then click [Zoom To]. You can also zoom to a bookmark by double-clicking on it.
Deleting a Bookmark
To delete a bookmark from the Geospatial Bookmarks dialog, click on it then click [Delete]. Confirm your choice by clicking [Yes] or cancel the delete by clicking [No].
Nesting Projects
If you want to embed content from other project files into your project you can choose Layer ‣ Embed Layers and Groups.
Embedding layers
The following dialog allows you to embed layers from other projects:
- Press
 to look for another project from the Alaska dataset.
 - Select the project file grassland. You can see the content of the project (see figure_embed_dialog).
- Press Ctrl and klick on the layers grassland and regions. The layers are embedded in the map legend and the map view now.
Figure Nesting 1:
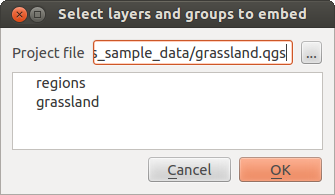
Select layers and groups to embed
While the embedded layers are editable you can’t change it’s properties like Style and Labeling.
Removing embedded layers
Right-click on the embedded layer and choose  Remove.
Add Delimited Text Layer
This function allows you to load a delimited text file as a layer in QGIS. Following settings need to be defined:
- The File format usually is
 CSV (comma separated values). If another delimiter is used, activate the custom delimiter radiobutton and if each line in the file is split using a regular expression, please activate the Regular expression delimiter radiobutton.
 - As Record options a text file usually provides a delimited header row of field names. This is usually the first line in the text file. If there is no header row available, deactivate the first records have field names checkbox. And if the header row isn’t the first line of the text file, define the number of header lines to discard.
- As Field options you can trim leading and trailing spaces from fields activating the Trim fields checkbox. You can Discard empty fields in each record and you can define that the Decimal separator is comma. Otherwise it will be point.
- As Geometry definitions a typical text file provides Point coordinates. This means there must be an ‘X’ and ‘Y’ field with coordinate values. If the text file provides a Well Known Text field, there must be a ‘WKT’ field with geometry information for point, line or polygon objects. These fields can have any name. Otherwise for attribute tables define no geometry. The x and y coordinates must be specified as a number. The coordinate system is not important. If they are defined in degree/minutes/seconds, activate the DMS coordinates checkbox.
- As Layer settings you can activate Use spatial index to improve performance of displaying and spatially selecting features. You can define to Use Subset index and to Watch file to watch for changes to the file by other applications, while QGIS is running.
As an example of a valid text file we import the elevation point data file elevp.csv coming with the QGIS sample dataset (See Section Sample Data):
X;Y;ELEV
-300120;7689960;13
-654360;7562040;52
1640;7512840;3
[...]
Some items of note about the text file are:
- The example text file uses ; (semicolon) as delimiter. Any character can be used to delimit the fields.
- The first row is the header row. It contains the fields X, Y and ELEV.
- No quotes (") are used to delimit text fields.
- The x coordinates are contained in the X field.
- The y coordinates are contained in the Y field.
Using the function
Click the toolbar icon  Add Delimited Text Layer in the
Manage layers toolbar to open the Create a Layer from a
Delimited Text File dialog as shown in figure_delimited_text_1.
Add Delimited Text Layer in the
Manage layers toolbar to open the Create a Layer from a
Delimited Text File dialog as shown in figure_delimited_text_1.
Figure Delimited Text 1:
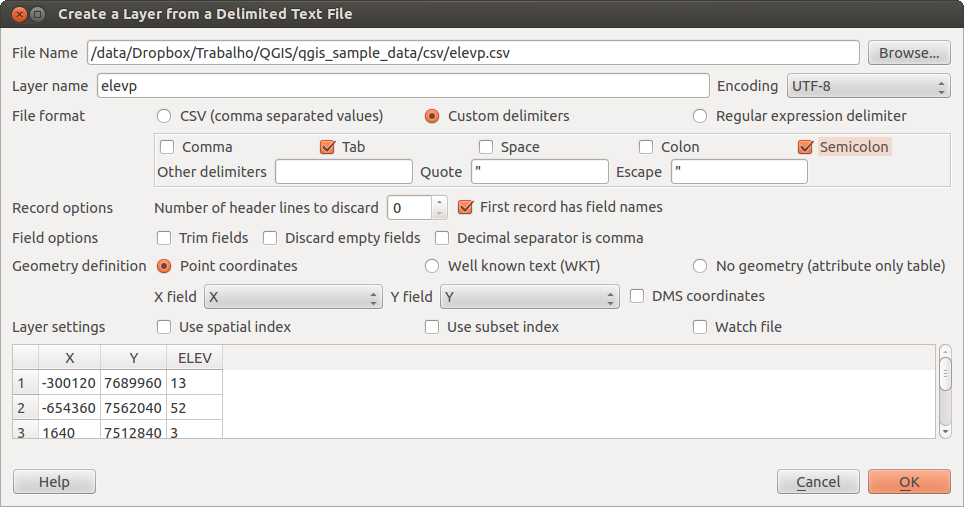
Delimited Text Dialog
First select the file (e.g., qgis_sample_data/csv/elevp.csv) to import by clicking on the [Browse] button. Once the file is selected, QGIS attempts to parse the file using the last used delimiter, in this case a semicolon (;). To properly parse the file, it is important to select the correct delimiter. To change the delimiter to tab use \t (this is a regular expression for the tab character).
Once the file is parsed, make a Geometry definition Point coordinates
and choose the X and Y fields from the dropdown lists. Finally enter a Layer name (e.g., elevp)
as shown in figure_delimited_text_1 . To add the layer to the map, click [OK]. The delimited text file now behaves as
any other map layer in QGIS.