Heatmap Plugin
The  Heatmap plugin allows to create a heatmap from a point
vector map. A heatmap is a raster map showing the density or magnitude of point
related information. From the result “hotspots” can easily be identified.
Heatmap plugin allows to create a heatmap from a point
vector map. A heatmap is a raster map showing the density or magnitude of point
related information. From the result “hotspots” can easily be identified.
Activate the Heatmap plugin
First this core plugin needs to be activated using the Plugin Manager (see
Section Loading a QGIS Core Plugin). After activation the heatmap icon
can be found in the Raster Toolbar.
Select from menu View ‣ Toolbars ‣ Raster to activate the Raster Toolbar when it is not yet activated.
Using the Heatmap plugin
The Heatmap toolbutton starts the dialog of the Heatmap plugin
(see figure_heatmap_2).
The dialog has the following options:
- Input Point Vector dialog: Provides a selection of loaded point vector maps.
- Output Raster: Using the
 button you select the folder and
the name of the output raster the Heatmap plugin will generate. It is not
necessary to give a file extension
button you select the folder and
the name of the output raster the Heatmap plugin will generate. It is not
necessary to give a file extension - Output Format: Selection of the output format. Although all formats supported by GDAL can be choosen, GeoTIFF is most in cases the best format to choose.
- Radius: can be used to give the radius in meters or mapunit. When the radius is choosen too small you will not get a nice heatmap. In places where more circles around points overlap eachother the brighter hotspots will occur!
- Decay Ratio: is used to show with which ratio the heat dies out from the
center.
- When 0 is given (=minimum) the heat will be concentrated in the centre of given radius and be completely extinguished at the edge.
- When 10 is given (=maximum) the heat is concentrated at the edge and in the centre it is completely extinguished. Higher given values are allowed but have no effect.
- When 1 is given the heat is spread evenly over the whole circle.
- When a negative Decay Ratio is given you will create a Coolmap instead of a Heatmap!
When the  Advanced checkbox is checked it will give acces
to additional advanced options.
Advanced checkbox is checked it will give acces
to additional advanced options.
- Row and Column, can be used to change the pixelsize of the output raster. More rows and colums means a smaller pixelsize and the size of the output file will become bigger and processing a bit slower. When doubling the number of rows this will automatically double the size of Columns and the cell sizes will also be halved. The area of the output raster will remain the same!
- Cell Size X and Cell Size Y influence the pixelsize of the output raster and will also change the rows and columns.
The point vector layer may have attribute fields that can be used to create a heatmap:
- Use Radius from Field: the radius set from an attribute field.
- Use Weight from field: the weight factor set from an attribute field.
When the output raster is given, the [OK] button can be used to create a heatmap. The first result is a grey surface that still needs to be given additional treatment to make it a heatmap.
경고
Changing the raster size properties
When changing the raster size properties, this also changes the resulting output. The hotspot areas will become bigger.
Creating a Heatmap
For the following example, we will use the airports vector point layer from the QGIS sample dataset (see Sample Data). Another exellent QGIS tutorial on making heatmaps can be found on http://qgis.spatialthoughts.com.
In Figure_Heatmap_1 the airports of Alaska are shown.
Figure Heatmap 1:
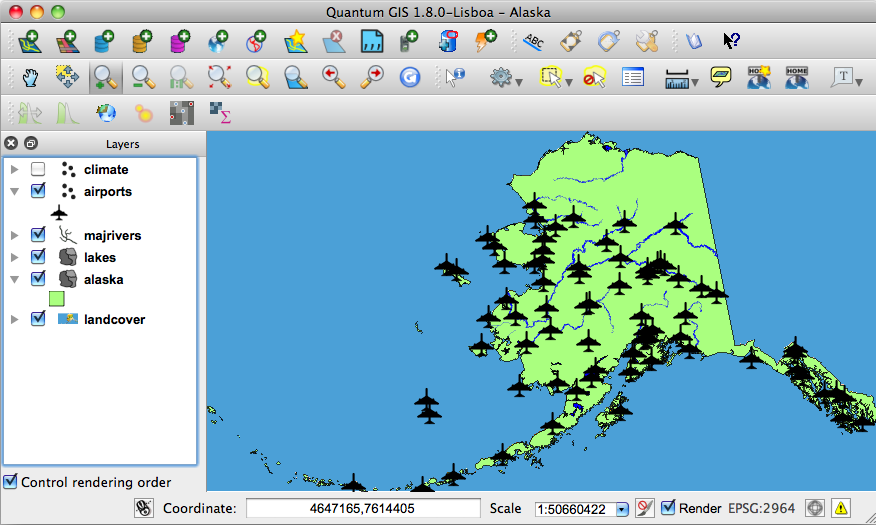
Airports of Alaska 
- Select the Heatmap toolbutton. The heatmap dialog starts
(see Figure_Heatmap_2).
- In field Input Point Vector
 select airpoirt
from the list of point layers loaded in current project.
select airpoirt
from the list of point layers loaded in current project. - In field Output Raster give the name and location using the
button of the output raster. Give the output raster file the
name heatmap_airports to give an file extension is not necessary.
- In field Output Format choose GeoTIFF.
- In the field Radius give 1000000 meters.
- The original Decay Ratio of 0.1 is fine.
- Click on [OK] to create and load the new raster map (see Figure_Heatmap_3).
Figure Heatmap 2:
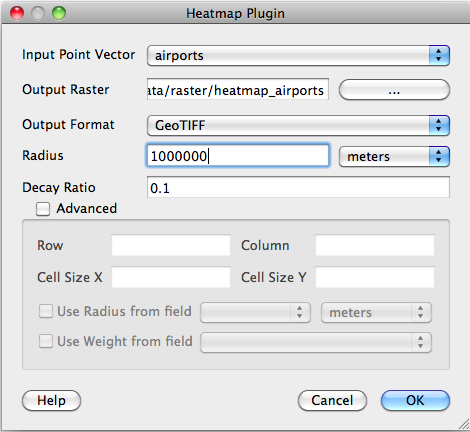
The Heatmap Dialog
The result after loading the heatmap is probably not the result which was expected. It is still a grey even surface not showing any variation. First some additional configuration of this layer needs to be done to make the heatmap present itself.
Figure Heatmap 3:
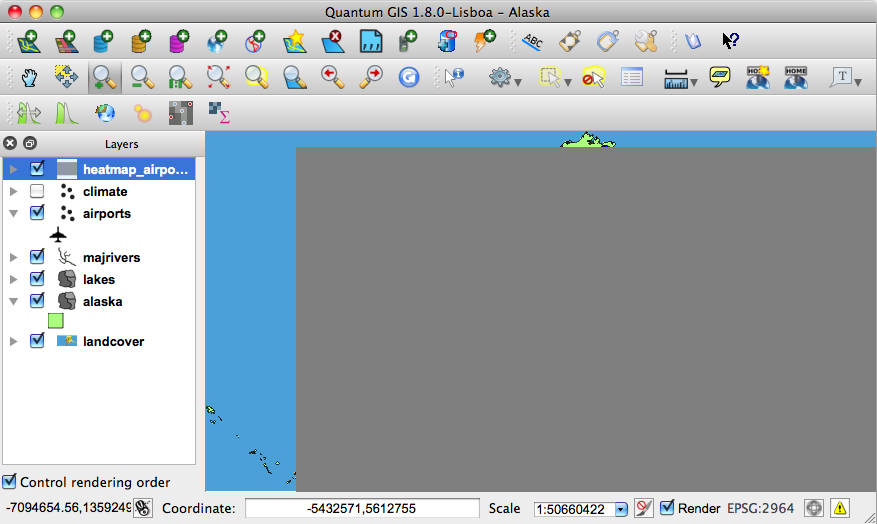
The heatmap after loading looks like a grey surface
- Open the properties dialog of layer heatmap_airports (select the layer heatmap_airports, open context menu with right mouse button and select Properties).
- Select the Symbology tab.
- Change Color map from ‘Grayscale’ to ‘Pseudocolor’.
- Press the [Apply] button.
- Switch to the Transparency tab and set Global transparency
 to 40%.
 - Select [OK]
The final result is shown in Figure_Heatmap_4.
Figure Heatmap 4:
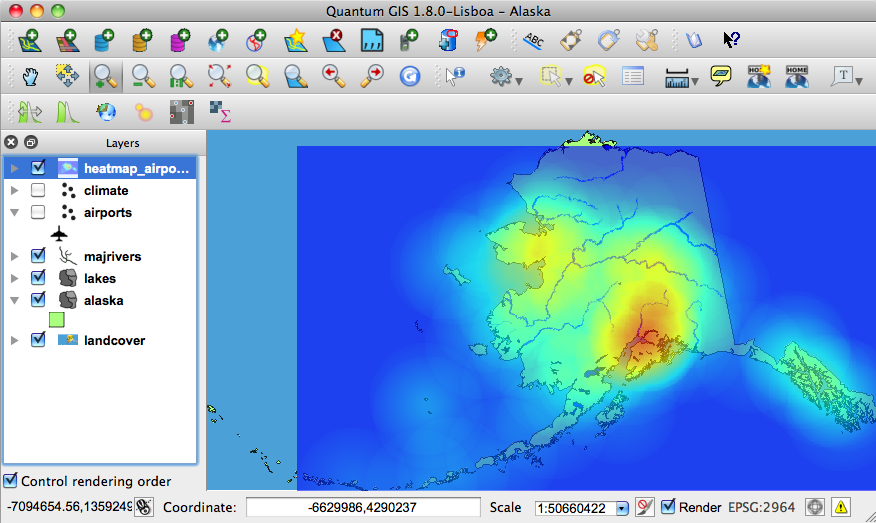
Final result of heatmap created of airports of Alaska