CBS’ye Giriş
 |
Hedefler: |
CBS’nin ne olduğunu ve kullanım amaçlarını öğrenmek. |
Anahtar kelimeler |
CBS, Bilgisayar, Haritalar, Veri, Bilgi Sistemleri, Mekansal Analiz |
Genel Bakış
Tıpkı doküman oluşturmak için kelime işlemci programlar kullandığımız gibi mekansal veriler ile bilgisayar üzerinde işlem yapmak için CBS uygulamaları” kullanırız. CBS **’Coğrafi Bilgi Sistemleri’ için kullanılan bir kısaltmadır.
CBS şu bileşenlerden oluşur:
- Sayısal Veri –– bilgisayar kullanarak görüntüleyeceğiniz ve
analiz edeceğiniz coğrafi veri.
Donanım –– veri işlemek, görüntülemek ve depolamak için kullanılan bilgisayarlar.
Yazılım –– donanım üzerinde çalışan ve sayısal veri ile çalışmanıza imkan tanıyan bilgisayar programları. CBS’nin bir parçası olan bilgisayar programlarına CBS Uygulaması adı verilir.
CBS uygulaması ile sayısal haritaları bilgisayarınızda açabilir, yeni mekansal bilgi üreterek haritaya ekleyebilir, ihtiyaçlarınıza uygun haritaları yazdırabilir ve mekansal analizler gerçekleştirebilirsiniz.
Let’s look at a little example of how GIS can be useful. Imagine you are a health worker and you make a note of the date and place of residence of every patient you treat.
Boylam |
Enlem |
Hastalık |
Tarih |
|---|---|---|---|
| 26.870436 | -31.909519 | Kabakulak |
13/12/2008 |
| 26.868682 | -31.909259 | Kabakulak |
24/12/2008 |
| 26.867707 | -31.910494 | Kabakulak |
22/01/2009 |
| 26.854908 | -31.920759 | Kızamık |
11/01/2009 |
| 26.855817 | -31.921929 | Kızamık |
26/01/2009 |
| 26.852764 | -31.921929 | Kızamık |
10/02/2009 |
| 26.854778 | -31.925112 | Kızamık |
22/02/2009 |
| 26.869072 | -31.911988 | Kabakulak |
02/02/2009 |
| 26.863354 | -31.916406 | Su çiçeği |
26/02/2009 |
Yukarıdaki tabloya bakacak olursanız Ocak ve Şubat aylarında çok sayıda kızamık vakası olduğunu hemen farkedersiniz. Sağlık personelimiz her hastanın evinin koordinatlarını tabloya işlemiş. CBS uygulaması ile bu veriyi görüntülersek hastalığın örüntüsü(dağılımı) hakkında daha fazla bilgi sahibi oluruz.
Figure Patterns of illness:
CBS Hakkında Daha Fazlası
CBS görece yeni bir alandır — 1970’lerde başlamıştır. Bilgisayarlı CBS ilk zamanlar yalnızca pahalı bilgisayarlara sahip şirketler ve üniversiteler tarafından kullanılabiliyordu. Bugunse kişisel bilgisayar veya dizüstü bilgisayar sahibi herkes CBS yazılımı kullanabilir. Zaman içerisinde CBS uygulamalarının kullanımı kolaylaştı –– önceleri bu programları kullanabilmek için yoğun bir eğitim gerekirken bugün amatör ve sıradan kullanıcılar bile kolayca kullanabilmektedir. Yukarıda da belirttiğimiz üzere CBS yazılımdan daha fazlasıdır, sayısal coğrafi verinin yönetimi ve kullanımına ilişkin tüm boyutları içerir. Takip eden rehberlerde CBS Yazılımlarına(Uygulamalarına) yoğunlaşacağız.
CBS Yazılımı / Uygulaması Nedir?
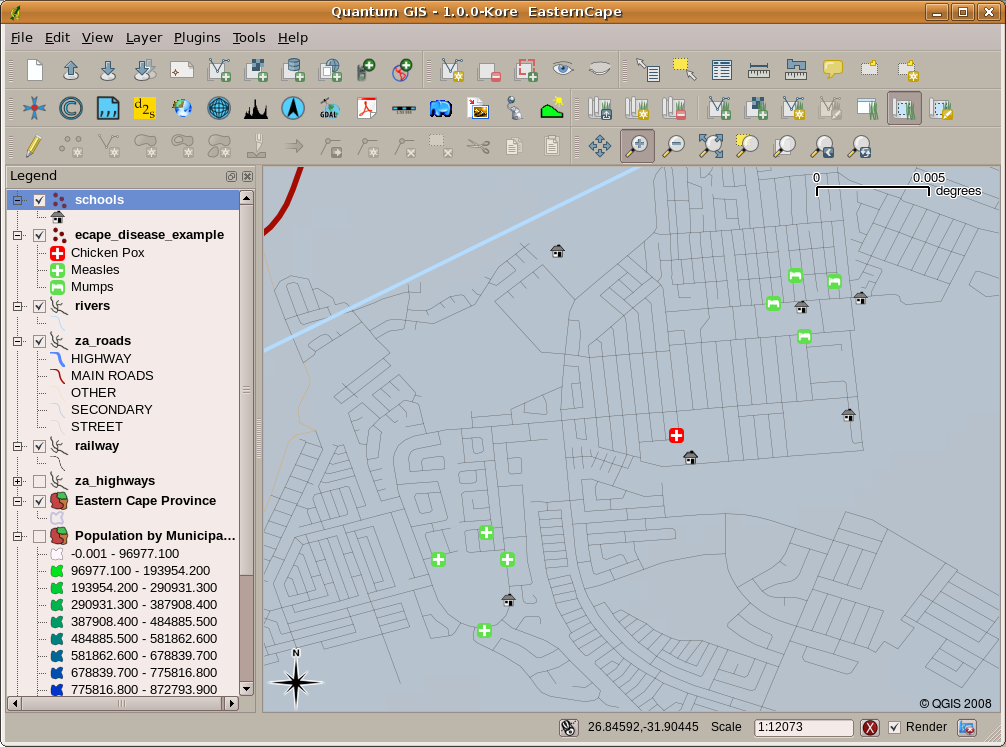
You can see an example of what a GIS Application looks like figure_gis_application. GIS Applications are normally programs with a graphical user interface that can be manipulated using the mouse and keyboard. The application provides menus near to the top of the window (File, Edit etc.) which, when clicked using the mouse, show a panel of actions. These actions provide a way for you to tell the GIS Application what you want to do. For example you may use the menus to tell the GIS Application to add a new layer to the display output.
Figure Menus in GIS Application:
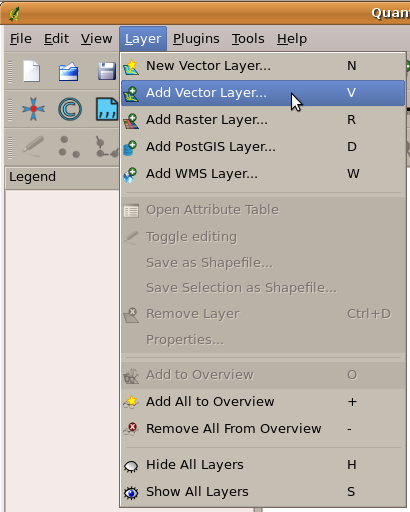
Application menus, when clicked with the mouse, expand to show a list of actions that can be carried out.
Toolbars (rows of small pictures that can be clicked with the mouse) normally sit just below the menus and provide a quicker way to use frequently needed actions.
Figure Toolbars in GIS Application:

Toolbars provide quick access to commonly used functions. Holding your mouse over a picture will usually tell you what will happen when you click on it.
A common function of GIS Applications is to display map layers. Map layers are stored as files on a disk or as records in a database. Normally each map layer will represent something in the real world –– a roads layer for example will have data about the street network.
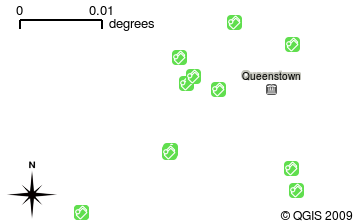
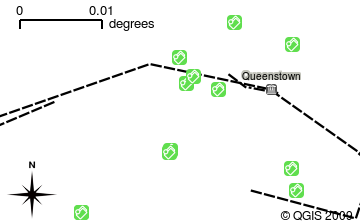
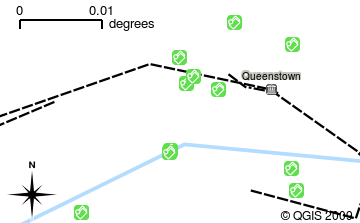
When you open a layer in the GIS Application it will appear in the map view. The map view shows a graphic representing your layer. When you add more than one layer to a map view, the layers are overlaid on top of each other. Look at figures figure_map_view_1, figure_map_view_2, figure_map_view_3 and figure_map_view_4 to see a map view that has several layers being added to it. An important function of the map view is to allow you to zoom in to magnify, zoom out to see a greater area and move around (panning) in the map.
Figure Map View 1:
Figure Map View 2:
Figure Map View 3:
Figure Map View 4:
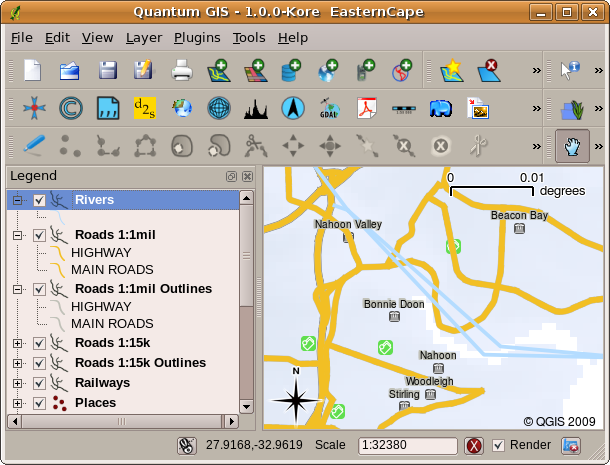
Another common feature of GIS Applications is the map legend. The map legend provides a list of layers that have been loaded in the GIS Application. Unlike a paper map legend, the map legend or ‘layers list’ in the GIS Application provides a way to re-order, hide, show and group layers. Changing the layer order is done by clicking on a layer in the legend, holding the mouse button down and then dragging the layer to a new position. In figures figure_map_legend_1 and figure_map_legend_2 the map legend is shown as the area to the left of the GIS Application window. By changing the layer order, the way that layers are drawn can be adjusted –– in this case so that rivers are drawn over the roads instead of below them.
Figure Map Symbology 1:
Figure Map Legend 1:
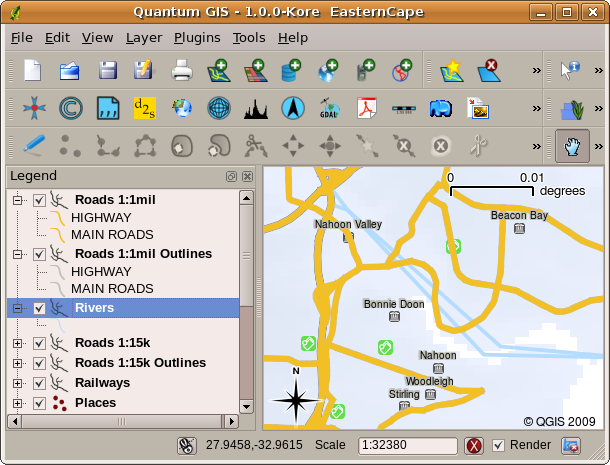
Changing the layer order allows to adjust the way that layers are drawn. Before changing the layer order, rivers are drawn underneath roads
Figure Map Legend 2:
Getting a GIS Application for your own computer(s)
There are many different GIS Applications available. Some have many sophisticated features and cost tens of thousands of Rands for each copy. In other cases, you can obtain a GIS Application for free. Deciding which GIS Application to use is a question of how much money you can afford and personal preference. For these tutorials, we will be using the QGIS Application. QGIS is completely free and you can copy it and share it with your friends as much as you like. If you received this tutorial in printed form, you should have received a copy of QGIS with it. If not, you can always visit http://hub.qgis.org/projects/quantum-gis/wiki/Download to download your free copy if you have access to the internet.
GIS Data
Now that we know what a GIS is and what a GIS Application can do, let’s talk about GIS data. Data is another word for information. The information we use in a GIS normally has a geographical aspect to it. Think of our example above, about the health care worker. She created a table to record diseases that looked like this:
Boylam |
Enlem |
Hastalık |
Tarih |
|---|---|---|---|
| 26.870436 | -31.909519 | Kabakulak |
13/12/2008 |
The longitude and latitude columns hold geographical data. The disease and date columns hold non-geographical data.
A common feature of GIS is that they allow you to associate information (non-geographical data) with places (geographical data). In fact, the GIS Application can store many pieces of information which are associated with each place –– something that paper maps are not very good at. For example, our health care worker could store the person’s age and gender on her table. When the GIS Application draws the layer, you can tell it to draw the layer based on gender, or based on disease type, and so on. So, with a GIS Application we have a way to easily change the appearance of the maps we created based on the non-geographical data associated with places.
GIS Systems work with many different types of data. Vector data is stored as a series of X, Y coordinate pairs inside the computer’s memory. Vector data is used to represent points, lines and areas. Illustration figure_vector_data shows different types of vector data being viewed in a GIS application. In the tutorials that follow we will be exploring vector data in more detail.
Figure Vector Data 1:
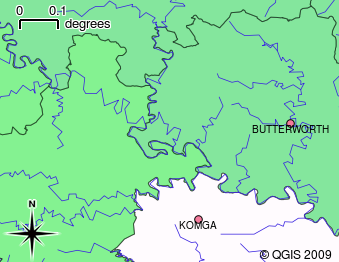
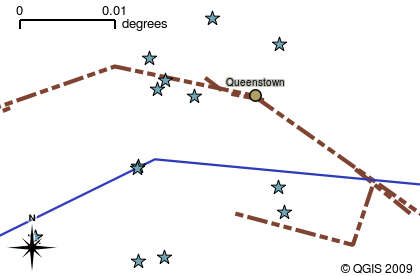
Vector data is used to represent points (e.g. towns), lines (e.g. rivers) and polygons (e.g. municipal boundaries).
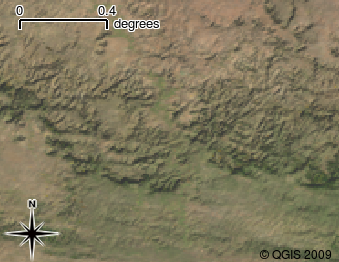
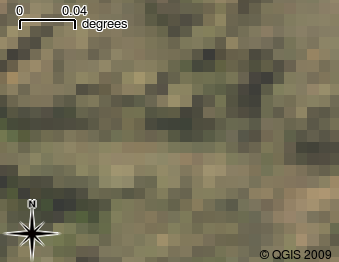
Raster data are stored as a grid of values. There are many satellites circling the earth and the photographs they take are a kind of raster data that can be viewed in a GIS. One important difference between raster and vector data is that if you zoom in too much on a raster image, it will start to appear ‘blocky’ (see illustrations figure_raster_data_1 and figure_raster_data_2). In fact these blocks are the individual cells of the data grid that makes up the raster image. We will be looking at raster data in greater detail in later tutorials.
Figure Raster Data 1:
Figure Raster Data 2:
What have we learned?
Let’s wrap up what we covered in this worksheet:
- A GIS is a system of computer hardware, computer software and geographical data.
- A GIS Application allows you to view geographical data and is an important part of the GIS.
- A GIS Application normally consists of a menu bar, toolbars, a map view and a legend.
- Vector and raster data are geographical data used in a GIS application.
- Geographical data can have associated non-geographical data.
Now you try!
Here are some ideas for you to try with your learners:
- Geography: Describe the concept of GIS to your learners as outlined in this
tutorial. Ask them to try to think of 3 reasons why it might be handy to use a
GIS instead of paper maps. Here are some that we could think of:
- GIS Applications allow you to create many different types of maps from the same data.
- GIS is a great visualisation tool that can show you things about your data and how they are related in space (e.g. those disease outbreaks we saw earlier).
- Paper maps need to be filed and are time consuming to view. The GIS can hold a very large amount of map data and make it quick and easy to find a place you are interested in.
- Geography: Can you and your learners think of how raster data from
satellites could be useful? Here are some ideas we had:
- During natural disasters, raster data can be useful to show where the impacted areas are. For example a recent satellite image taken during a flood can help to show where people may need rescuing.
- Sometimes people do bad things to the the environment, like dumping dangerous chemicals that kill plants and animals. Using raster data from satellites can help us to monitor for these type of problems.
- Town planners can use raster data from satellites to see where informal settlements are and to help in planning infrastructure.
Something to think about
If you don’t have a computer available, many of the topics we cover in this tutorial can be reproduced using an overhead and transparency as it uses the same technique of layering information. However, to properly understand GIS it is always better to learn it using a computer.
Daha Fazla Kaynak
Kitap: Desktop GIS: Mapping the Planet with Open Source Tools. Author: Gary Sherman. ISBN: 9781934356067
Website: http://www.gisdevelopment.net/tutorials/tuman006.htm
The QGIS User Guide also has more detailed information on working with QGIS.
Sırada Ne Var?
In the sections that follow we are going to go into more detail, showing you how to use a GIS Application. All of the tutorials will be done using QGIS. Next up, let’s look at vectors!
