4.3. Lesson: Clasificarea
Labels are a good way to communicate information such as the names of individual places, but they can’t be used for everything. For example, let’s say that someone wants to know what each landuse area is used for. Using labels, you’d get this:
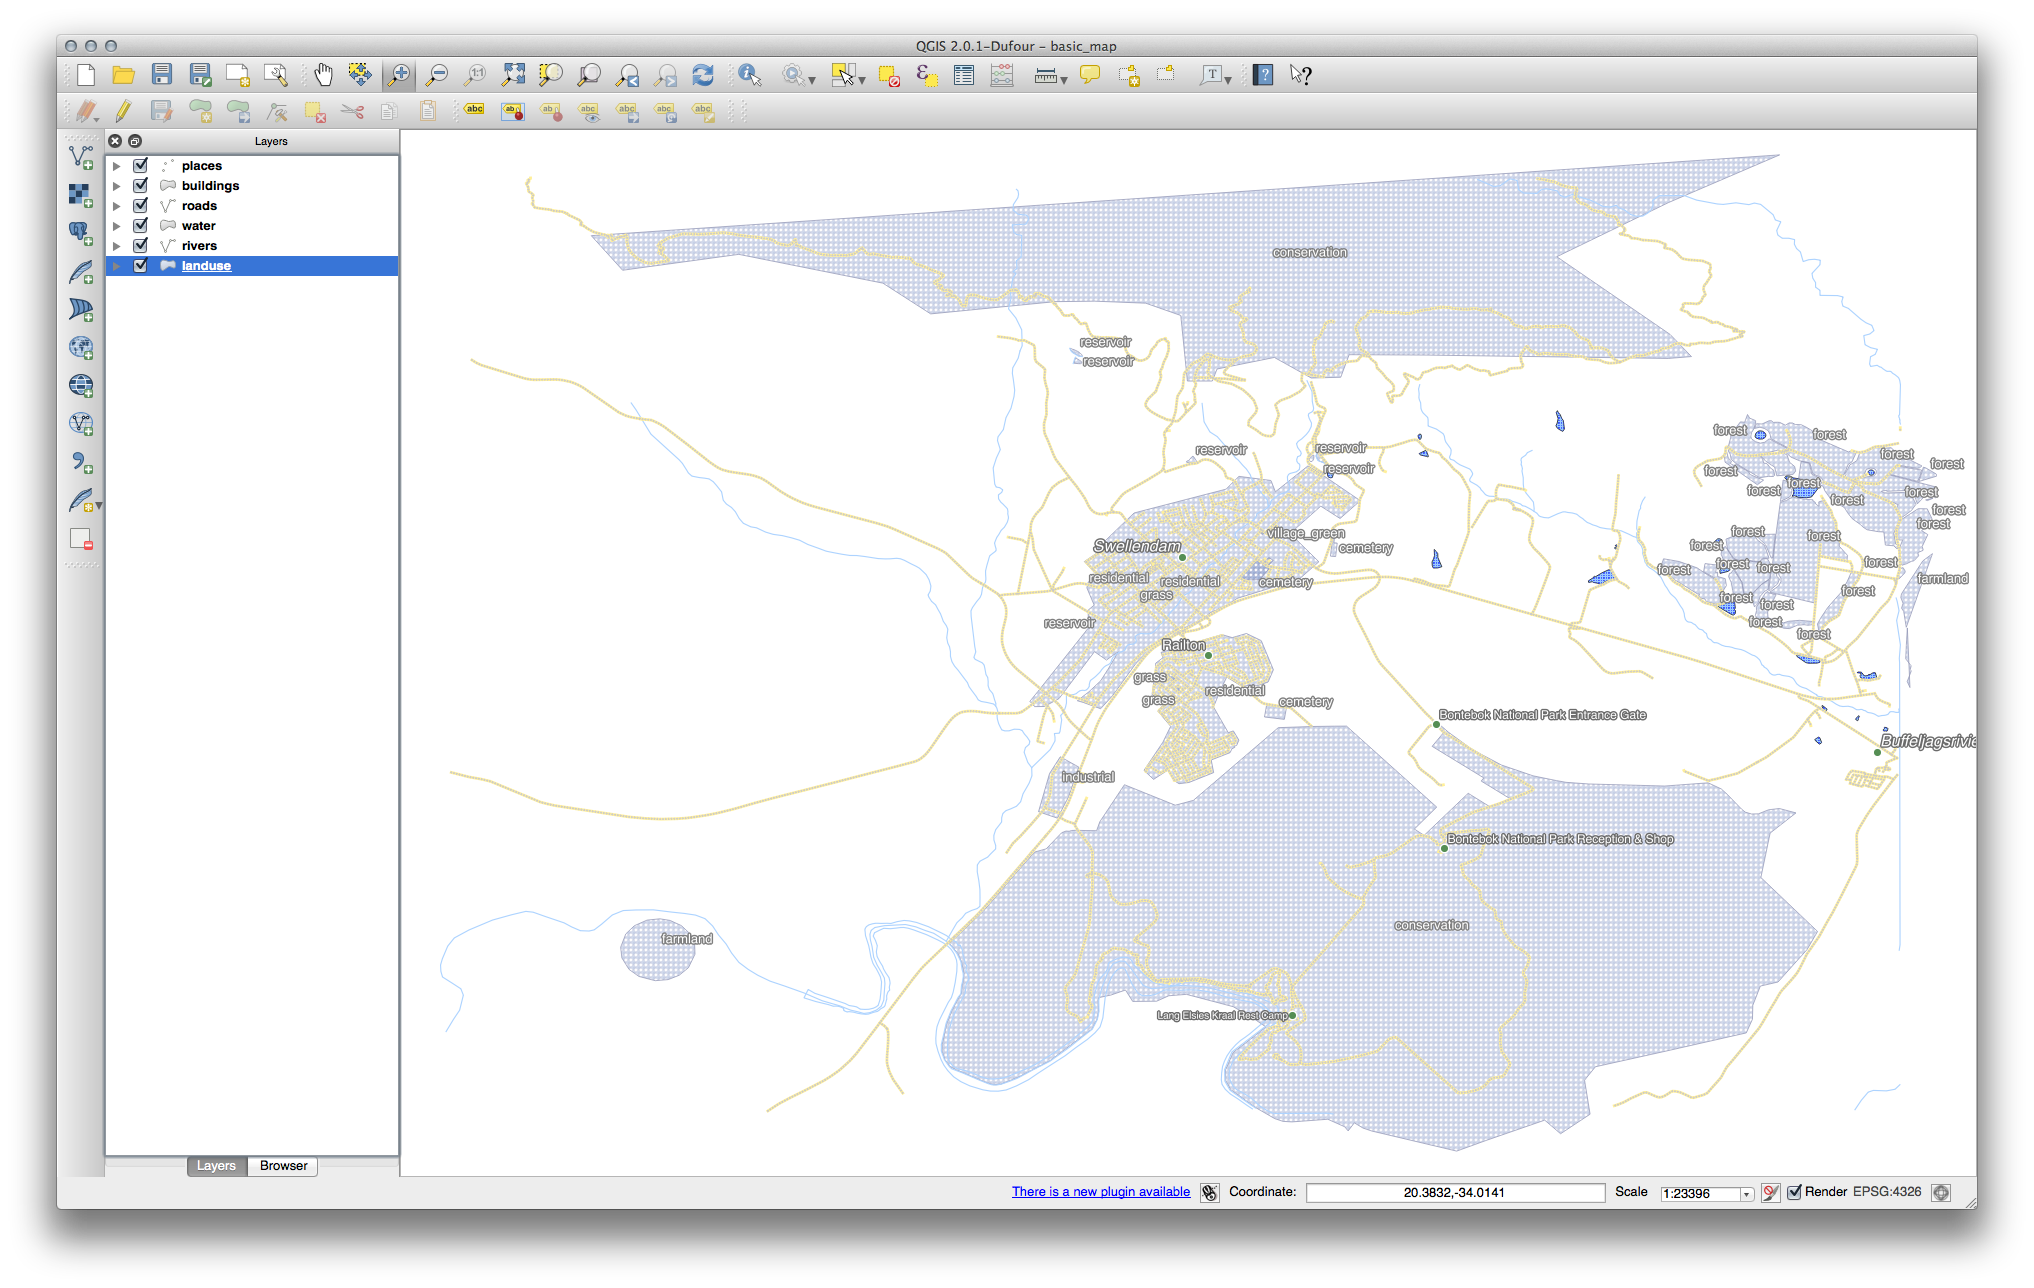
Acest lucru face etichetarea hărții dificil de înțeles, și chiar copleșitoare atunci când există suprafețe de teren cu numeroase utilizări.
Scopul acestei lecții: De a afla cum se pot clasifica în mod eficient datele vectoriale.
4.3.1.  Follow Along: Clasificarea Datelor Nominale
Deschideți dialogul Proprietăților Stratului pentru stratul landuse.
Mergeți la fila Stil.
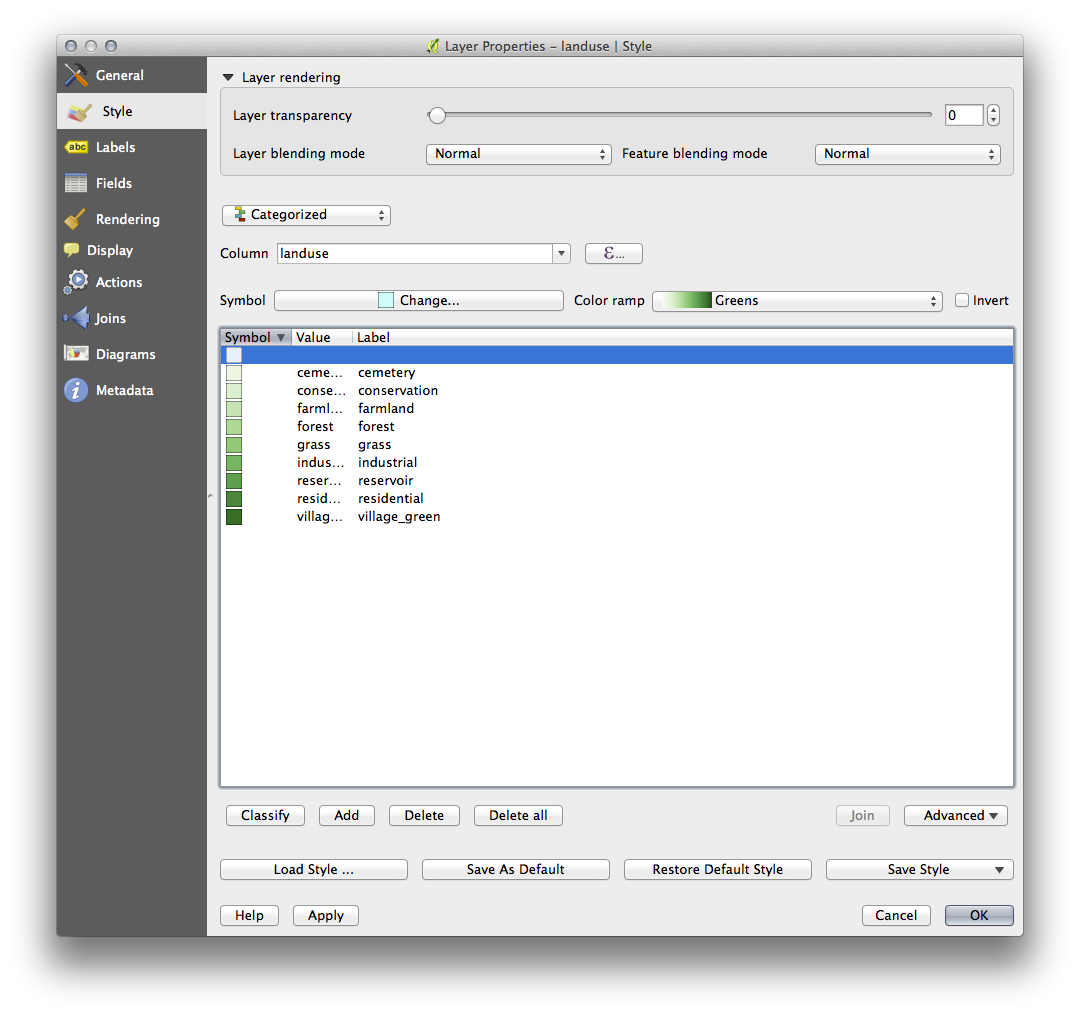
- Click on the dropdown that says Single Symbol and change it to Categorized:
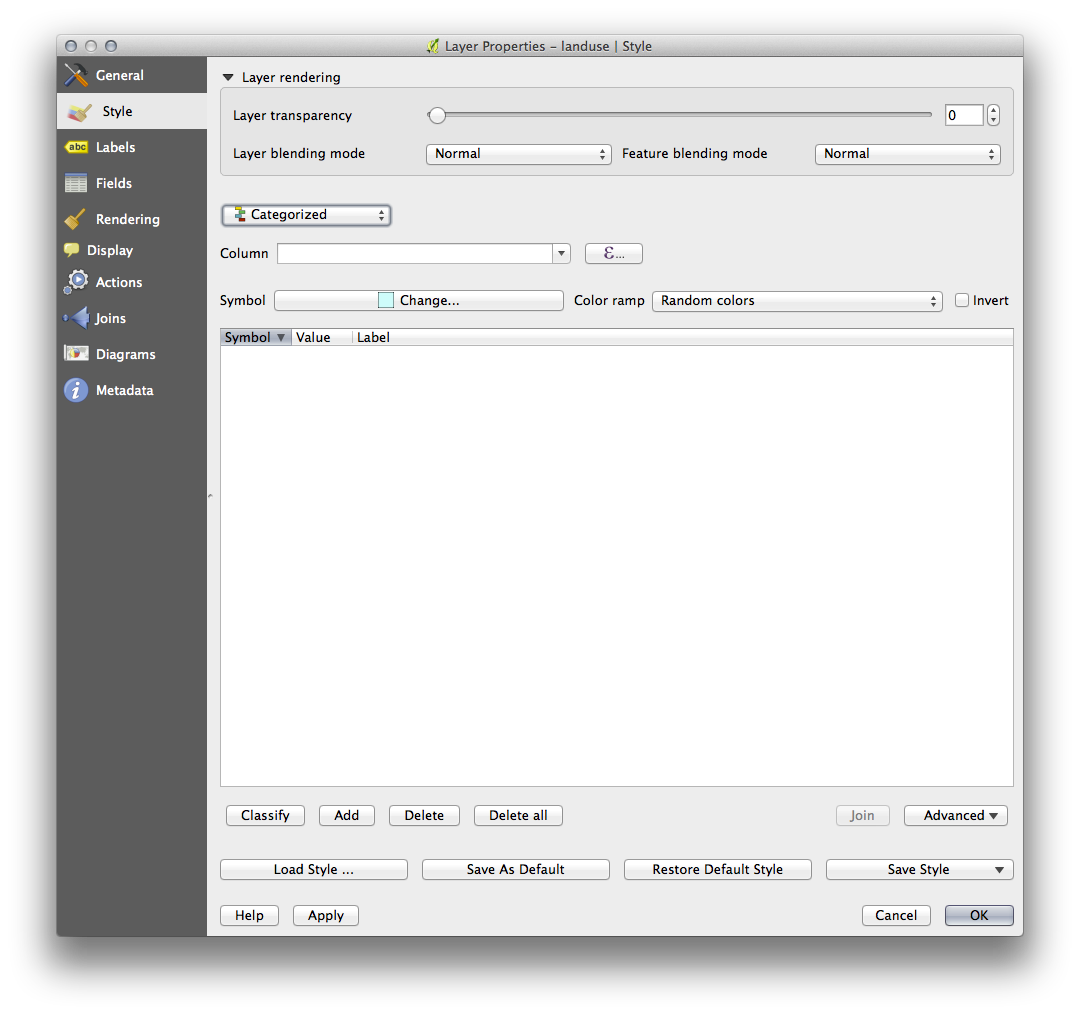
- In the new panel, change the Column to landuse and the Color ramp to Greens.
Faceți clic pe butonul etichetat Classify:

Clic pe OK
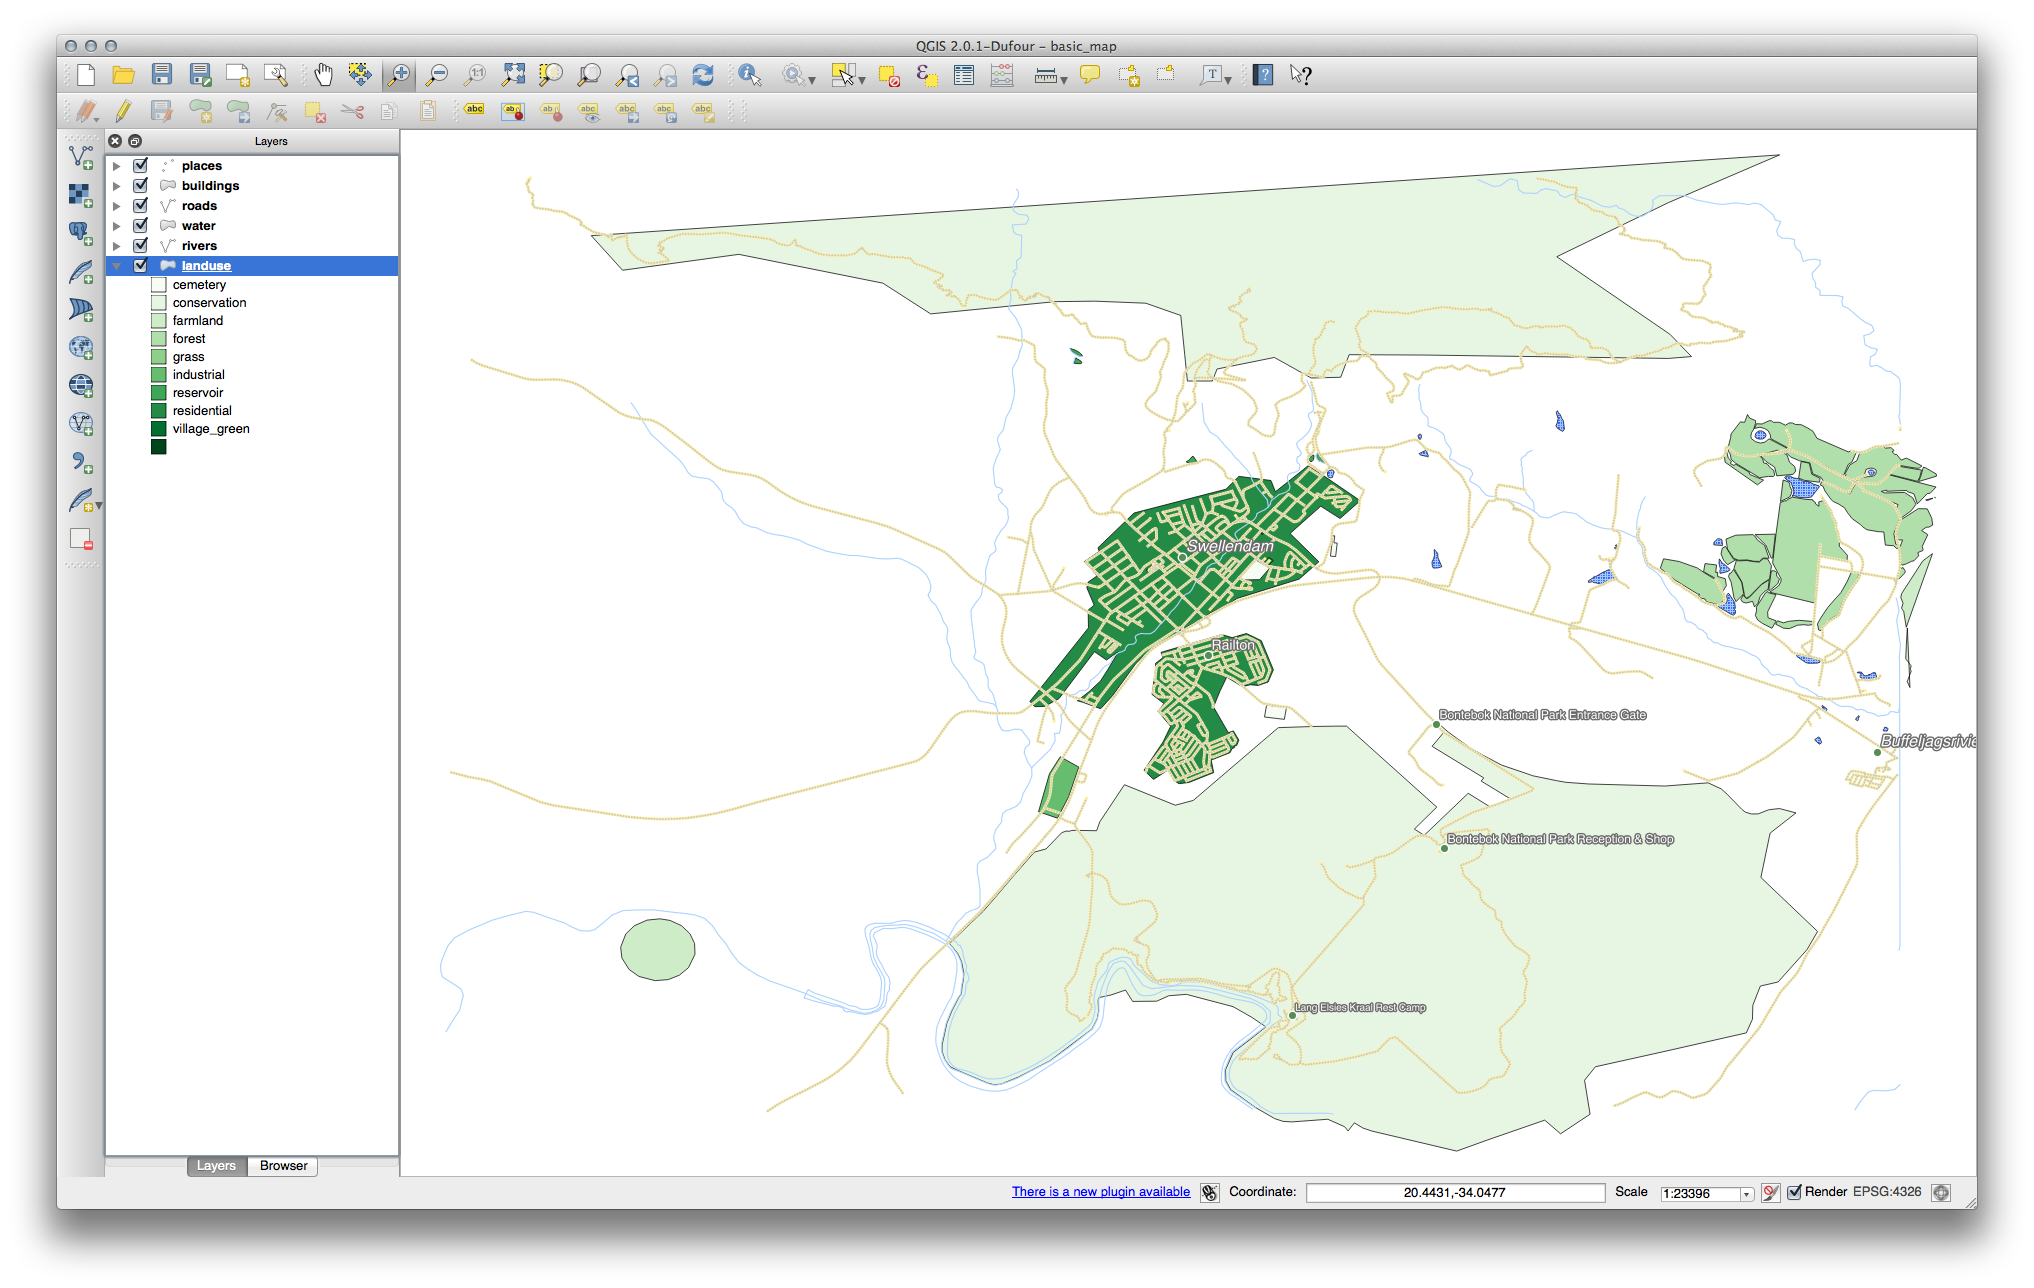
Veți vedea ceva de genul următor:
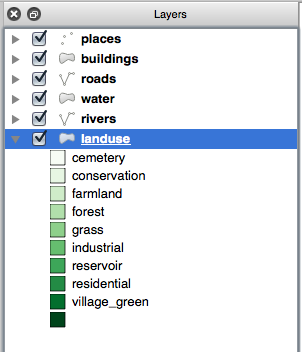
- Click the arrow (or plus sign) next to landuse in the Layer list, you’ll see the categories explained:
Now our landuse polygons are appropriately colored and are classified so that areas with the same land use are the same color. You may wish to remove the black border from the landuse layer:
Deschideți Proprietățile Stratului, mergeți la fila Style, apoi selectați Symbol.
- Change the symbol by removing the border from the Simple Fill layer and click OK.
Veți observa că au fost eliminate contururile poligonale ale modurilor de utilizare, lăsând doar noile culori de umplere pentru fiecare clasificare.
Dacă doriți, puteți schimba culoarea de umplere pentru fiecare zonă de folosință, printr-un dublu-clic pe blocul de culoare relevant:
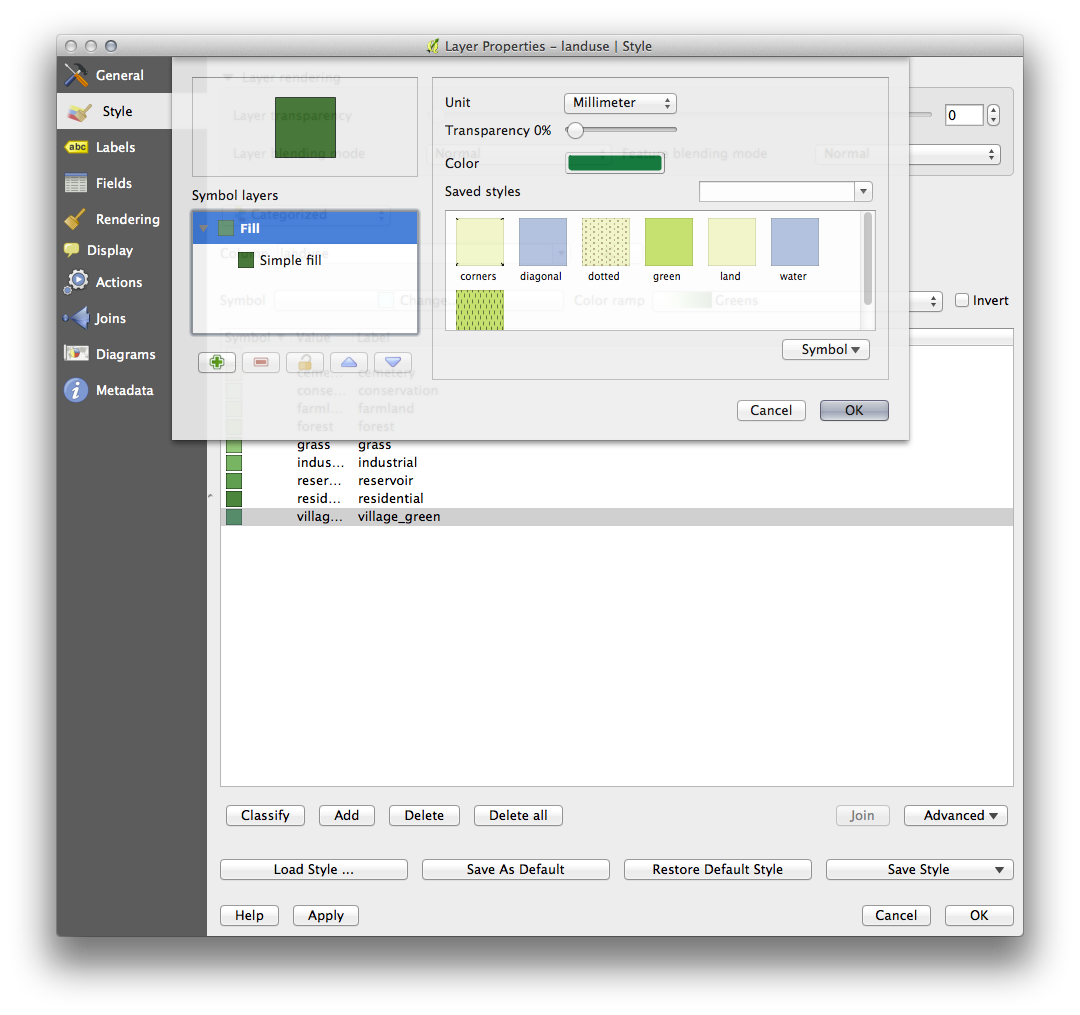
Observați că există o categorie necompletată:
This empty category is used to color any objects which do not have a landuse value defined or which have a NULL value. It is important to keep this empty category so that areas with a NULL value are still represented on the map. You may like to change the color to more obviously represent a blank or NULL value.
Amintiți-vă să salvați harta dvs. acum, astfel încât să nu pierdeți toate modificările greu efectuate!
4.3.2. Try Yourself Mai Multe Clasificări
If you’re only following the basic-level content, use the knowledge you gained above to classify the buildings layer. Set the categorisation against the building column and use the Spectral color ramp.
Note
Amintiți-vă să focusați într-o zonă urbană, pentru a vedea rezultatele.
4.3.3.  Follow Along: Rația Clasificării
Există patru tipuri de clasificare: nominal, ordinal, interval și raport.
În clasificarea nominală, categoriile în care sunt clasificate obiectele sunt bazate pe nume; ele nu au nici o ordine. De exemplu: nume de localități, coduri de sector, etc.
În clasificarea ordinală, categoriile sunt aranjate într-o anumită ordine. De exemplu, orașelor lumii li se conferă un rang. în funcție de importanța lor pentru comerțul mondial, pentru călătorii, cultură, etc.
În clasificarea de tip interval, numerele sunt poziționate pe o scară cu valori pozitive, negative, și zero. De exemplu: înălțimea peste/sub nivelul mării, temperatura peste/sub punctul de îngheț (0 grade Celsius), etc.
În clasificarea de tip raport, cifrele sunt poziționate pe o scară doar cu valori pozitive și zero. De exemplu: temperatura peste zero absolut (0 grade Kelvin), distanța de la un punct, valoarea lunară medie a traficului pe o anumită stradă, etc.
In the example above, we used nominal classification to assign each farm to the town that it is administered by. Now we will use ratio classification to classify the farms by area.
- Save your landuse symbology (if you want to keep it) by clicking on the Save Style ... button in the Style dialog.
Vom reclasifica stratul, astfel încât clasele existente se vor pierde dacă nu sunt salvate.
Închideți dialogul Stilului.
Deschideți Tabela de Atribute a stratului landuse.
Vrem să clasificăm zonele de folosință după dimensiune, dar există o problemă: acestea nu au un câmp de dimensiune, așa că vom face unul.
Introduceți modul de editare, făcând clic pe acest buton:

Adăugați o nouă coloană cu acest buton:

Configurați dialogul care apare, în felul următor:

Clic pe OK
The new field will be added (at the far right of the table; you may need to
scroll horizontally to see it). However, at the moment it is not populated, it
just has a lot of NULL values.
Pentru a rezolva această problemă, trebuie să calculăm suprafețele.
Deschideți calculatorul de câmpuri:

Veți obține acest dialog:
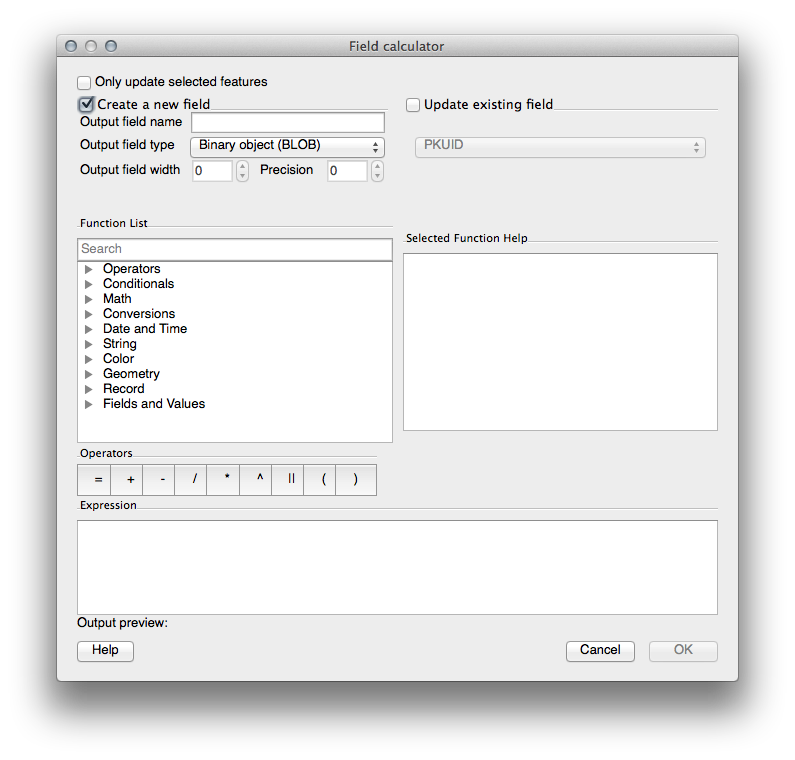
Modificați valorile din partea de sus a dialogului pentru a arata ca aceasta:
În the Lista Funcțiilor, selectați Geometry ‣ $area:
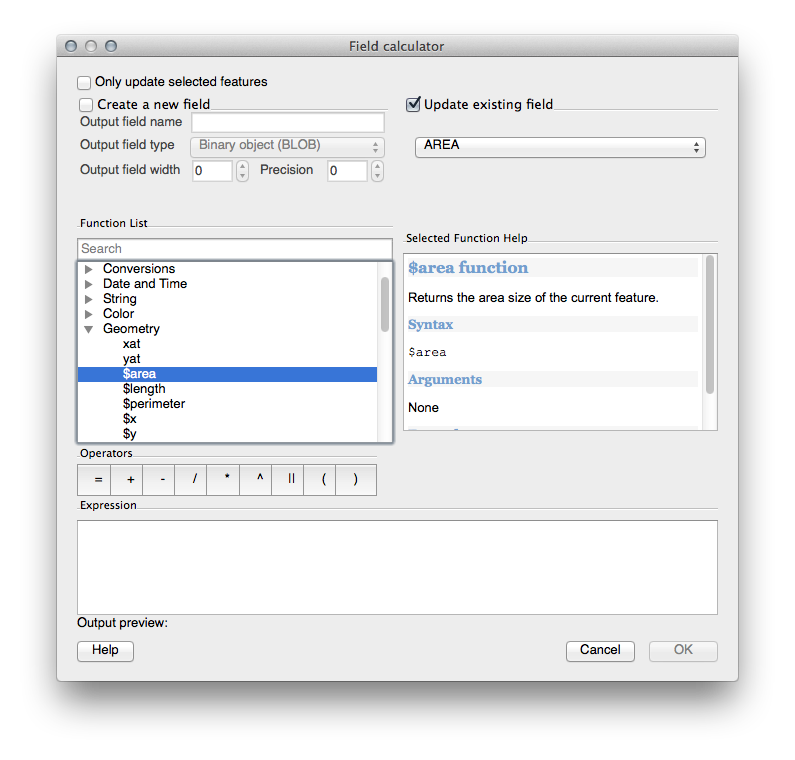
Dublu-clic pe el, astfel încât acesta va apărea în câmpul Expresiei.
Clic pe OK
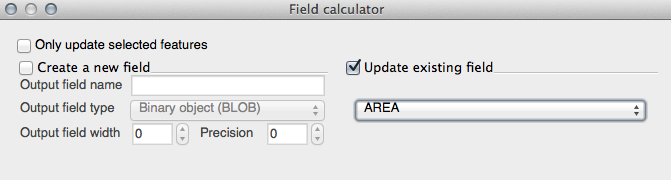
Now your AREA field is populated with values (you may need to click the
column header to refresh the data). Save the edits and click Ok.
Note
Aceste zone sunt în grade. Mai târziu, le vom calcula în metri pătrați.
Deschideți fila Style din dialogul Proprietăților Stratului.
Schimbați stilul de clasificare din Categorisit în Gradat.
Schimbați Coloana în AREA:
Sub Color ramp, alegeți opțiunea New color ramp... pentru a obține acest dialog:
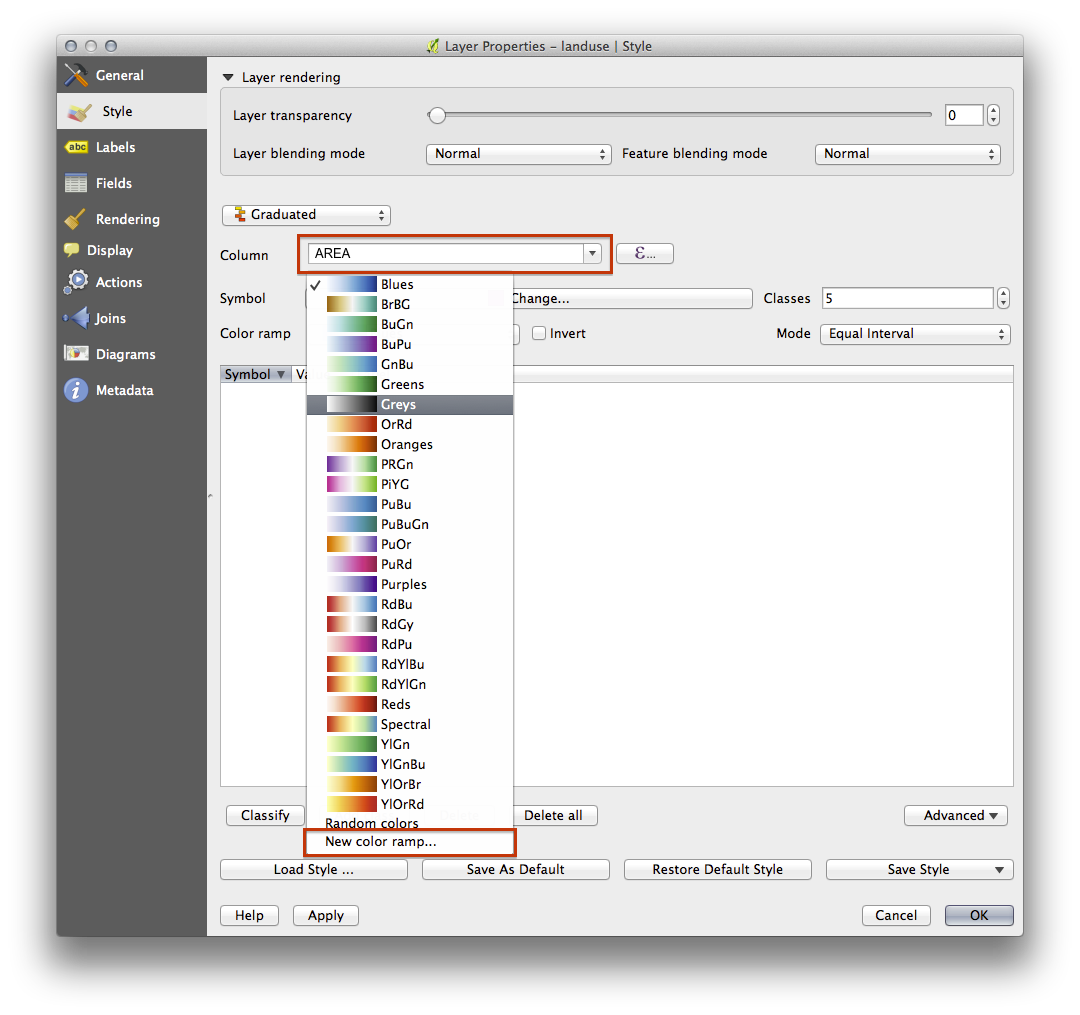
Alegeți Gradient (dacă nu este selectat deja) apoi faceți clic pe OK. Veți vedea următoarele:
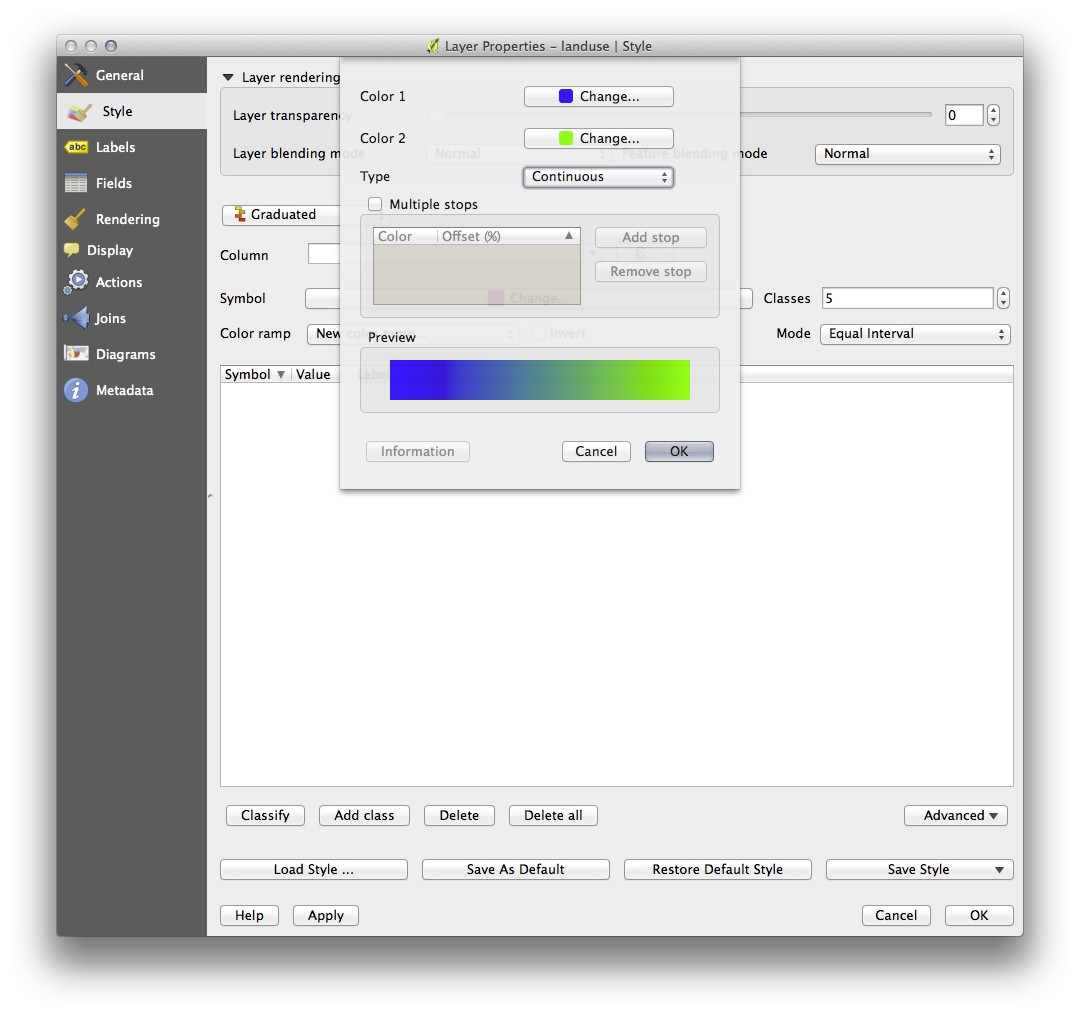
You’ll be using this to denote area, with small areas as Color 1 and large areas as Color 2.
Alegeți culori adecvate.
În acest exemplu, rezultatul arată în felul următor:

Clic pe OK
Alegeți un nume potrivit pentru noul interval de culoare.
Clic pe OK, după ce ați completat numele.
Veți vedea ceva de genul următor:
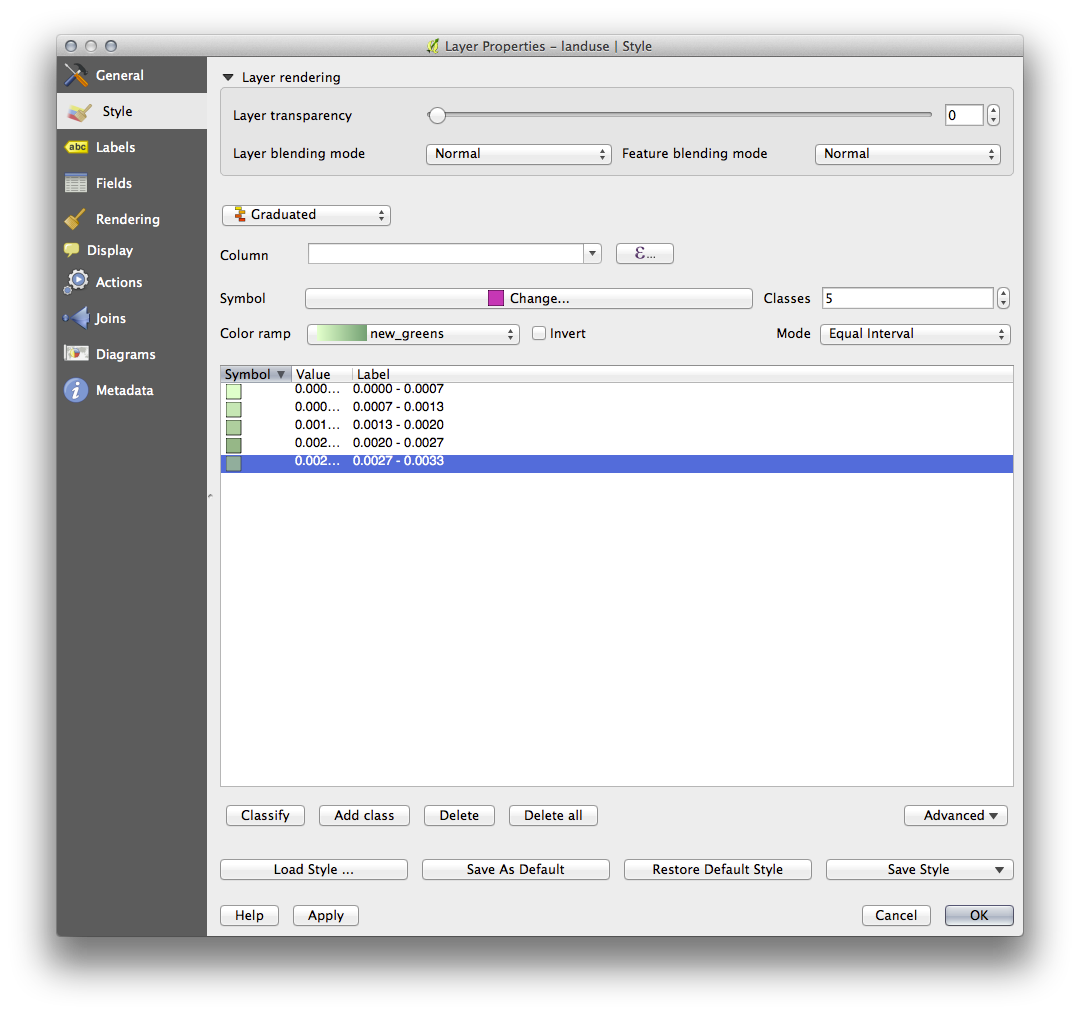
Lăsați totul așa cum este.
Clic pe OK:
4.3.4. Try Yourself Rafinarea Clasificării
Scăpați de liniile dintre clase.
- Change the values of Mode and Classes until you get a classification that makes sense.
4.3.5.  Follow Along: Clasificarea Bazată pe Reguli
It’s often useful to combine multiple criteria for a classification, but unfortunately normal classification only takes one attribute into account. That’s where rule-based classification comes in handy.
Deschideți dialogul Proprietăților Stratului pentru stratul landuse.
Mergeți la fila Stil tab.
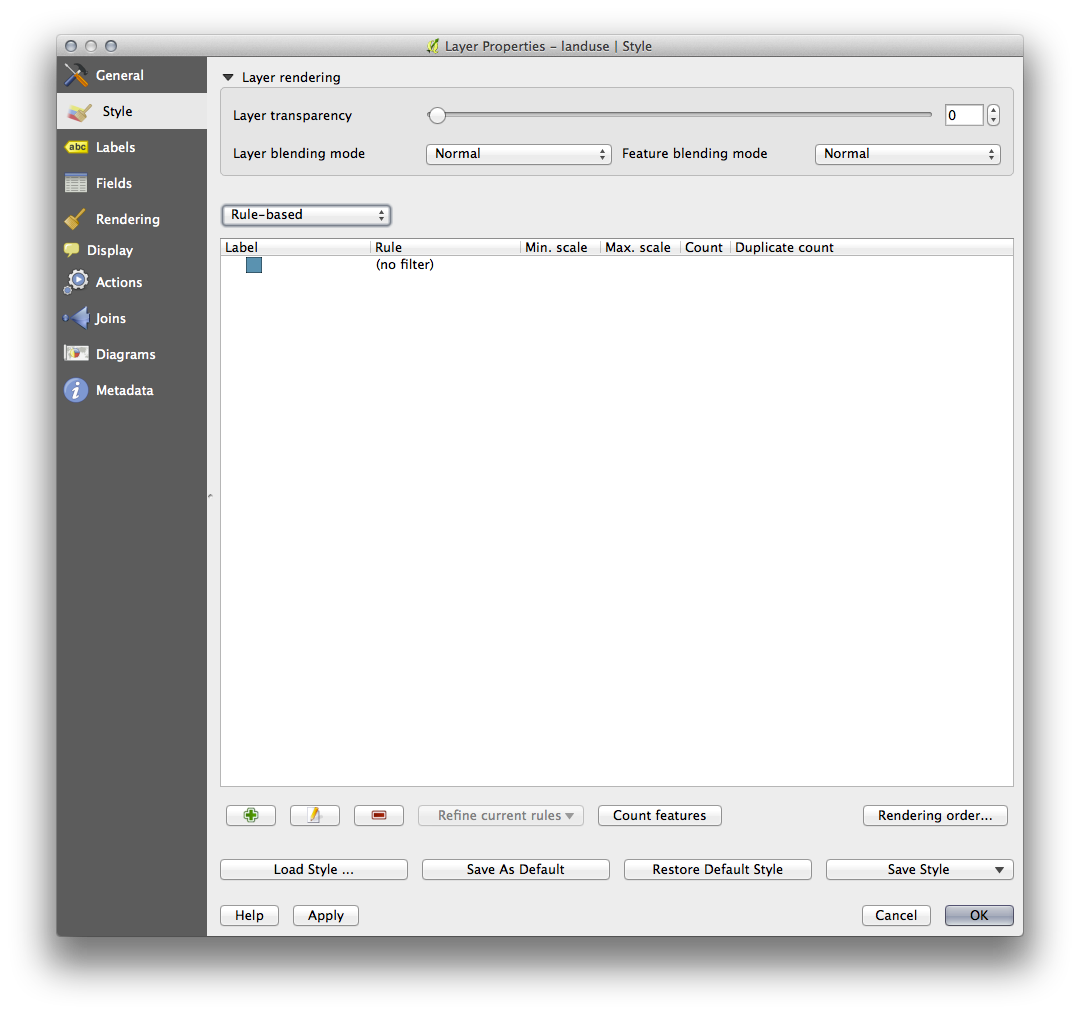
Schimbați stilul de clasificare pe Bazat pe reguli. Veți obține așa ceva:
- Click the Add rule button:
 .
. Va apărea un nou dialog.
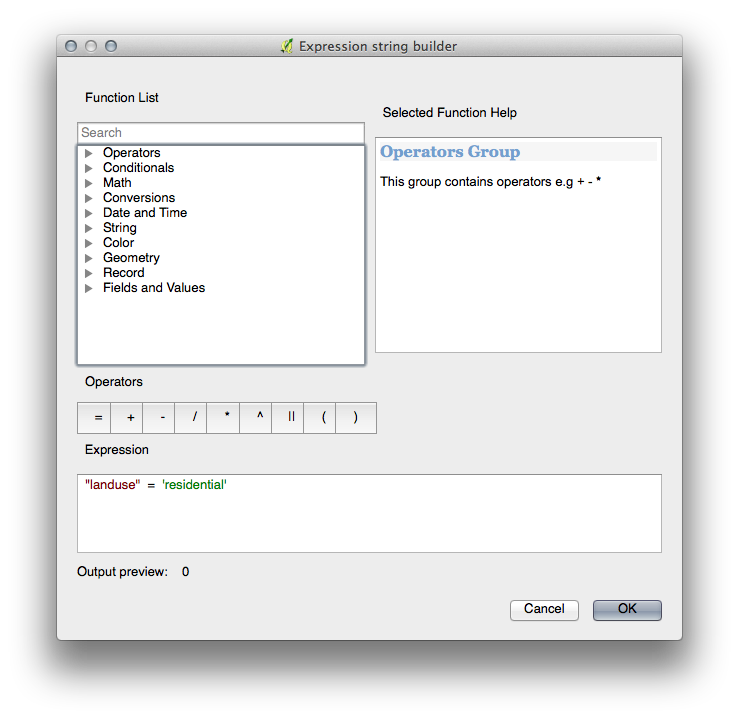
Clic pe butonul cu cele trei puncte ..., de lângă textul Filter.
- Using the query builder that appears, enter the criterion
"landuse" = 'residential' AND "name" != ' |majorUrbanName| ', click Ok and choose a pale blue-grey for it and remove the border:
- Add a new criterion
"landuse" != 'residential' AND AREA >= 0.00005and choose a mid-green color. - Add another new criterion
"name" = ' |majorUrbanName| 'and assign it a darker grey-blue color in order to indicate the town’s importance in the region. Faceți clic și glisați acest criteriu în partea de sus a listei.
These filters are exclusive, in that they collectively exclude some areas on the map (i.e. those which are smaller that 0.00005, are not residential and are not ‘Swellendam‘). This means that the excluded polygons take the style of the default (no filter) category.
We know that the excluded polygons on our map cannot be residential areas, so give the default category a suitable pale green color.
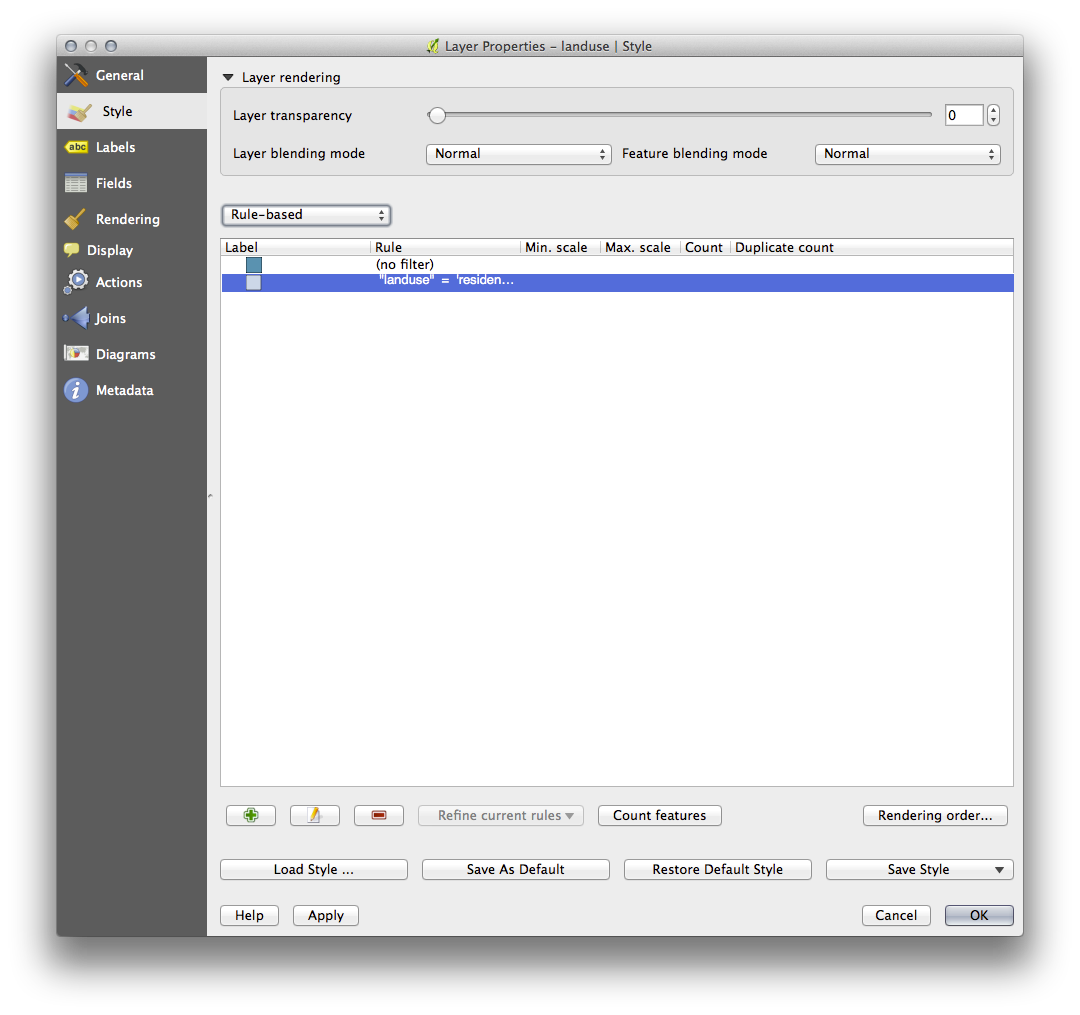
Dialogul dvs. ar trebui să arate astfel:

Aplicați această simbologie.
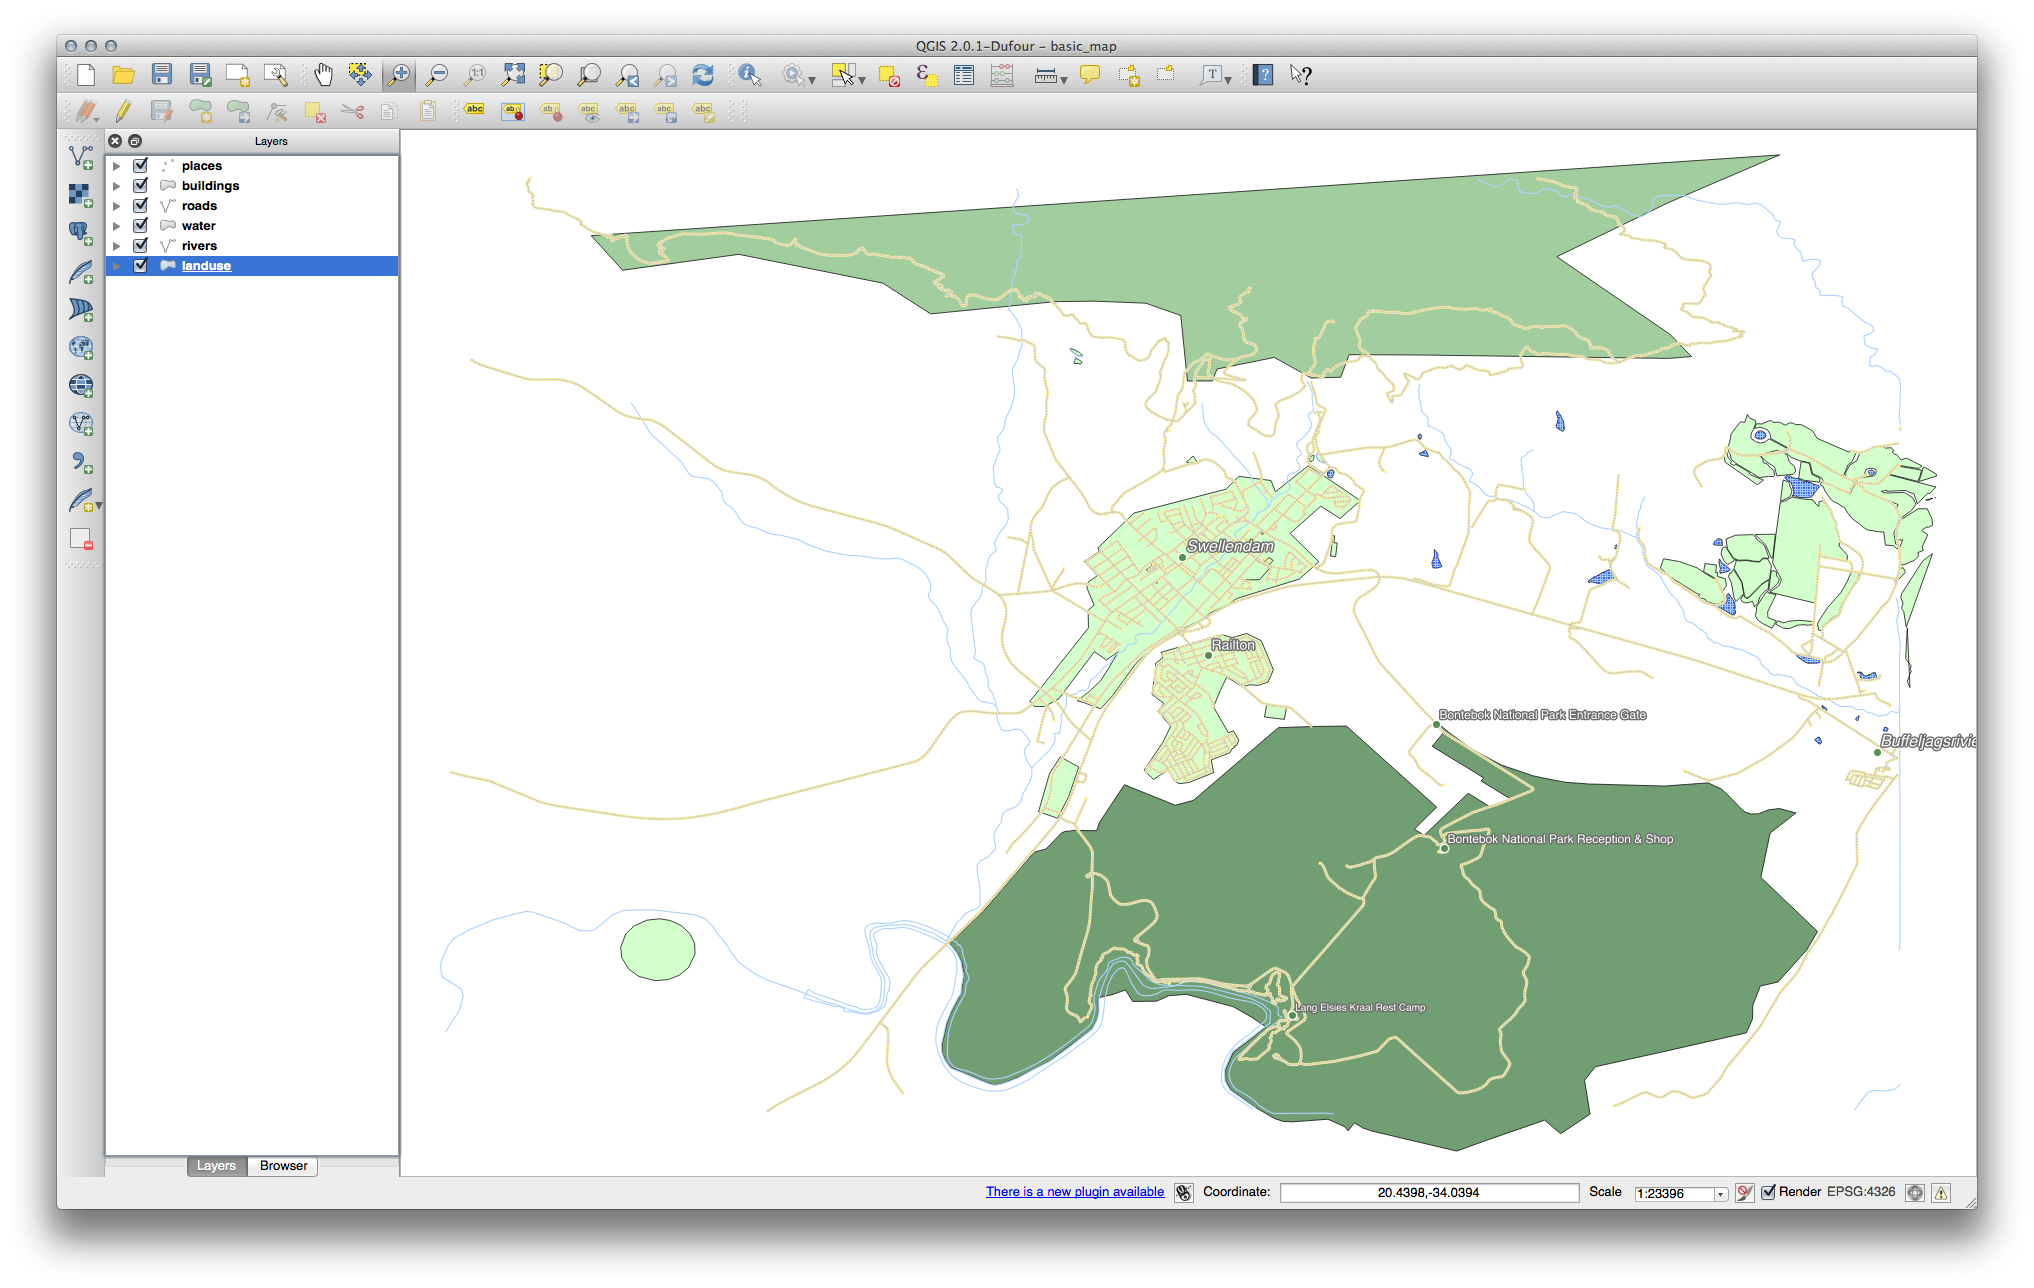
Harta dvs. va arăta în felul următor:
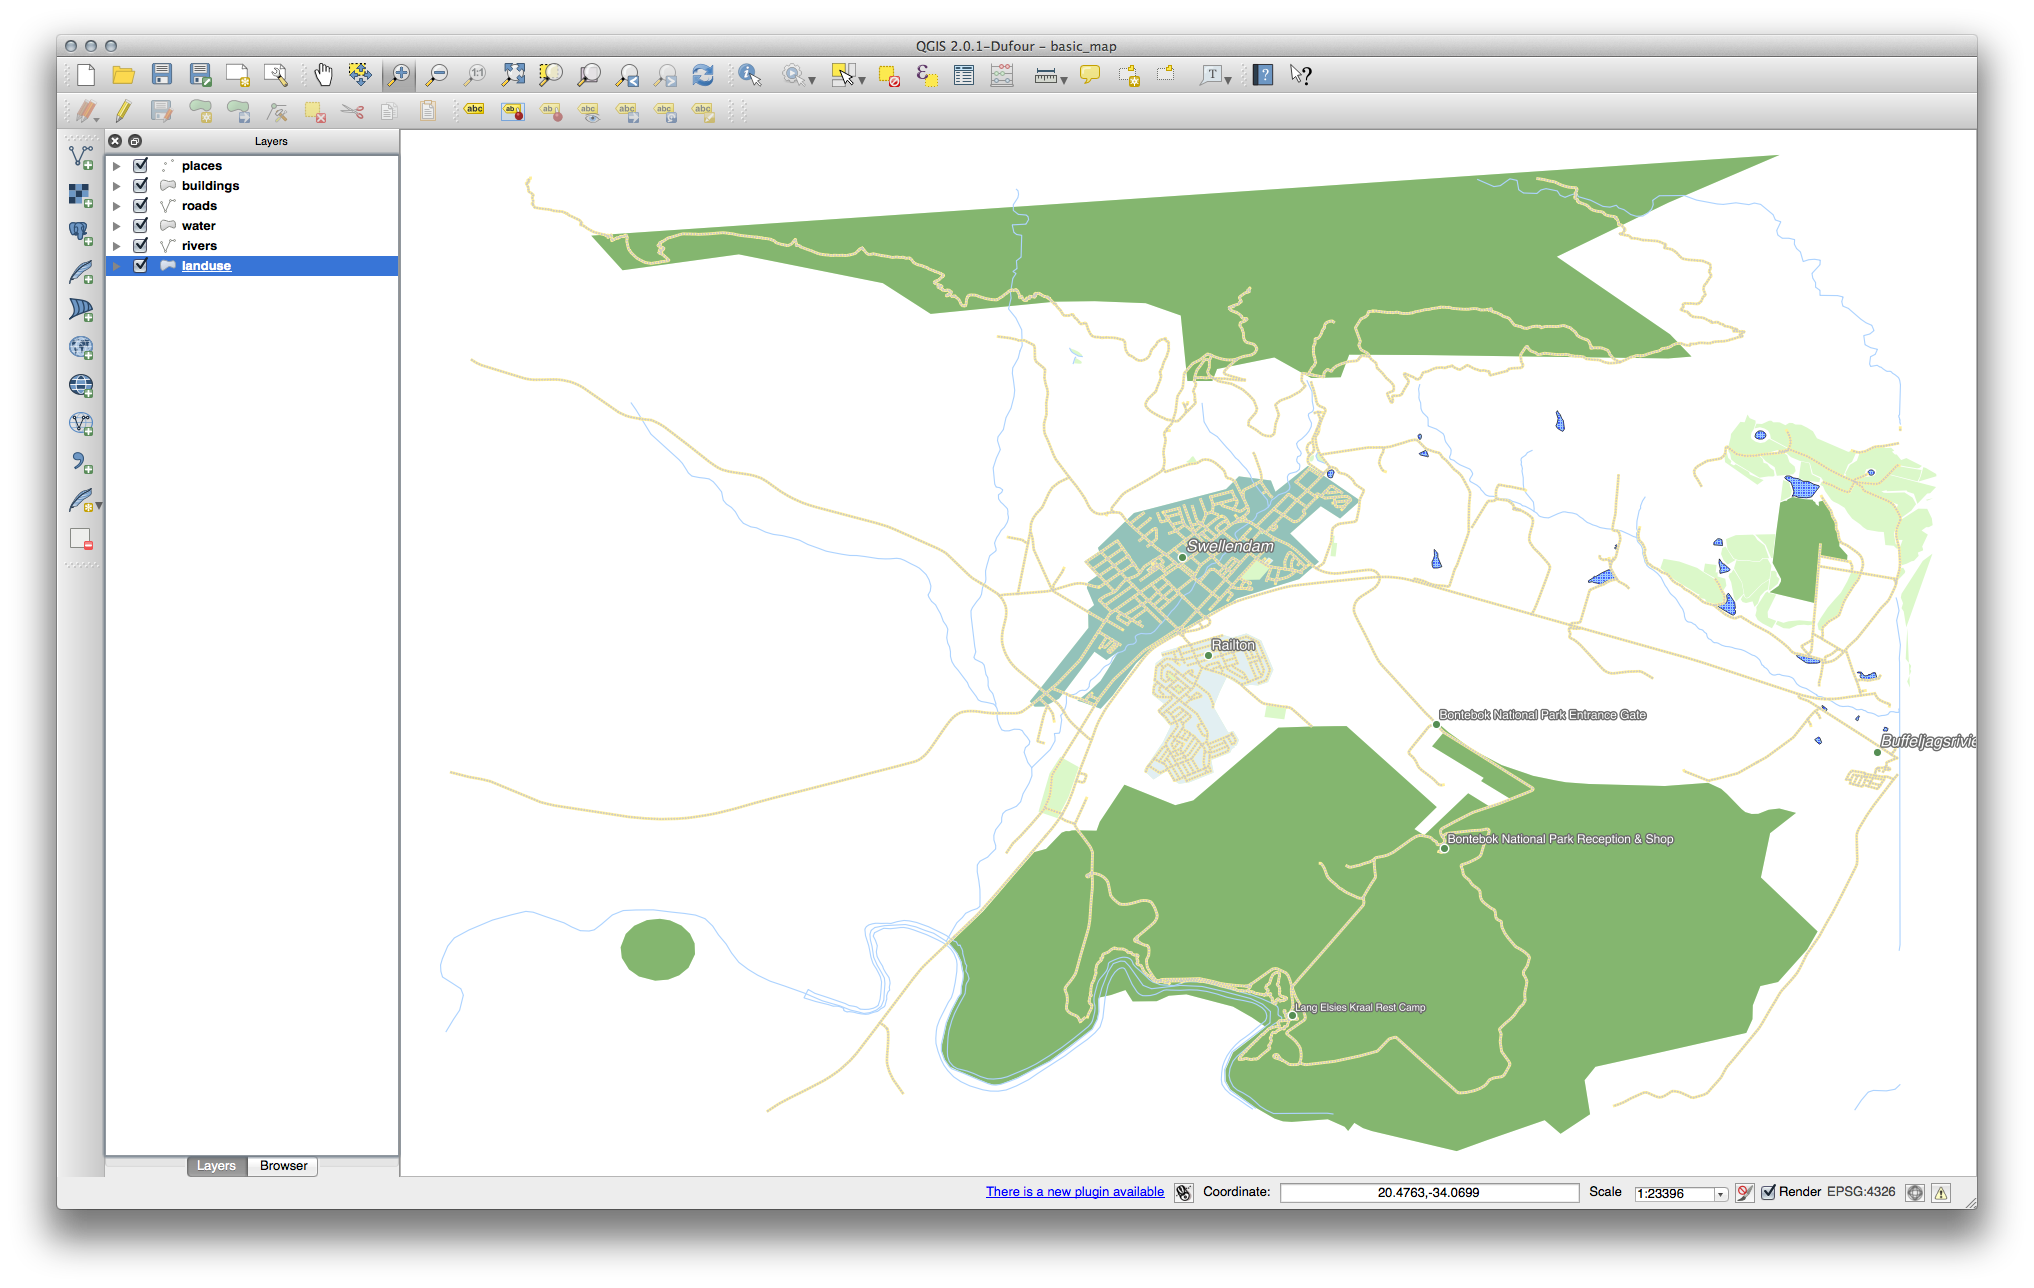
Now you have a map with Swellendam the most prominent residential area and other non-residential areas colored according to their size.
4.3.6. In Conclusion
Symbology allows us to represent the attributes of a layer in an easy-to-read way. It allows us as well as the map reader to understand the significance of features, using any relevant attributes that we choose. Depending on the problems you face, you’ll apply different classification techniques to solve them.
4.3.7. What’s Next?
Now we have a nice-looking map, but how are we going to get it out of QGIS and into a format we can print out, or make into an image or PDF? That’s the topic of the next lesson!