14.3. Lesson: Digitizarea Pâlcurilor de Pădure
Unless you are going to use your georeferenced map as a simple background image, the next natural step is to digitize elements from it. You have already done so in the exercises about creating vector data in Lesson: Crearea unui Nou Set de Date Vectoriale , when you digitized the school fields. In this lesson, you are going to digitize the forest stands’ borders that appear in the map as green lines but instead of doing it using an aerial image, you will use your georeferenced map.
Scopul acestei lecții: Învățarea unei tehnici pentru a ajuta activitatea de digitizare a pâlcurilor forestiere și, în cele din urmă, adunarea datelor de inventar în acestea.
14.3.1.  Follow Along: Extragerea Limitelor pentru Pâlcurile Pădurilor
Deschideți în QGIS proiectul map_digitizing.qgs, pe care l-ați salvat în lecția anterioară.
Once you have scanned and georeferenced your map you could start to digitize directly by looking at the image as a guide. That would most likely be the way to go if the image you are going to digitize from is, for example, an aerial photograph.
If what you are using to digitize is a good map, as it is in our case, it is likely that the information is clearly displayed as lines with different colors for each type of element. Those colors can be relatively easy extracted as individual images using an image processing software like GIMP. Such separate images can be used to assist the digitizing, as you will see below.
Primul pas va fi de a utiliza GIMP la obținerea unei imagini care conține doar pâlcuri de pădure, reprezentate de toate acele linii verzui pe care le puteți vedea în harta originală, scanată:
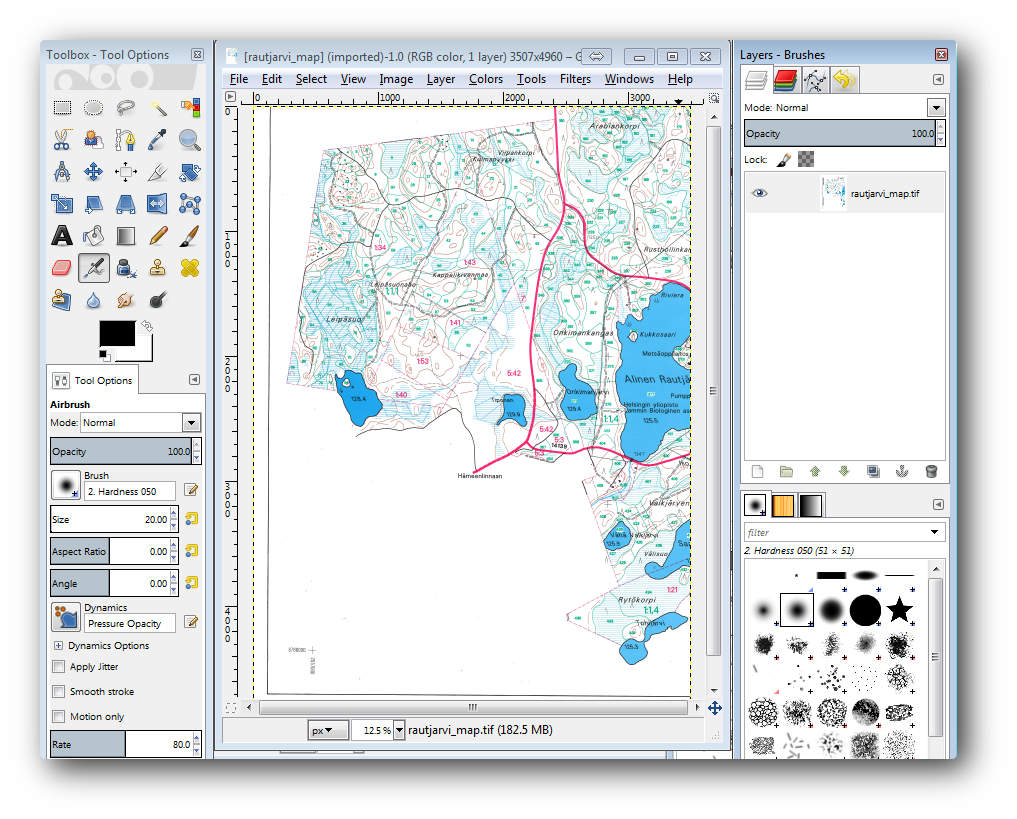
Deschideți GIMP (dacă nu l-ați instalat încă, descărcați-l de pe internet sau cereți-l profesorului dvs.).
- Open the original map image, File ‣ Open,
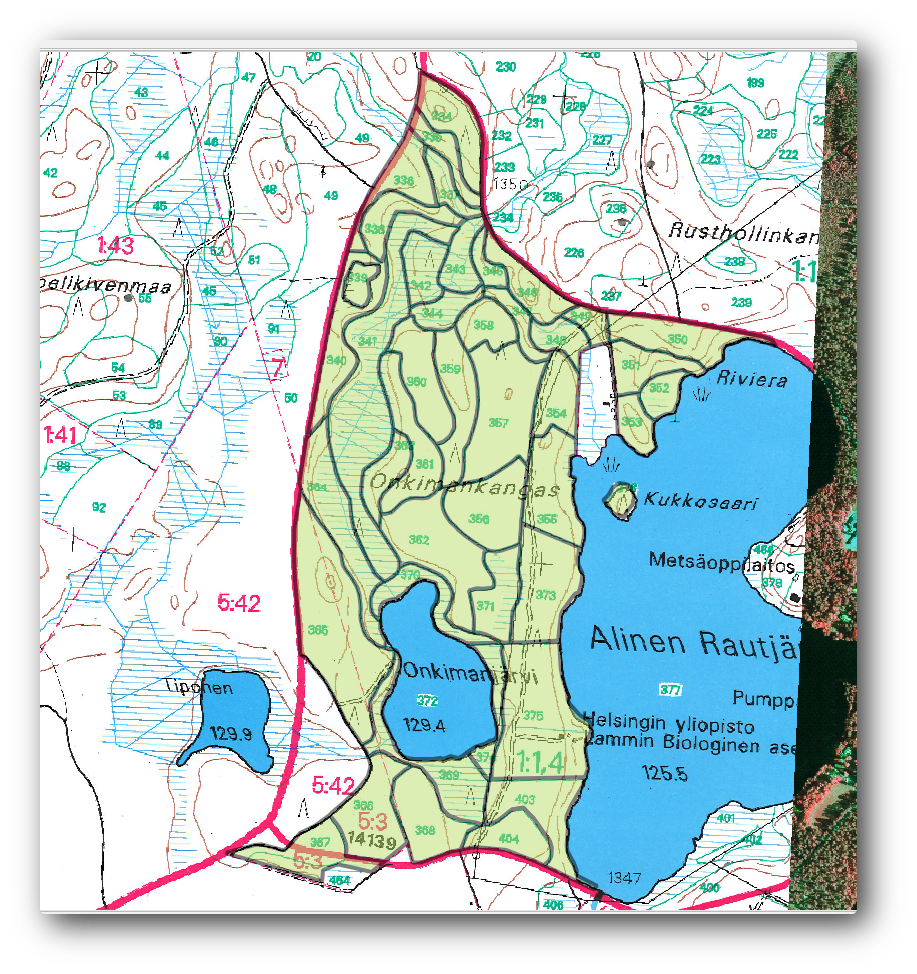
rautjarvi_map.tifin theexercise_data/forestryfolder. Note that the forest stands are represented as green lines (with the number of the stand also in green inside each polygon).
Acum puteți selecta pixelii din imagine, care reprezintă granițele pâlcurilor forestiere (pixelii verzui):
Deschideți instrumentul Select ‣ By color.
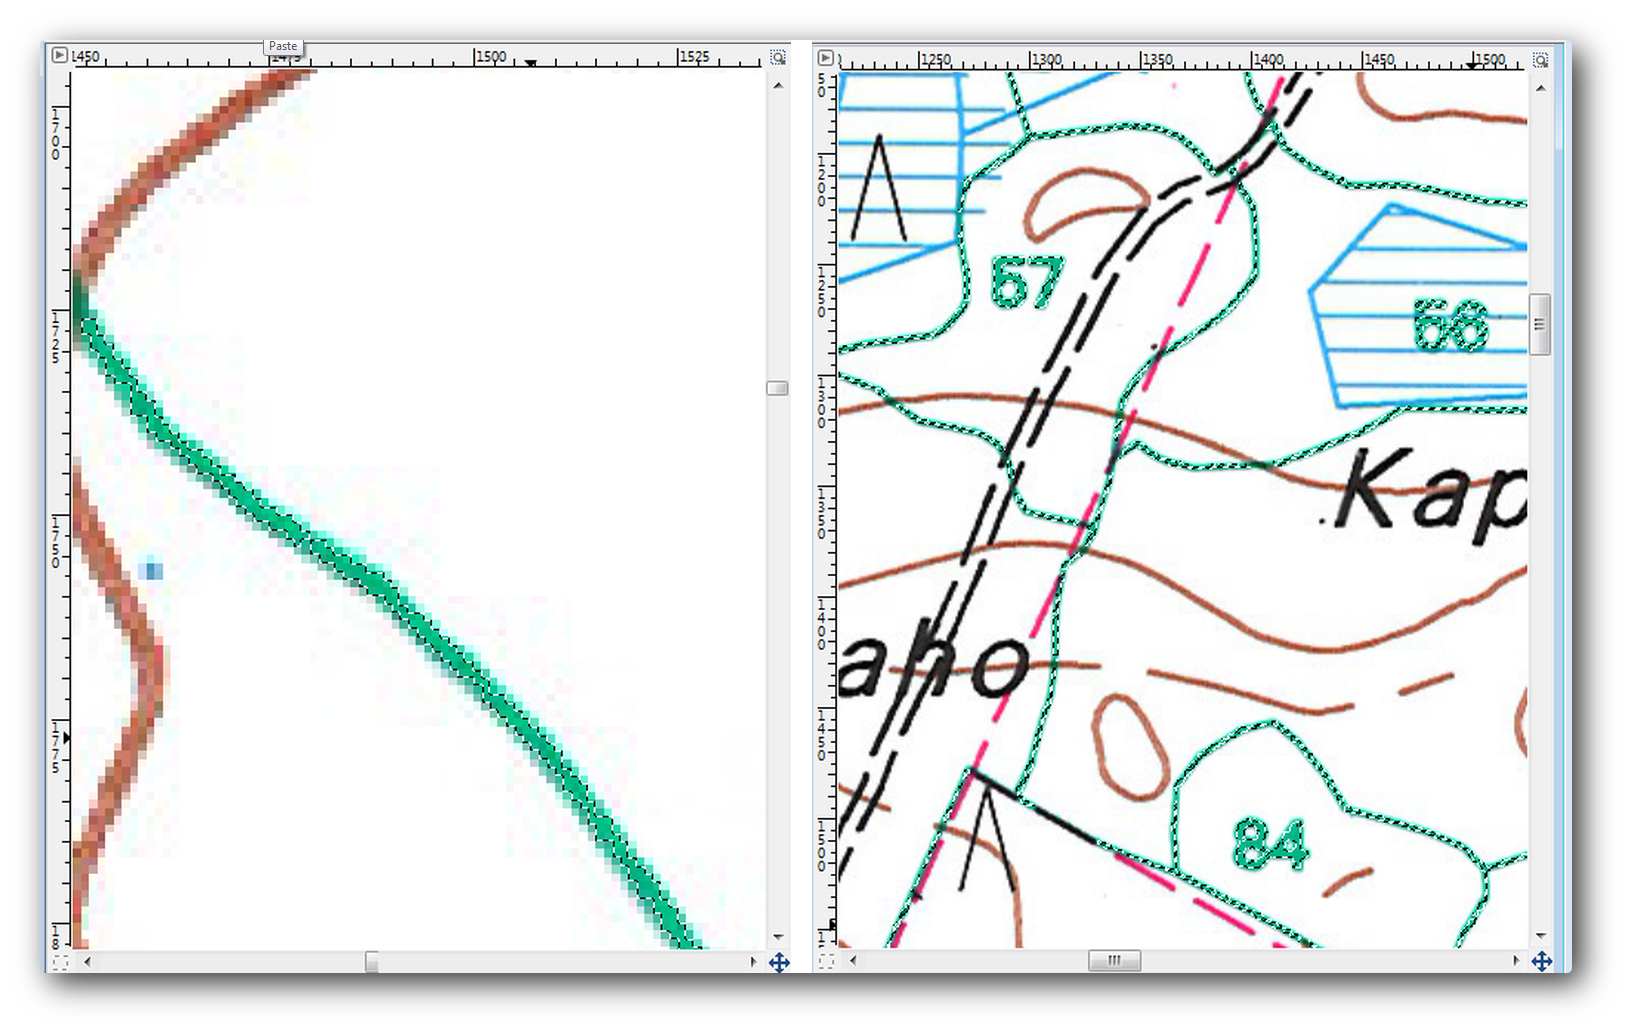
- With the tool active, zoom into the image (Ctrl + mouse wheel) so that a forest stand line is close enough to differentiate the pixels forming the line. See the left image below.
Faceți clic și glisați cursorul mouse-ului în partea din mijloc a liniei, astfel încât instrumentul va colecta valorile câtorva dintre culorile pixelilor.
- Release the mouse click and wait a few seconds. The pixels matching the colors collected by the tool will be selected through the whole image.
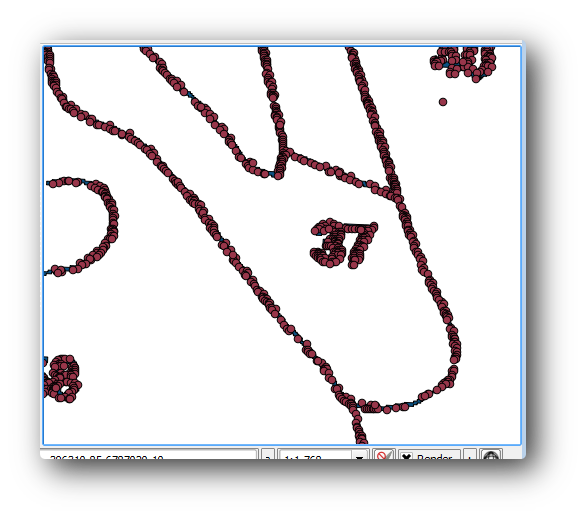
Micșorați, pentru a vedea cum au fost selectați pixelii verzui din întreaga imagine.
Dacă nu sunteți mulțumiți de rezultat, repetați operațiunea de clic și glisare.
Selecția dumneavoastră de pixeli ar trebui să arate în genul imaginii din dreapta-jos.
Once you are done with the selection you need to copy this selection as a new layer and then save it as separate image file:
Copiați (Ctr+C) pixelii selectați.
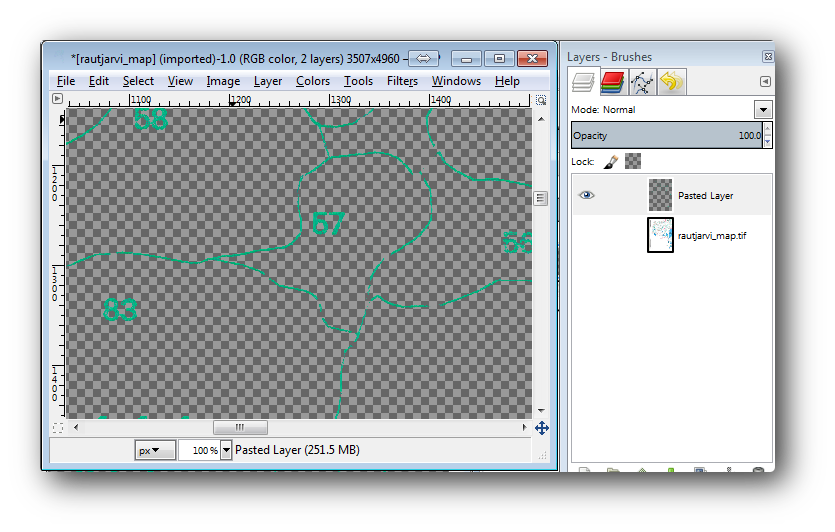
- And paste the pixels directly (Ctr+V), GIMP will display the pasted pixels as a new temporary layer in the Layers - Brushes panel as a Floating Selection (Pasted Layer).
Faceți clic dreapta pe stratul temporar și selectați Către Noul Strat.
- Click the “eye” icon next to the original image layer to switch it off, so that only the Pasted Layer is visible:
- Finally, select File ‣ Export..., set Select File Type (By Extension) as a TIFF image, select the
digitizingfolder and name itrautjarvi_map_green.tif. Select no compression when asked.
You could do the same process with other elements in the image, for example extracting the black lines that represent roads or the brown ones that represent the terrain’ contour lines. But for us, the forest stands is enough.
14.3.2. Try Yourself Georeferențiați Imaginea Pixelilor Verzi
As you did in the previous lesson, you need to georeference this new image to be able to use it with the rest of your data.
Note that you don’t need to digitize the ground control points any more because this image is basically the same image as the original map image, as far as the Georeferencer tool is concerned. Here are some things you should remember:
Această imagine este, de asemenea, în CRS-ul
KKJ / Finland zone 2.Ar trebui să utilizați punctele de control de la sol salvate, File ‣ Load GCP points.
Amintiți-vă să revizuiți Setările de Transformare.
Denumiți stratul de ieșire
green_centroids.shp, din folderuldigitizing.
Verificați dacă noul raster se potrivește bine cu harta originală.
14.3.3. Follow Along: Crearea Punctelor Suport pentru Digitizare.
Having in mind the digitizing tools in QGIS, you might already be thinking that it would be helpful to snap to those green pixels while digitizing. That is precisely what you are going to do next create points from those pixels to use them later to help you follow the forest stands’ borders when digitizing, by using the snapping tools available in QGIS.
- Use the Raster ‣ Conversion ‣ Polygonize (Raster to Vector) tool to vectorize your green lines to polygons. If you don’t remember how, you can review it in Lesson: Conversia din Raster în Vector.
Salvați-l ca
rautjarvi_green_polygon.shp, în interiorul folderuluidigitizing.
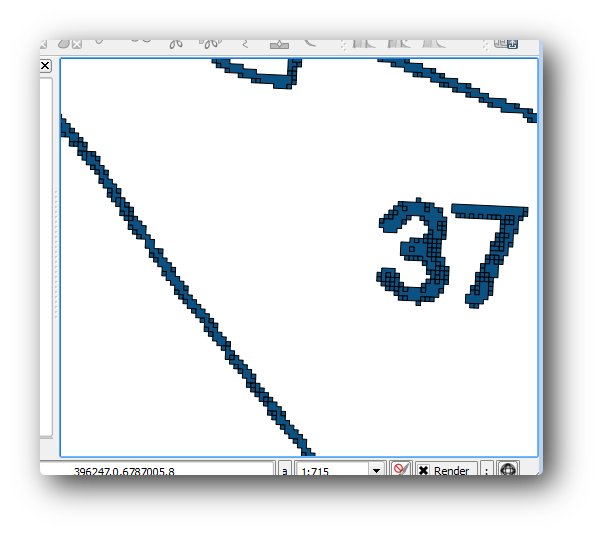
Măriți și analizați forma poligoanelor. Veți obține ceva de genul:
Următoarea opțiune de a scoate punctele din acele poligoane, este de a le obține centroizii:
Deschideți Vector ‣ Geometry tools ‣ Polygon centroids.
Setați stratul poligonal pe care tocmai l-ați obținut, ca fișier de intrare pentru instrument.
Denumiți rezultatul ca
green_centroids.shp, în folderuldigitizing.Bifați Add result to canvas.
Folosiți instrumentul pentru a calcula centroizii poligoanelor.
Acum puteți elimina stratul rautjarvi_green_polygon din TOC.
Schimbați simbologia stratului centroizilor:
Deschideți Proprietățile Stratului pentru green_centroids.
Mergeți la fila Stil tab.
Setați Unitățile ca Unități de hartă.
Setați Dimensiunea la 1.
It is not necessary to differentiate points from each other, you just need them to be there for the snapping tools to use them. You can use those points now to follow the original lines much easily than without them.
14.3.4. Follow Along: Digitizarea Pâlcurilor de Pădure
Now you are ready to start with the actual digitizing work. You would start by creating a vector file of polygon type, but for this exercise, there is a shapefile with part of the area of interest already digitized. You will just finish digitizing the half of the forest stands that are left between the main roads (wide pink lines) and the lake:

Mergeți la folderul
digitizarefolosind exploratorul dvs. de fișiere.Glisați fișierul vectorial pe harta dvs.
forest_stands.shp.
Schimbați simbologia noului strat, astfel încât să puteți identifica mai ușor ce poligoane au fost deja digitizate:
Umpleți poligonul cu verde.
Bordura poligonului va fi de 1 mm.
Setați transparența la 50%.
Acum, așa cum vă amintiți de la modulele din trecut, trebuie să configurați și activați opțiunile de acroșare:
Mergeți la Settings ‣ Snapping options....
Activați acroșarea straturilor
green_centroidsșiforest_stands.Setați Toleranța la 5 unități de hartă.
Bifați caseta Avoid Int., pentru stratul
forest_stands.Bifați Enable topological editing.
Clic pe Aplicare.

With these snapping settings, whenever you are digitizing and get close enough to one of the points in the centroids layer or any vertex of your digitized polygons, a pink cross will appear on the point that will be snapped to.
Finally, turn off the visibility of all the layers except forest_stands and rautjarvi_georef. Make sure that the map image has not transparency any more.
Câteva lucruri importante de reținut, înainte de a începe digitizarea:
Nu încercați să fiți prea exacți în digitizarea frontierelor.
- If a border is a straight line, digitize it with just two nodes. In general, digitize using as few nodes as possible.
- Zoom in to close ranges only if you feel that you need to be accurate, for example, at some corners or when you want a polygon to connect with another polygon at a certain node.
Folosiți butonul din mijloc al mouse-ului pentru a mări/micșora și deplasa, pe durata digitizării.
Digitizați doar un singur poligon la un moment dat.
După digitizarea unui poligon, scrieți id-ul pâlcului de pădure pe care îl puteți vedea în hartă.
Acum puteți începe digitizarea:
Localizați numărul pâlcului forestier 357 în fereastra hărții.
Activați editarea pentru stratul
forest_stands.shp.Selectați instrumentul Add feature.
Începeți digitizarea pâlcului
357prin conectarea unora dintre puncte.Notați crucilițele roz care indică acroșarea.
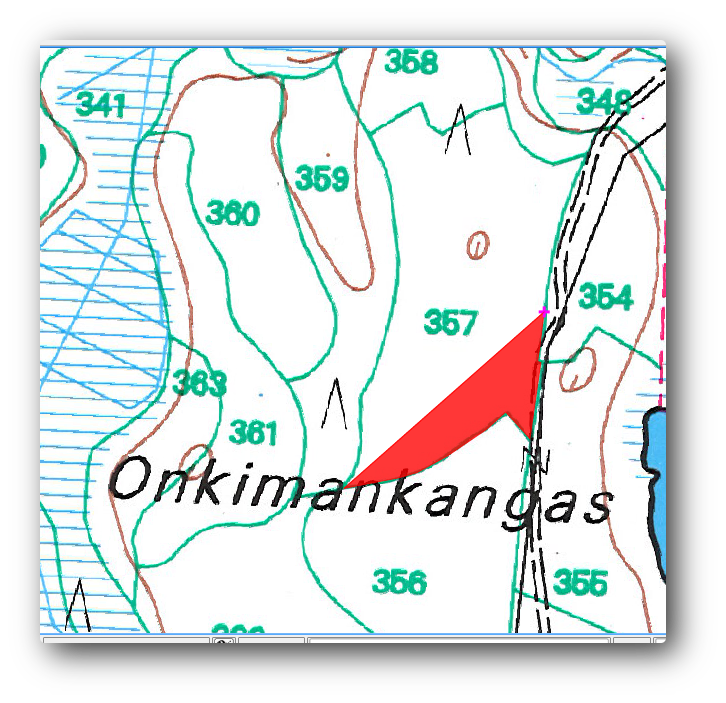
Când ați terminat, faceți clic-dreapta pentru a termina digitizarea acelui poligon.
Introduceți pâlcul forestier
id(în acest caz 357).Clic pe OK
If you were not prompted for the polygon id when you finished digitizing it, go to Settings ‣ Options ‣ Digitizing and make sure that the Suppress attribute form pop-up after feature creation is not checked.
Poligonul dvs. digitizat va arăta astfel:
Now for the second polygon, pick up the stand number 358. Make sure that the Avoid int. is checked for the forest_stands layer. This option does not allow intersecting polygons at digitizing, so that if you digitize over an existing polygon, the new polygon will be trimmed to meet the border of the already existing polygons. You can use this characteristic to automatically obtain a common border.
Începeți digitizarea standului 358 la unul dintre colțurile comune cu pâlcul 357.
Apoi continuați în mod normal, până când ajungeți la celălalt colț comun cu ambele pâlcuri.
- Finally, digitize a few points inside polygon 357 making sure that the common border is not intersected. See left image below.
Clic-dreapta pentru a termina editarea pâlcului de pădure 358.
Introduceți 358 ca și
id.- Click OK, your new polygon should show a common border with the stand 357 as you can seen in the image on the right.
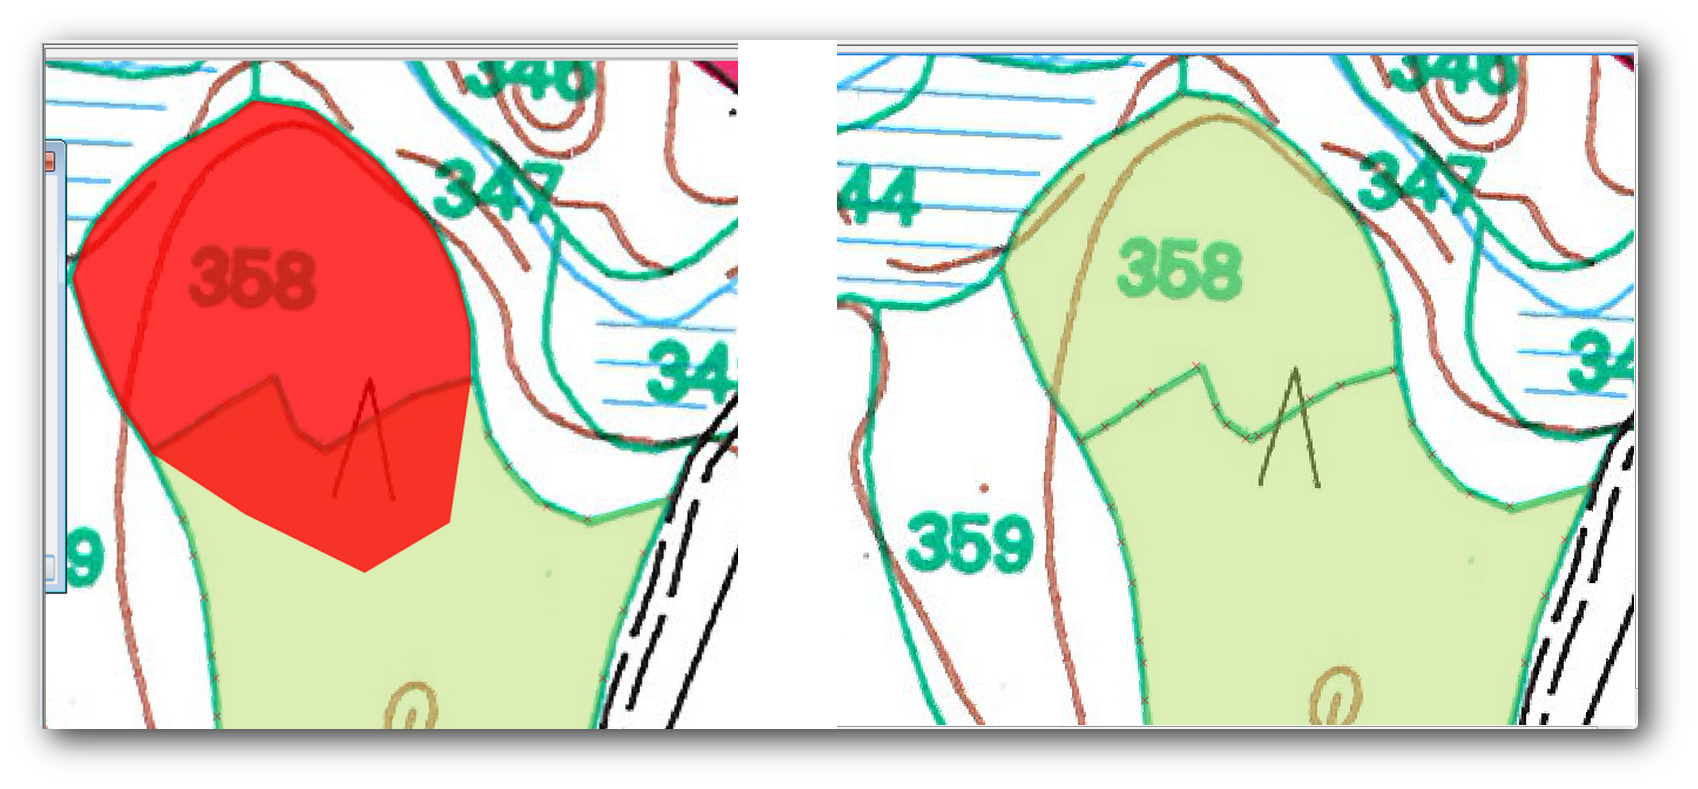
The part of the polygon that was overlapping the existing polygon has been automatically trimmed out and you are left with a common border, as you intended it to be.
14.3.5. Try Yourself Încheierea Digitizării Pâlcurilor de Pădure
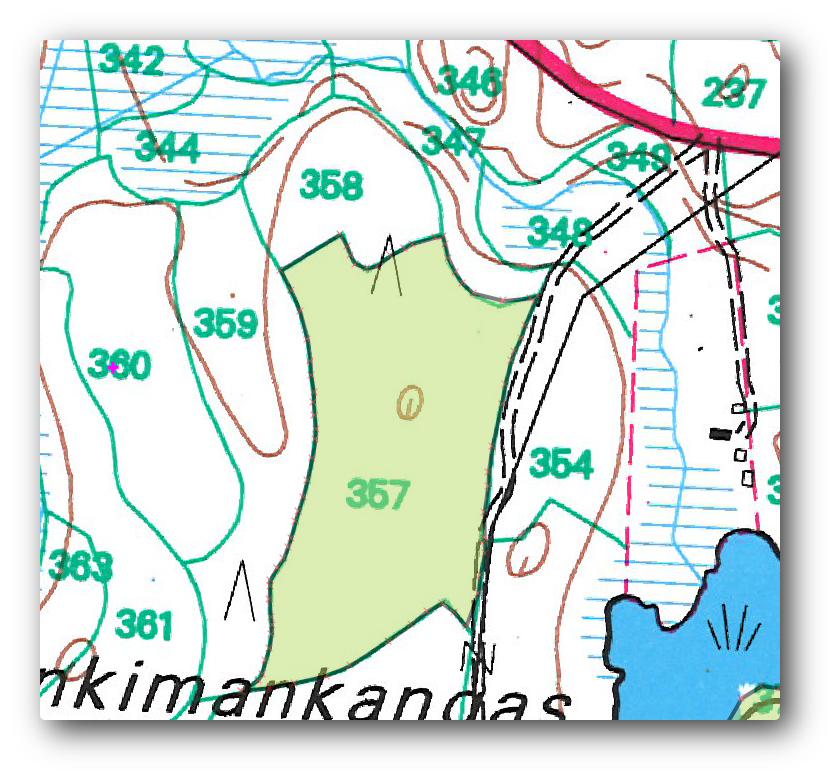
Now you have two forest stands ready. And a good idea on how to proceed. Continue digitizing on your own until you have digitized all the forest stands that are limited by the main road and the lake.
It might look like a lot of work, but you will soon get used to digitizing the forest stands. It should take you about 15 minutes.
During the digitizing you might need to edit or delete nodes, split or merge polygons. You learned about the necessary tools in Lesson: Topologia Entității, now is probably a good moment to go read about them again.
Remember that having Enable topological editing activated, allows you to move nodes common to two polygons so that the common border is edited at the same time for both polygons.
Rezultatul dvs. va arăta în felul următor:
14.3.6. Follow Along: Îmbinarea Datelor pentru Pâlcurile de Pădure
It is possible that the forest inventory data you have for you map is also written in paper. In that case, you would have to first write that data to a text file or a spreadsheet. For this exercise, the information from the inventory for 1994 (the same inventory as the map) is ready as a comma separated text (csv) file.
Open the rautjarvi_1994.csv file from the exercise_data\forestry directory in a text editor and note that the inventory data file has an attribute called ID that has the numbers of the forest stands. Those numbers are the same as the forest stands ids you have entered for your polygons and can be used to link the data from the text file to your vector file. You can see the metadata for this inventory data in the file rautjarvi_1994_legend.txt in the same folder.
- Open the
.csvin QGIS with the Layer ‣ Add Delimited Text Layer... tool. In the dialog, set it as follows:

Pentru a adăuga date din fișierul .csv:
Deschideți proprietățile pentru stratul
forest_stands.Mergeți la fila Îmbinări.
Faceți clic pe semnul plus din partea de jos a casetei de dialog.
- Select
rautjarvi_1994.csvas the Join layer andIDas the Join field. Asigurați-vă că, de asemenea, câmpul Target este setat pe
id.Faceți clic pe Ok de două ori.
The data from the text file should be now linked to your vector file. To see what has happened, open the attribute table for the forest_stands layer. You can see that all the attributes from the inventory data file are now linked to your digitized vector layer.
14.3.7. Try Yourself Redenumirea Numelor pentru Atribut, și Adăugarea Suprafeței și a Perimetrului
The data from the .csv file is just linked to your vector file. To make this link permanent, so that the data is actually recorded to the vector file you need to save the forest_stands layer as a new vector file. Close the attribute table and right click the forest_stands layer to save it as forest_stands_1994.shp.
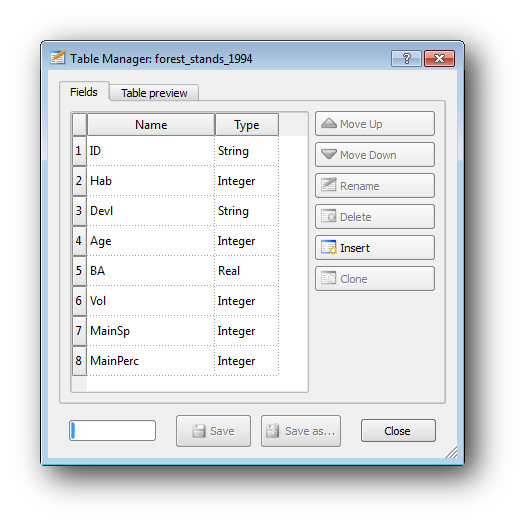
Open your new forest_stands_1994.shp in your map if you did not added yet. Then open the attribute table. You notice that the names of the columns that you just added are no very useful. To solve this:
Adăugați plugin-ul Table Manager procedând la fel ca și în cazul altor plugin-uri.
Asigurați-vă că plugin-ul este activat.
În TOC selectați stratul
forest_stands_1994.shp.Apoi, mergeți la Vector ‣ Table Manager ‣ Table manager.
Utilizați caseta de dialog pentru a edita numele coloanelor, în așa fel încât să se potrivească cu cele din fișierul
.csv.
Clic pe Salvare.
Selectați Yes pentru a păstra stilul stratului.
Închideți dialogul Table Manager.
To finish gathering the information related to these forest stands, you might calculate the area and the perimeter of the stands. You calculated areas for polygons in Lesson: Exercițiu Suplimentar. Go back to that lesson if you need to and calculate the areas for the forest stands, name the new attribute Area and make sure that the values calculated are in hectares.
Now your forest_stands_1994.shp layer is ready and packed with all the available information.
Save your project to keep the current map presentation in case you need to come back later to it.
14.3.8. In Conclusion
It has taken a few clicks of the mouse but you now have your old inventory data in digital format and ready for use in QGIS.
14.3.9. What’s Next?
You could start doing different analysis with your brand new dataset, but you might be more interested in performing analysis in a dataset more up to date. The topic of the next lesson will be the creation of forest stands using current aerial photos and the addition of some relevant information to your dataset.