ベクタ空間分析(バッファ)
 |
目的: |
ベクタ空間分析におけるバッファ利用の理解 |
キーワード: |
ベクタ、バッファゾーン、空間分析、バッファ距離、境界のディゾルブ、内側方向および外側方向のバッファ、複数のバッファ |
概要
Spatial analysis uses spatial information to extract new and additional meaning from GIS data. Usually spatial analysis is carried out using a GIS Application. GIS Applications normally have spatial analysis tools for feature statistics (e.g. how many vertices make up this polyline?) or geoprocessing such as feature buffering. The types of spatial analysis that are used vary according to subject areas. People working in water management and research (hydrology) will most likely be interested in analysing terrain and modelling water as it moves across it. In wildlife management users are interested in analytical functions that deal with wildlife point locations and their relationship to the environment. In this topic we will discuss buffering as an example of a useful spatial analysis that can be carried out with vector data.
バッファリングの詳細
**バッファリング**は通常2つのエリアを作成します:1つは **内部に含まれる**で選択した現実世界の地物との距離を示し、もう1つは **離れている**です。特定の距離以内のエリアを**バッファゾーン**といいます。
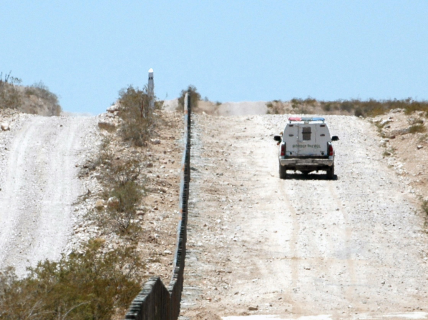
A buffer zone is any area that serves the purpose of keeping real world features distant from one another. Buffer zones are often set up to protect the environment, protect residential and commercial zones from industrial accidents or natural disasters, or to prevent violence. Common types of buffer zones may be greenbelts between residential and commercial areas, border zones between countries (see figure_buffer_zone), noise protection zones around airports, or pollution protection zones along rivers.
Figure Buffer Zone 1:
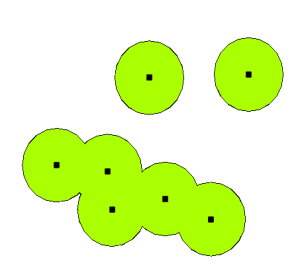
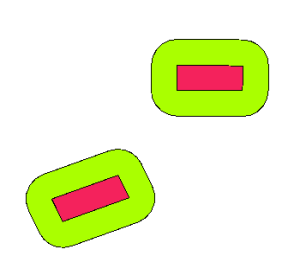
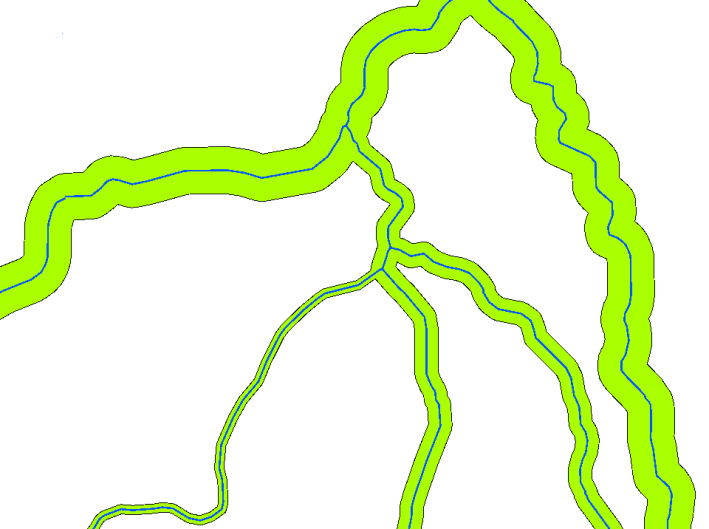
GISアプリケーションでは、**バッファゾーンエリア**は他のポリゴン、ラインまたは他の点地物を包含するような**ベクタポリゴン**に代表されます( figure_point_buffer, figure_line_buffer を参照 )。
Figure Point Buffer 1:
Figure Line Buffer 1:
Figure Polygon Buffer 1:
バッファの種類
There are several variations in buffering. The buffer distance or buffer size can vary according to numerical values provided in the vector layer attribute table for each feature. The numerical values have to be defined in map units according to the Coordinate Reference System (CRS) used with the data. For example, the width of a buffer zone along the banks of a river can vary depending on the intensity of the adjacent land use. For intensive cultivation the buffer distance may be bigger than for organic farming (see Figure figure_variable_buffer and Table table_buffer_attributes).
Figure Variable Buffer 1:
河川 |
隣接する土地利用 |
バッファ距離(メートル) |
|---|---|---|
ブリード川 |
集中的な野菜耕作 |
100 |
コマティ |
集中的な綿の耕作 |
150 |
オラニエ |
有機農業 |
50 |
テレ川 |
有機農業 |
50 |
Table Buffer Attributes 1: Attribute table with different buffer distances to rivers based on information about the adjacent land use.
Buffers around polyline features, such as rivers or roads, do not have to be on both sides of the lines. They can be on either the left side or the right side of the line feature. In these cases the left or right side is determined by the direction from the starting point to the end point of line during digitising.
複数のバッファゾーン
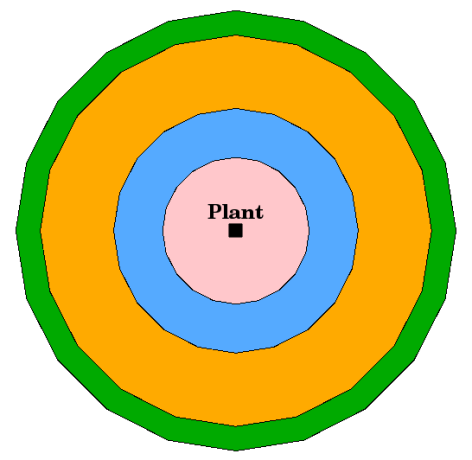
A feature can also have more than one buffer zone. A nuclear power plant may be buffered with distances of 10, 15, 25 and 30 km, thus forming multiple rings around the plant as part of an evacuation plan (see figure_multiple_buffers).
Figure Multiple Buffers 1:
そのまままたはディゾルブされた境界でのバッファリング
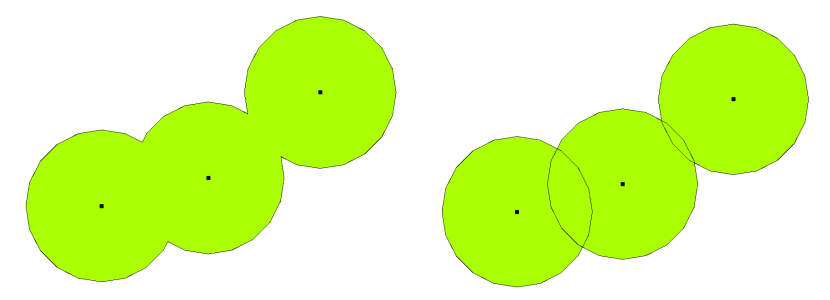
Buffer zones often have dissolved boundaries so that there are no overlapping areas between the buffer zones. In some cases though, it may also be useful for boundaries of buffer zones to remain intact, so that each buffer zone is a separate polygon and you can identify the overlapping areas (see Figure figure_buffer_dissolve).
Figure Dissolve Buffers 1:
外側または内側へのバッファリング
Buffer zones around polygon features are usually extended outward from a polygon boundary but it is also possible to create a buffer zone inward from a polygon boundary. Say, for example, the Department of Tourism wants to plan a new road around Robben Island and environmental laws require that the road is at least 200 meters inward from the coast line. They could use an inward buffer to find the 200 m line inland and then plan their road not to go beyond that line.
一般的な問題 / 注意すべき点
Most GIS Applications offer buffer creation as an analysis tool, but the options for creating buffers can vary. For example, not all GIS Applications allow you to buffer on either the left side or the right side of a line feature, to dissolve the boundaries of buffer zones or to buffer inward from a polygon boundary.
A buffer distance always has to be defined as a whole number (integer) or a decimal number (floating point value). This value is defined in map units (meters, feet, decimal degrees) according to the Coordinate Reference System (CRS) of the vector layer.
さらなる空間分析ツール
Buffering is a an important and often used spatial analysis tool but there are many others that can be used in a GIS and explored by the user.
Spatial overlay is a process that allows you to identify the relationships between two polygon features that share all or part of the same area. The output vector layer is a combination of the input features information (see figure_overlay_operations).
Figure Overlay Operations 1:
典型的な空間オーバーレイの例:
インターセクション: 出力レイヤは重なる(交差した)レイヤのすべての領域に含まれます。
ユニオン:出力レイヤは組み合わせた2つの入力レイヤのすべての領域を含みます。
- Symmetrical difference: The output layer contains all areas of the input layers except those areas where the two layers overlap (intersect).
- Difference: The output layer contains all areas of the first input layer that do not overlap (intersect) with the second input layer.
わかりましたか?
ここでは以下のことを学びました:
**バッファゾーン**は、現実世界の地物の周りの領域を示します。
バッファゾーンは常に**ベクタポリゴン**です。
地物は**複数の**バッファゾーンを持ちえます。
バッファゾーンのサイズは**バッファ距離**によって定義されます。
バッファ距離は**整数**または**小数点**の値でなければいけません。
バッファ距離は、ベクトルレイヤ内の各地物ごとに異なることもありえます。
ポリゴンは、その境界から**内側へ**または**外側へ**バッファを作成できます。
**そのまま**または**ディゾルブ**された境界で作成されたバッファゾーン
バッファリングの他に、GISは、空間的なタスクを解決するために、通常いろいろなベクタ解析ツールを提供します。
やってみよう
ここでは人に教える際のアイデアいくつか述べていきます:
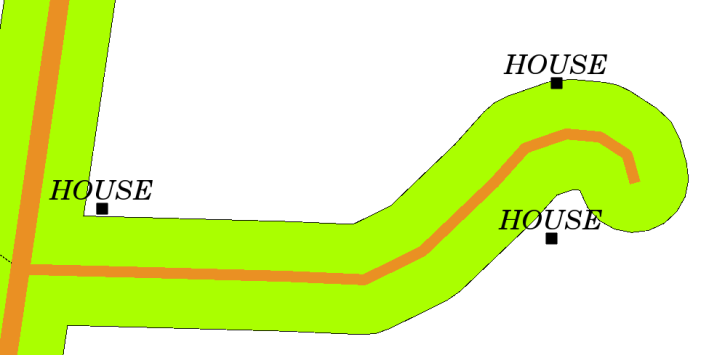
- Because of dramatic traffic increase, the town planners want to widen the main road and add a second lane. Create a buffer around the road to find properties that fall within the buffer zone (see figure_buffer_road).
- For controlling protesting groups, the police want to establish a neutral zone to keep protesters at least 100 meters from a building. Create a buffer around a building and colour it so that event planners can see where the buffer area is.
- A truck factory plans to expand. The siting criteria stipulate that a potential site must be within 1 km of a heavy-duty road. Create a buffer along a main road so that you can see where potential sites are.
- Imagine that the city wants to introduce a law stipulating that no bottle stores may be within a 1000 meter buffer zone of a school or a church. Create a 1 km buffer around your school and then go and see if there would be any bottle stores too close to your school.
Figure Buffer Road 1:
考えてみよう
利用可能なコンピュータを持っていないならば、建物の周辺にバッファゾーンを作成するために、トポシートとコンパスを使うことができます。コンパスを使って地物に沿って等距離で小さい鉛筆マークを入力してください、それからルーラを使ってマークをつないでください!
より詳しく知りたい場合は
図書:
Galati, Stephen R. (2006): Geographic Information Systems Demystified. Artech House Inc. ISBN: 158053533X
- Chang, Kang-Tsung (2006). Introduction to Geographic Information Systems. 3rd Edition. McGraw Hill. ISBN: 0070658986
- DeMers, Michael N. (2005). Fundamentals of Geographic Information Systems. 3rd Edition. Wiley. ISBN: 9814126195
ウェブサイト:
QGISユーザーガイドでは, QGISにおけるベクタ分析についてより詳細な情報が含まれています.
次は?
次のセクションでは、ラスタデータを使った空間解析の例として**補間**について詳しく見ましょう。
