Dati Raster
 |
Obiettivi |
Capire cos’è un dato raster e come può essere usato in un GIS |
Parole chiave |
Raster, Pixel, Remote Sensing, Satelliti, Immagini, Georeferenziazione |
Visione generale
Nell’argomento precedente abbiamo dato uno sguardo a dati vettoriali. Mentre gli elementi vettoriali usano delle geometrie (punti, polilinee e poligoni) per rappresentare il mondo reale, i dati raster hanno un approccio differente. I raster sono composti da matrici di pixel (chiamati anche celle), ciascuna contenente un valore che rappresenta le condizioni dell’area coperta dalla cella (vedi figura_raster). In questo argomento andremo ad analizzare da vicino i dati raster, quando è utile usarli e quando ha più senso utilizzare dati vettoriali.
Figure Raster 1:
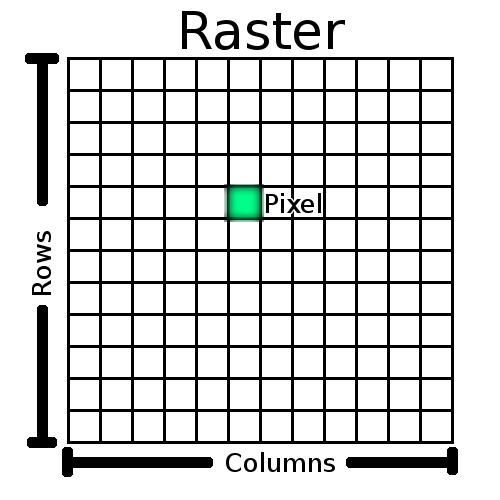
Un set di dati raster è composto da righe (che corrono in orizzontale) e colonne (che corrono in verticale) di pixel (anche noti come celle). Ogni pixel rappresenta una regione geografica, ed il valore del pixel rappresenta una caratteristica di tale regione.
Dettaglio dati raster
I dati raster vengono usati nelle applicazioni GIS quando si vogliono visualizzare delle informazioni che sono continue lungo un area e che non sono facilmente divisibili in oggetti vettoriali. Quando abbiamo introdotto i dati vettoriali, ti abbiamo fatto vedere l’immagine in figure_landscape. Point, dove polilinee e poligoni funzionano bene nel rappresentare alcune caratteristiche di questo paesaggio come alberi, strade e ingombri degli edifici. Altre caratteristiche del paesaggio sono molto più difficili da rappresentare usando dati vettoriali. Per esempio la distesa erbosa ha molte variazioni di colore e densità di copertura. Potrebbe essere abbastanza semplice creare un singolo poligono per ogni area erbosa, ma molte informazioni verrebbero perse nel processo di semplificazione delle caratteristiche in un unico poligono. Questo perché quando si attribuiscono valori ad un oggetto vettoriale, in realtà si applicano a tutto l’oggetto, rendendolo quindi inadatto a rappresentare caratteristiche che non sono omogenee (ovvero tutte uguali) per tutto il suo insieme. Un altro approccio che potresti usare è di digitalizzare un poligono per ogni piccola variazione di colore e densità di copertura. Il problema con questo approccio è che ci vorrà un tempo enorme per creare un buon set di dati vettoriali.
Figure Landscape 1:
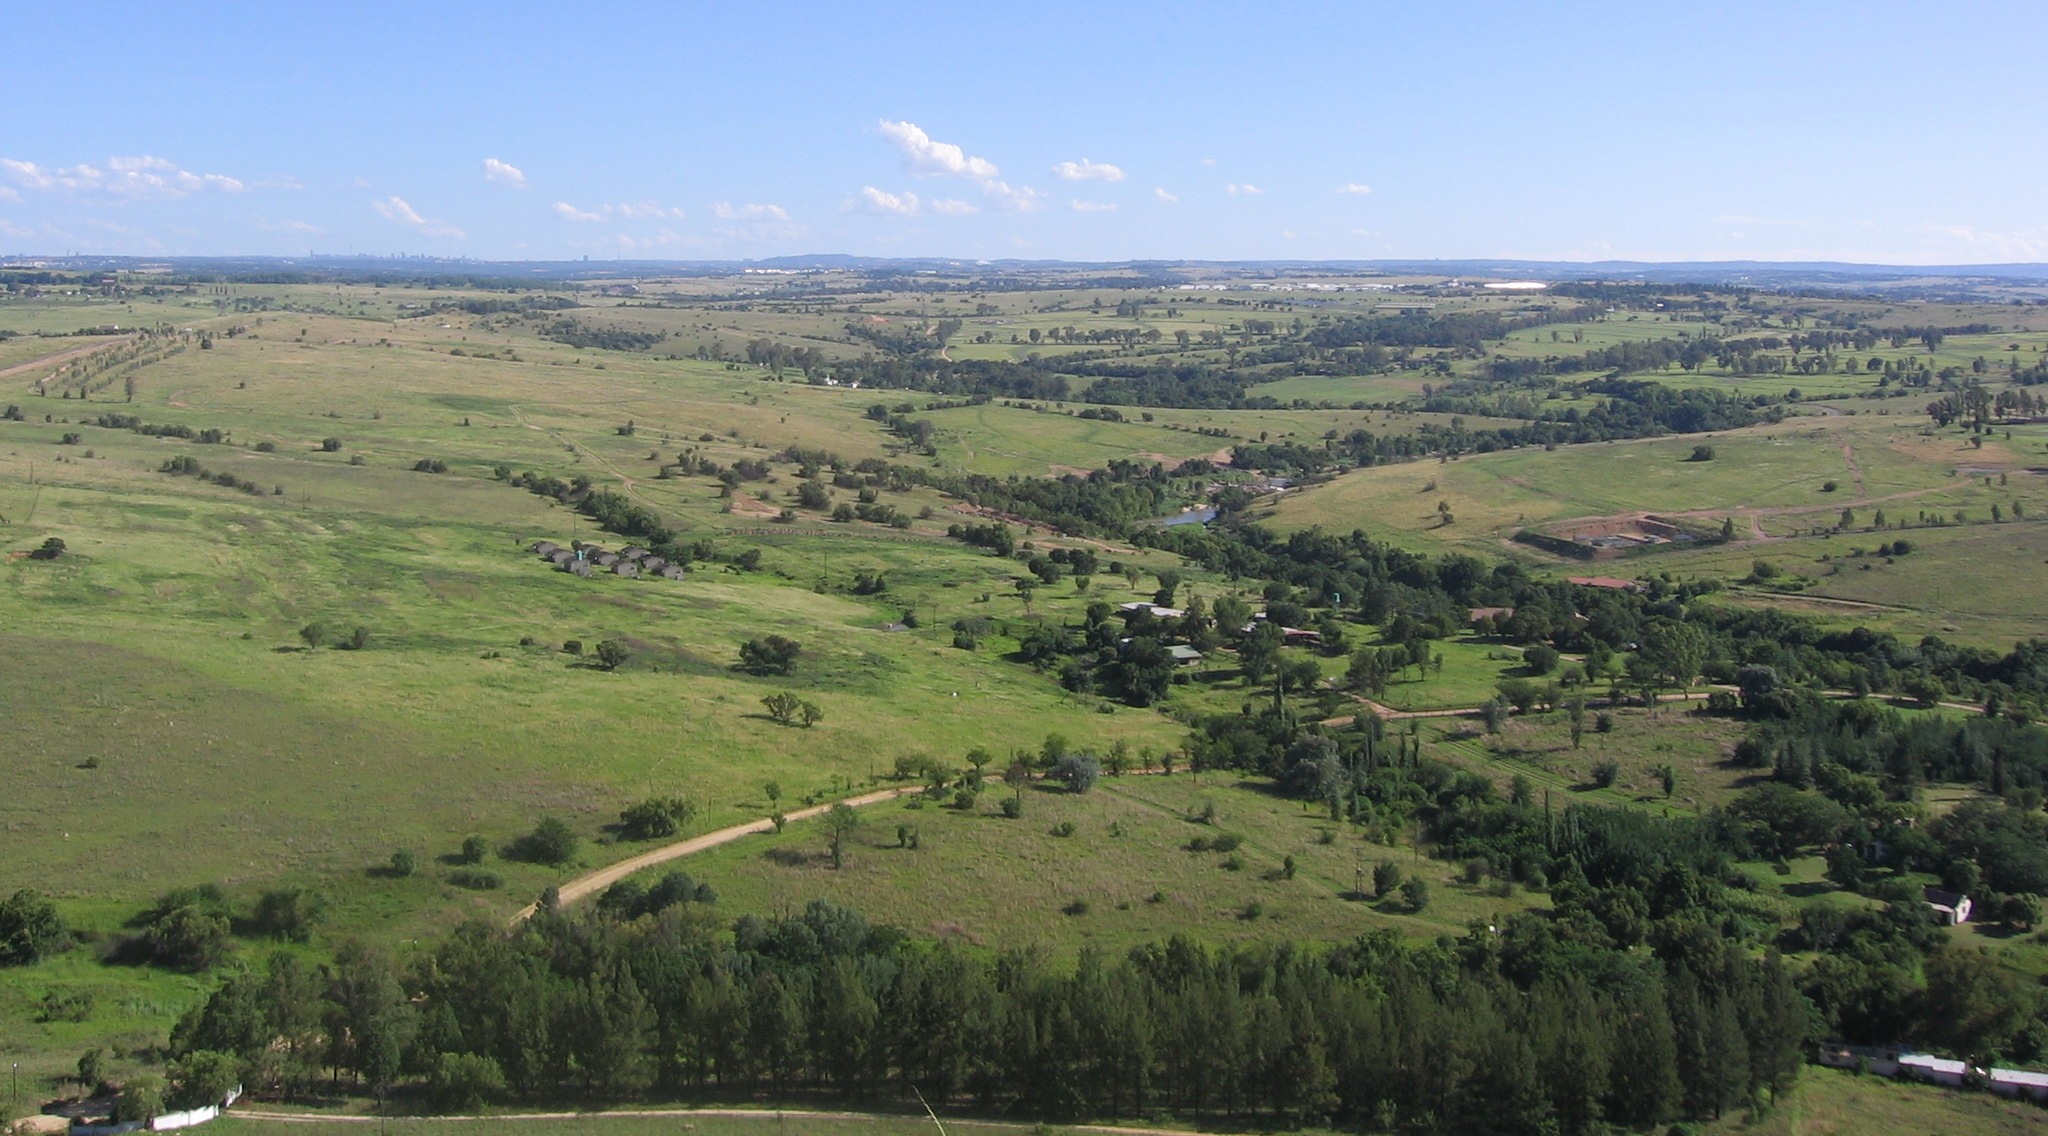
Alcuni elementi di un paesaggio sono facilmente rappresentabili come punti, polilinee e poligoni (ad esempio alberi, strade, case). In altri casirisulta difficile. Ad esempio come è possibile rappresentare le praterie? Come poligoni? Come rappresentare le variazioni di colore dell’erba? Quando vuoi rappresentare aree con valori continuamente mutevoli i dati raster possono essere una scelta migliore.
Usare i dati raster è una soluzione al problema. Molte persone usano i dati raster come sfondo su cui lavorare con i vettori per evidenziarne il significato. L’occhio umano è portato a interpretare le immagini e utilizzare un’immagine dietro i Vettori ne aumenta il significato. I dati raster non sono validi solamente per le immagini che ritraggono la superficie del mondo reale (ad esempio, immagini satellitari e fotografie aeree), ma sono utili anche per la rappresentazione di idee più astratte. Per esempio, puoiusare i raster per mostrare la tendenza alla pioggia su una zona, o per descrivere il rischio di incendio su un territorio. In questo tipo di applicazioni, ogni cella del raster rappresenta un valore diverso, ad esempio il rischio di incendio su una scala da uno a dieci.
Puoi vedere un esempio che mostra la differenza tra un’immagine da satellite e una che mostra valori derivati nella figure_raster_types
Figure Raster Types 1:
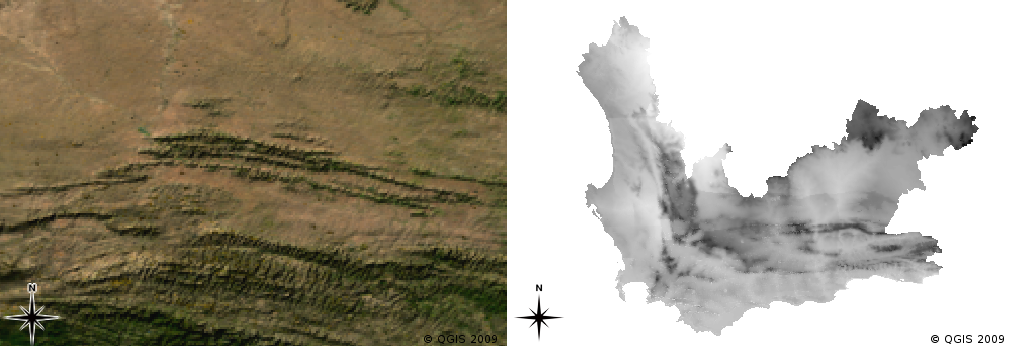
Immagini raster a colori reali (a sinistra) sono utili in quanto offrono molti di dettagli difficili da rappresentare come elementi vettoriali ma facili da vedere guardando l’immagine raster. I dati raster possono quindi essere dati non-fotografici: come ad esempio il raster a destra che mostra la temperatura media minima calcolata Western Cape per il mese di marzo.
Georeferenziazione
La georeferenziazione è il processo per definire esattamente dove sulla superficie terrestre un’mmagine o un insieme di dati raster sono stati creati. Queste informazioni spaziali sono memorizzate nella versione digitale delle fotografie aeree. Quando l’applicazione GIS apre la foto, utilizza le informazioni di posizione per garantire che la foto venga visualizzata nella posizione corretta sulla mappa. Normalmente questa informazione spaziale consiste nelle coordinate per il pixel in alto a sinistra dell’immagine, la dimensione di ogni pixel nella direzione X, la dimensione di ogni pixel nella direzione Y, e la somma (se presente) con cui l’immagine è ruotata , Con queste poche informazioni, l’applicazione GIS può garantire che i dati raster siano riportati nella posizione corretta. Le informazioni di georeferenziazione per un raster sono spesso assegnate ad un piccolo file di testo che accompagna il raster.
Fonti di dati raster
I dati raster può essere ottenuto in vari modi. Due dei modi più comuni sono la fotografia aerea e le immagini satellitari. Nella fotografia aerea, l’aereo vola con una telecamera puntata sulla zona sottostante. Le fotografie sono poi caricate su un computer e georeferenziate. Le immagini satellitari sono create dal passaggio dei satelliti orbitanti con speciali fotocamere digitali puntate verso la terra. Una volta che l’immagine è stata rilevata, viene inviata sulla Terra tramite segnali radio a speciali stazioni riceventi come quello mostrato in figure_csir_station. Il processo di acquisizione dei dati raster da un aereo o via satellite si chiama telerilevamento.
Figure CSIR Station 1:
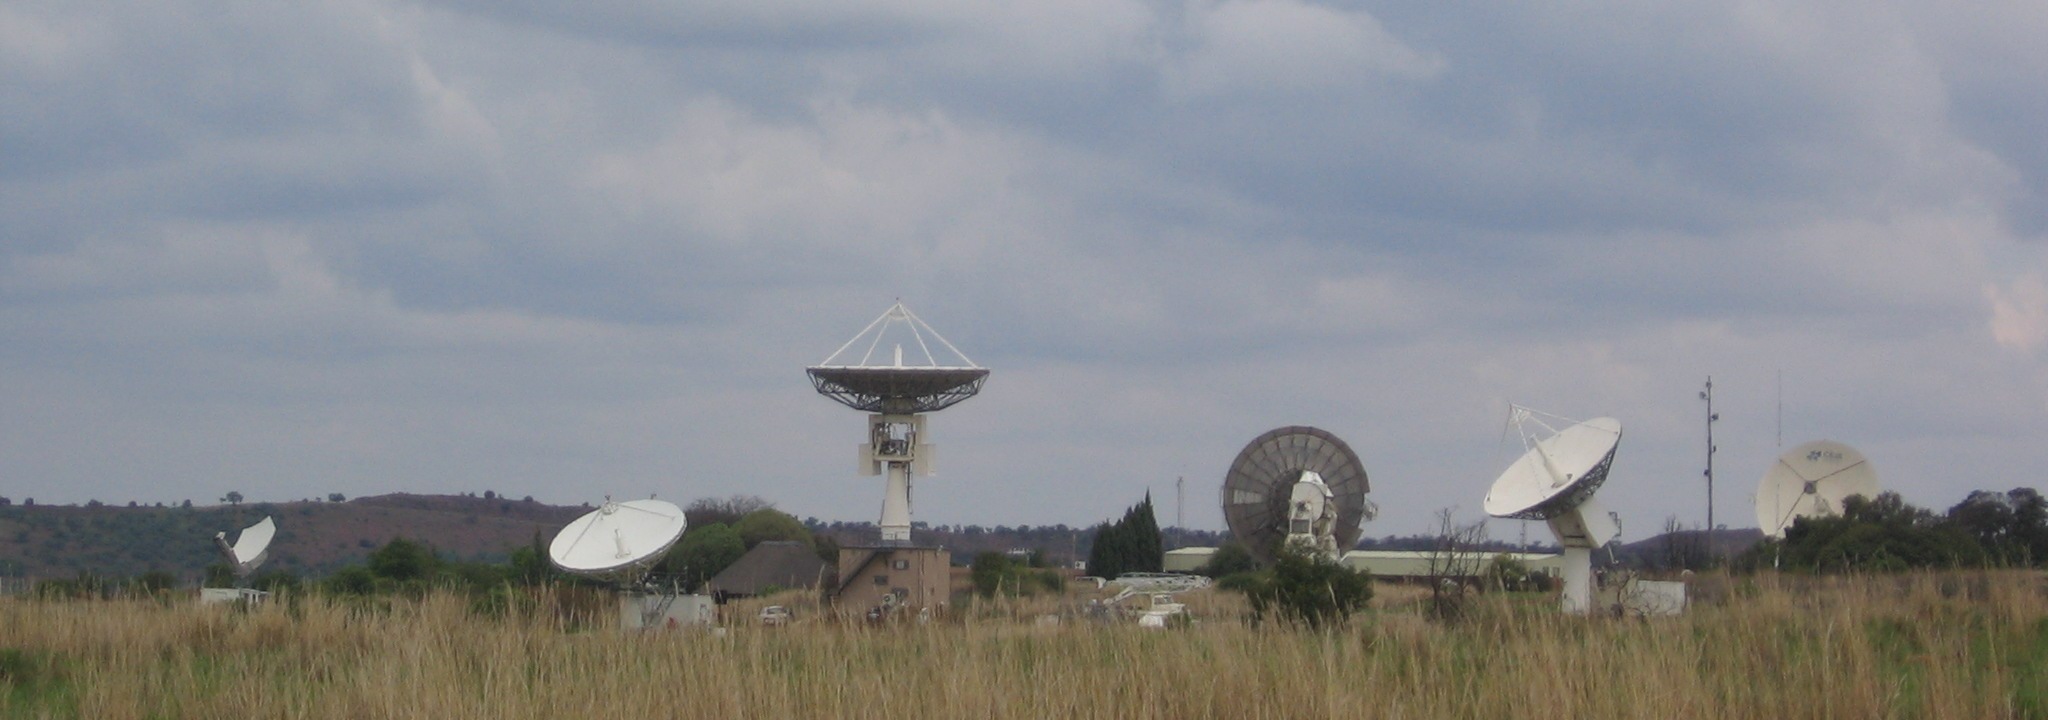
The CSIR Satellite Applications Center a Hartebeeshoek vicino a Johannesburg. Antenne spcializzate rilevano il tracciato dei satelliti e scaricano immagini tramite onde radio
In other cases, raster data can be computed. For example an insurance company may take police crime incident reports and create a country wide raster map showing how high the incidence of crime is likely to be in each area. Meteorologists (people who study weather patterns) might generate a province level raster showing average temperature, rainfall and wind direction using data collected from weather stations (see figure_csir_station). In these cases, they will often use raster analysis techniques such as interpolation (which we describe in Topic Analisi Spaziale (Interpolazione)).
Sometimes raster data are created from vector data because the data owners want to share the data in an easy to use format. For example, a company with road, rail, cadastral and other vector datasets may choose to generate a raster version of these datasets so that employees can view these datasets in a web browser. This is normally only useful if the attributes, that users need to be aware of, can be represented on the map with labels or symbology. If the user needs to look at the attribute table for the data, providing it in raster format could be a bad choice because raster layers do not usually have any attribute data associated with them.
Risoluzione spaziale
Every raster layer in a GIS has pixels (cells) of a fixed size that determine its spatial resolution. This becomes apparent when you look at an image at a small scale (see figure_raster_small_scale) and then zoom in to a large scale (see figure_raster_large_scale).
Figure Raster Scale 1:
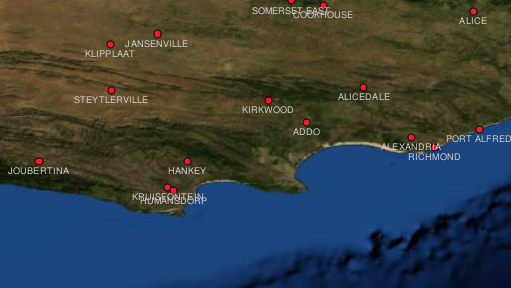
Questa immagine satellitare sembra bella a scala piccola...
Figure Raster Scale 2:
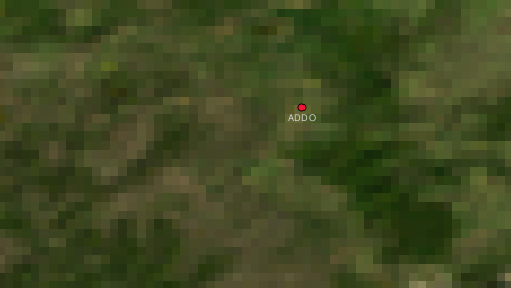
...ma quando è visualizzata a grande scala puoi vedere i singoli pixel di cui è formata.
Several factors determine the spatial resolution of an image. For remote sensing data, spatial resolution is usually determined by the capabilities of the sensor used to take an image. For example SPOT5 satellites can take images where each pixel is 10 m x 10 m. Other satellites, for example MODIS take images only at 500 m x 500 m per pixel. In aerial photography, pixel sizes of 50 cm x 50 cm are not uncommon. Images with a pixel size covering a small area are called ‘high resolution‘ images because it is possible to make out a high degree of detail in the image. Images with a pixel size covering a large area are called ‘low resolution‘ images because the amount of detail the images show is low.
In raster data that is computed by spatial analysis (such as the rainfall map we mentioned earlier), the spatial density of information used to create the raster will usually determine the spatial resolution. For example if you want to create a high resolution average rainfall map, you would ideally need many weather stations in close proximity to each other.
One of the main things to be aware of with rasters captured at a high spatial resolution is storage requirements. Think of a raster that is 3 x 3 pixels, each of which contains a number representing average rainfall. To store all the information contained in the raster, you will need to store 9 numbers in the computer’s memory. Now imagine you want to have a raster layer for the whole of South Africa with pixels of 1 km x 1 km. South Africa is around 1,219,090 km 2. Which means your computer would need to store over a million numbers on its hard disk in order to hold all of the information. Making the pixel size smaller would greatly increase the amount of storage needed.
Sometimes using a low spatial resolution is useful when you want to work with a large area and are not interested in looking at any one area in a lot of detail. The cloud maps you see on the weather report, are an example of this –– it’s useful to see the clouds across the whole country. Zooming in to one particular cloud in high resolution will not tell you very much about the upcoming weather!
On the other hand, using low resolution raster data can be problematic if you are interested in a small region because you probably won’t be able to make out any individual features from the image.
Risoluzione spettrale
If you take a colour photograph with a digital camera or camera on a cellphone, the camera uses electronic sensors to detect red, green and blue light. When the picture is displayed on a screen or printed out, the red, green and blue (RGB) information is combined to show you an image that your eyes can interpret. While the information is still in digital format though, this RGB information is stored in separate colour bands.
Whilst our eyes can only see RGB wavelengths, the electronic sensors in cameras are able to detect wavelengths that our eyes cannot. Of course in a hand held camera it probably doesn’t make sense to record information from the non-visible parts of the spectrum since most people just want to look at pictures of their dog or what have you. Raster images that include data for non-visible parts of the light spectrum are often referred to as multi-spectral images. In GIS recording the non-visible parts of the spectrum can be very useful. For example, measuring infra-red light can be useful in identifying water bodies.
Because having images containing multiple bands of light is so useful in GIS, raster data are often provided as multi-band images. Each band in the image is like a separate layer. The GIS will combine three of the bands and show them as red, green and blue so that the human eye can see them. The number of bands in a raster image is referred to as its spectral resolution.
If an image consists of only one band, it is often called a grayscale image. With grayscale images, you can apply false colouring to make the differences in values in the pixels more obvious. Images with false colouring applied are often referred to as pseudocolour images.
Conversione da raster a vettore
In our discussion of vector data, we explained that often raster data are used as a backdrop layer, which is then used as a base from which vector features can be digitised.
Another approach is to use advanced computer programs to automatically extract vector features from images. Some features such as roads show in an image as a sudden change of colour from neighbouring pixels. The computer program looks for such colour changes and creates vector features as a result. This kind of functionality is normally only available in very specialised (and often expensive) GIS software.
Conversione da vettore a raster
Sometimes it is useful to convert vector data into raster data. One side effect of this is that attribute data (that is attributes associated with the original vector data) will be lost when the conversion takes place. Having vectors converted to raster format can be useful though when you want to give GIS data to non GIS users. With the simpler raster formats, the person you give the raster image to can simply view it as an image on their computer without needing any special GIS software.
Analisi raster
There are a great many analytical tools that can be run on raster data which cannot be used with vector data. For example, rasters can be used to model water flow over the land surface. This information can be used to calculate where watersheds and stream networks exist, based on the terrain.
Raster data are also often used in agriculture and forestry to manage crop production. For example with a satellite image of a farmer’s lands, you can identify areas where the plants are growing poorly and then use that information to apply more fertilizer on the affected areas only. Foresters use raster data to estimate how much timber can be harvested from an area.
Raster data is also very important for disaster management. Analysis of Digital Elevation Models (a kind of raster where each pixel contains the height above sea level) can then be used to identify areas that are likely to be flooded. This can then be used to target rescue and relief efforts to areas where it is needed the most.
Problemi comuni / cose di cui essere consapevoli
As we have already mentioned, high resolution raster data can require large amounts of computer storage.
Cosa abbiamo imparato?
Riassumiamo il contenuto di questi appunti:
I dati raster sono matrici di pixel di dimensioni regolari.
- Raster data are good for showing continually varying information.
- The size of pixels in a raster determines its spatial resolution.
- Raster images can contain one or more bands, each covering the same spatial area, but containing different information.
- When raster data contains bands from different parts of the electromagnetic spectrum, they are called multi-spectral images.
- Three of the bands of a multi-spectral image can be shown in the colours Red, Green and Blue so that we can see them.
Immagini a banda singola vengono chiamate immagini a toni di grigio.
- Single band, grayscale images can be shown in pseudocolour by the GIS.
Le immagini raster possono consumare molto spazio.
Adesso prova tu!
Di seguito alcune idee da provare con le vostre nuove conoscenze:
- Discuss with your learners in which situations you would use raster data and in which you would use vector data.
- Get your learners to create a raster map of your school by using A4 transparency sheets with grid lines drawn on them. Overlay the transparencies onto a toposheet or aerial photograph of your school. Now let each learner or group of learners colour in cells that represent a certain type of feature e.g. building, playground, sports field, trees, footpaths etc. When they are all finished, overlay all the sheets together and see if it makes a good raster map representation of your school. Which types of features worked well when represented as rasters? How did your choice in cell size affect your ability to represent different feature types?
Qualcosa su cui pensare
If you don’t have a computer available, you can understand raster data using pen and paper. Draw a grid of squares onto a sheet of paper to represent your soccer field. Fill the grid in with numbers representing values for grass cover on your soccer field. If a patch is bare give the cell a value of 0. If the patch is mixed bare and covered, give it a value of 1. If an area is completely covered with grass, give it a value of 2. Now use pencil crayons to colour the cells based on their values. Colour cells with value 2 dark green. Value 1 should get coloured light green, and value 0 coloured in brown. When you finish, you should have a raster map of your soccer field!
Altre letture
Book:
Chang, Kang-Tsung (2006). Introduction to Geographic Information Systems. Terza edizione. McGraw Hill. ISBN: 0070658986
DeMers, Michael N. (2005). Fundamentals of Geographic Information Systems. Terza edizione. Wiley. ISBN: 9814126195
Sito web: http://en.wikipedia.org/wiki/GIS#Raster
La guida dell’utente di QGIS fornisce anche infromazioni più dettagliate su come utilizzare i dati raster in QGIS
Cosa viene adesso?
Nel prossima sezione daremo un’occhiata più da vicino alla topologia per vedere come le relazioni tra oggetti vettoriali possono essere utilizzate per assicurare una migliore qualità dei dati